Chapter 19 – Strategic Performance Measurement: Investment Centers
19-11
Education.
Chapter 19 – Strategic Performance Measurement: Investment Centers
Chapter 19 – Strategic Performance Measurement: Investment Centers
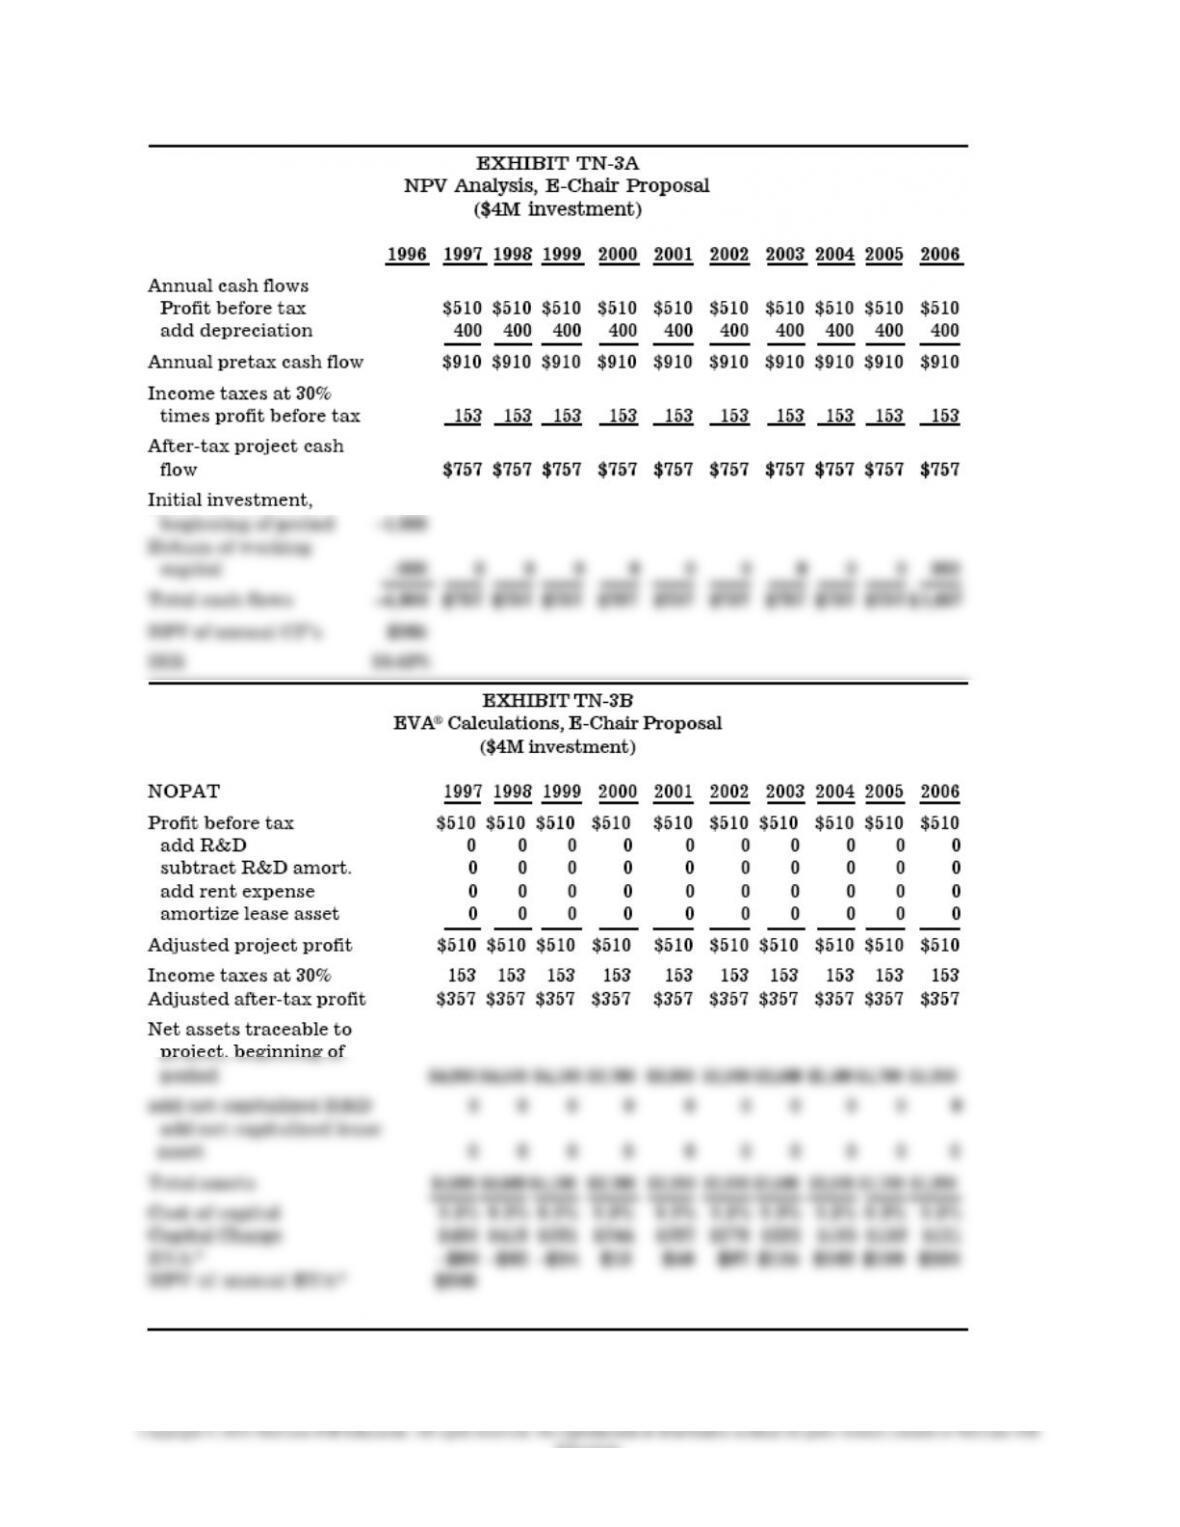
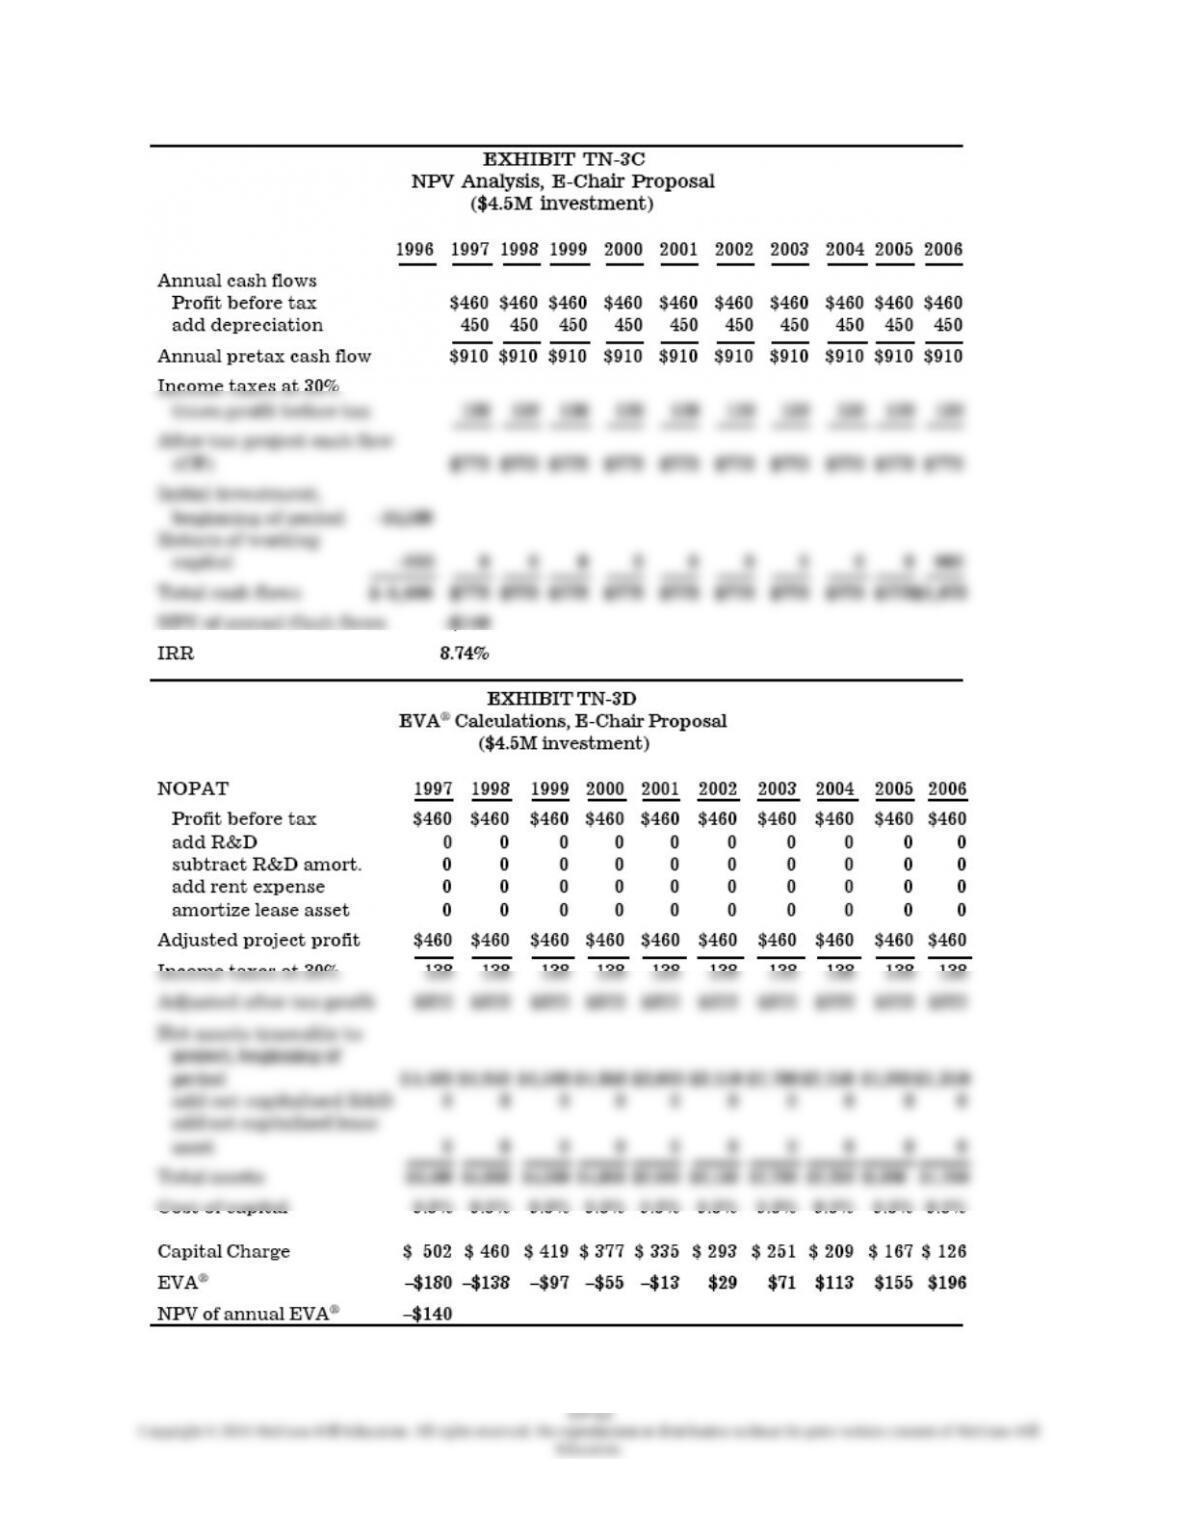
Discussion of Non-NPV Criteria for Evaluating the Proposal
• Payback and earnings fail to alert the decision maker about the sensitivity of the decision to the level of
the investment in depreciable assets.
• Focusing on the level of EVA® in the early years can lead to the “wrong” decision. Even managers with
a three-year horizon might reject a positive NPV project (as it is when the investment in depreciable
assets is $4 million). Interestingly, focusing on incremental division profits in the early years can
inadvertently lead to the “correct” decision (when the investment in depreciable assets is $4 million).
Qualitative Factors
• What is likely to be the effect of the E-chair proposal on sales of other Company products? The case
suggests that the E-chair might cross-sell the AI version of the seat. While it strikes us that it is a stretch to
argue that airline seating could sell high-end office chairs, other OS products might benefit from
introducing the E-chair. (This is in contrast to many situations where new products cannibalize sales of
existing products.)
• Are some of the assumptions listed above likely to be violated? If so, how might it affect the decision?
will reduce both debt and equity capital. (We have not included the data necessary to calculate financial
leverage.)
other things equal, we expect to see increases in total asset turnover, inventory turnover, AR turnover, etc.
(We have not included the data necessary to calculate these ratios.)
19-13
Education.
3. EVA® should mitigate but not eliminate incentives to emphasize short-run performance. Annual EVA®
is still based on a one-period historical model. However, accounting “distortions” such as the requirement
to expense R&D are “corrected” in calculating EVA®. In practice, EVA® compensation plans are often
implemented as rolling three-year targets in order to lengthen the managers’ planning horizon.
For example, without lengthening the time horizon, a proposal might be rejected because it produces
before explicitly incorporating the measure into management incentive compensation plans. (Of course it
is possible that all the accolades for EVA® are due to self-selection, i.e., of those firms that consider
EVA®, the only ones that adopt it are successful firms that can “afford” to take a charge for equity
capital.) Many firms now include disclosure about their use of an EVA® performance measure; however,
they do not report actual EVA® performance.
Journal of Applied Corporate Finance discusses these costs. Zimmerman (1997) gives the example of a
firm that capitalizes a large amount of R&D expense, leading to high and growing EVA® and high
EVA®-based bonuses. In his example, the stock price is also rising because the market looks beyond the
GAAP numbers to the EVA® results, believing the R&D will pay off. Unfortunately in this example a
new scientific discovery destroys the usefulness of the firm’s R&D expenditures, leading to a sharp drop
in the stock price. The R&D must be written off, leading to a sharp drop in EVA®. (No adjustment is
needed for GAAP earnings since R&D is already expensed.) In retrospect, the managers received large
EVA®-based bonuses that now appear unwarranted. A potential shareholder lawsuit could result because
the large EVA®-based bonuses may appear self-serving, given that GAAP earnings were much lower all
along. Some CPA firms might relish the opportunity to work with firms that adopt EVA®. Several of the
large accounting firms currently market versions of similar shareholder value measures.
Supplemental Questions
5. Note that this question does not directly deal with the merits of EVA®. Instead it addresses the more
general topic of accounting-based vs. stock-based compensation. No, it is probably a good idea to
continue to tie at least some of the managers’ incentive compensation to accounting (or EVA®)
performance even after the stock is publicly traded (Lambert 1993, 101). A reason to have an incentive

6. Note that this question is closely related to question 2b above. The CFO’s arguments are theoretically
correct, i.e., pay out excess cash flow when positive NPV projects cannot be identified. However, the
Marketing VP’s position is common and understandable, given that managers generally are not diversified
(especially when one considers the amount of human capital tied up in the firm and frictions in the
managerial labor market). Thus, it is rational for managers to want to reduce their personal risk by
promotions (and most salary increases are associated with promotions)
> prestige and perks are associated with larger firms
Summary of Benefits and Costs of Switching to EVA®
Benefits include:
• Better aligns incentives with owners’ interests
• Like other investment-center performance metrics, forces managers to explicitly consider
• Better aligns performance evaluation with project selection based on NPV
Costs of switching to EVA® include:
• Installation and education of managers, e.g., it may be difficult to compute division-level cost of
capital or determine asset base attributable to each division.
On balance, EVA® is probably a good idea for OS and, perhaps, for AI and the Company as a whole. (No
historical measure of performance, e.g., earnings, cash flow or EVA®, gets around the fundamental issue
that the key driver for success at AI is obtaining a new order.) We believe performance measurement and
19-15
Education.

Chapter 19 – Strategic Performance Measurement: Investment Centers
incentive compensation should be based on more than accounting numbers alone (whether they be
19-16
Education.

Chapter 19 – Strategic Performance Measurement: Investment Centers
Teaching Notes for Readings
Reading 19-1: “Does ROI Apply to Robotic Factories?” by Gerald H. Lander and
Mohamed E. Bayou, Management Accounting (May 1992), pp. 49-53.
This article provides a useful summary of the limitations of ROI performance evaluation of investment
centers. Three criteria for appropriate ROI measures are proposed: (1) the ROI measure must include
long-term performance, (2) the ROI measure must consider cash flows, and (3) the ROI measure must
consider the time value of money. Also, the authors argue that the ROI measure should be consistent with
the phases of the project life:
First: acquisition of the new investment
Second: use of the new investment
Third: disposition of the investment
Four methods are developed and illustrated for a hypothetical investment in robotics. The four methods
are: (1) annual book ROI, (2) average ROI (over the project’s life), (3) discounted book ROI, and (4)
discounted cash flow ROI. The authors explain how the different methods are to be used at the different
phases of the project’s life.
Discussion Questions:
1. Which ROI method(s) should be used at each of the phases of the project’s life?
2. What is the profitability index and how is it used?
3. What are the limitations of ROI, and how does the authors’ proposed approach deal with these
limitations?
The limitations are presented in the first section of the article:
a. short term focus
this article, the investment in robotic factories)
The authors’ approach is to limit the problems of ROI by using DCF-ROI for all phases of the
investment’s life. There is no discussion of why so few firms do this in practice, or of the difficulties in
implementing a DCF-based evaluation system.
19-17
Education.

Chapter 19 – Strategic Performance Measurement: Investment Centers
Note: This article makes extensive use of the concept of the time value of money, and thus can also be
used in Chapter 12, Capital Budgeting (Long-term Investment Analysis).
Reading 19-2: “Transfer Pricing with ABC” by Robert S. Kaplan, Dan Weiss, and
Eyal Desheh, Management Accounting (May 1997), pp. 20-22, 24-26, 28.
This article explains how Teva Pharmaceutical Industries Ltd adopted transfer pricing and ABC to
enhance profits, to improve coordination between operations and marketing, and to reduce the
proliferation of new product lines and small volume orders. The article explains why a marginal cost
(based on materials cost only) approach and other traditional approaches to transfer pricing did not work
for Teva. Teva introduced ABC costing in its plants, and used this cost information for transfer pricing.
The article explains how the ABC based transfer pricing system incorporated batch level costs, product-
based costs, and plant-based costs.
Discussion Questions:
1. Why did Teva introduce transfer pricing?
2. What were the goals of the new transfer pricing system? How did top management, divisional
managers, and financial staff differ about these goals?
a) To encourage marketing managers to make decisions consistent with the long-run profit of
their division. The new system should not promote decisions that would improve profit of a
Division managers wanted a system that would:
a) report the financial performance of their division fairly
b) reflect controllable factors, so they would be rewarded for favorable changes due to changes
The financial staff wanted a system that would:
Overall, the financial staff was primarily focused on the implementation of the system, and the division
managers more interested in the outcomes (the incentive effects, etc.) of the system.
3. Why did traditional approaches for transfer pricing not work at Teva, and why did the ABC
approach work instead?
19-18
Chapter 19 – Strategic Performance Measurement: Investment Centers
the traditional methods for overhead allocation did not capture the actual cost structure at Teva’s
The negotiated price method was not used because top management expected it to lead to
continuous conflict and excessive time on nonproductive discussions.
The ABC system addressed these issues because it provided a more accurate cost number such that
overhead costs were properly accounted for, and the problems associated with the variable costs and
negotiation methods could be avoided.
4. How did the ABC transfer pricing system incorporate batch level costs? Product-level costs?
Plant-level costs?
5. What are some of the benefits of the ABC transfer pricing system at Teva?
better understanding and forecasting of cost behavior
19-19
Education.

Chapter 19 – Strategic Performance Measurement: Investment Centers
Reading 19-3: “Free Lunches and ROI” by Harry Zvi Davis, Solomon Appel, and
Gordon Cohn, Management Accounting Quarterly, Vol. 9, No. 2 (Winter 2008), pp.
16-25.
This article begins with an observation that ROI is the mostly widely used financial-performance
indicator, for both investment centers and entire business entities. It then develops a scenario in which,
apparently, divisional managers are able to secure for one another a “free lunch” (i.e., something for
nothing). As such, the paper provides motivates students to think about the ability of managers to
manipulate, to their own advantage, metrics by which their performance (and rewards) will be gauged.
Discussion Questions
1. Explain the primary differences and similarities between ROI (return on investment) and RI
(residual income).
Both ROI and RI are summary measures of financial performance. Both are measures of short-term
performance. Both rely on reported accounting information. Both can be used to assess the
performance of business segments classified as “investment centers.”
profitability, while the latter is a relative measure of profitability. (See question 3 below.)
2. What primary limitation of using a relative performance measure (i.e., a ratio, such as ROI) to
evaluate the performance of managers and organizational subunits is illustrated in this paper?
In this article, the authors pose the question: “Is there such a thing as a free lunch?” They raise this
question in the context of an example where, at least to the naked eye, “performance” (i.e., ROI) was
created from “nothing” (that is, from inter-divisional transfers of units).
Each of two divisional managers had total assets of approximately $3.5 billion, and each had 24
(independent) segments/subunits. Jill, the manager of the highest performing division, had an ROI of
from 5.09% to 7.86%–seemingly a “free lunch.” (The mathematical proof of this phenomenon is
contained in the sidebar titled “Transferring Segments Affects Average ROI.”) Note, however, that the
19-20
Education.