Chapter 18 – Strategic Performance Measurement: Cost Centers, Profit Centers, and the Balanced Scorecard
18-50 (continued -1)
Other GAAP issues include differences between profit centers in:
a) Judgments of the allowance for bad debts
g) The effect of judgment in choosing the method for cost allocation
when profit centers share a common resource or service
h) Accounting for leases
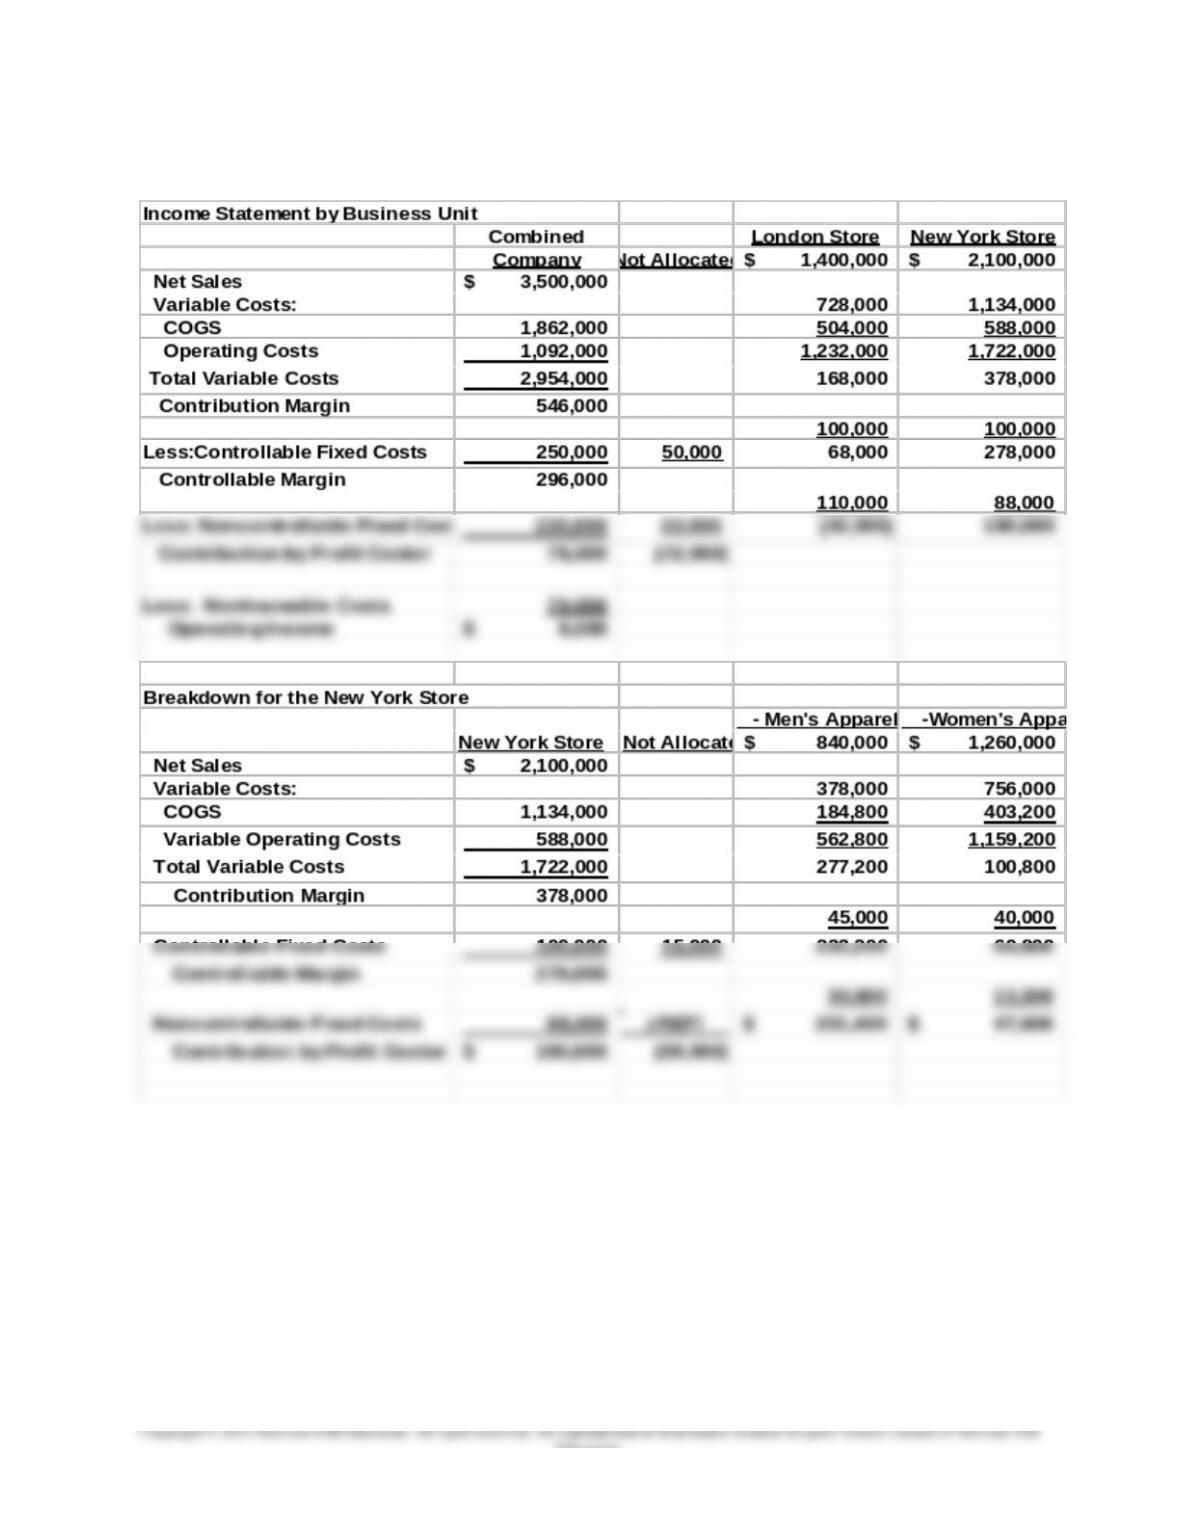
The use of a contribution type of income statement as explained in
the chapter can provide an improvement over full cost-based profit
since it incorporates the concepts of traceability and controllability.
If the instructor wishes, this problem provides a good opportunity to
discuss the relationship between GAAP and IFRS and the potential
impact of the convergence of GAAP to IFRS on performance
measurement, particularly of profit centers. As noted in the chapter,
18-51
Education.
Chapter 18 – Strategic Performance Measurement: Cost Centers, Profit Centers, and the Balanced Scorecard
18-50 (continued -2)
2. The proposals fit solidly within the range of proposals made by many
authors in performance management (management control systems),
financial statement analysis, and cost management. In particular the
proposal for combination of measures is widely accepted, and
and urgency to the proposal for a market oriented approach for
performance measurement is the on-going consideration at the SEC
of the convergence of U.S. GAAP and International Financial
Reporting Standards. International reporting standards have a much
stronger focus on market value, allowing under certain conditions for
long-lived assets to be measured at market value, and for research
and development costs to be capitalized, in contrast to the more
conservative cost-based approach for long-lived assets and expense-
based approach to R&D in U.S. GAAP.
18-52
Education.
Chapter 18 – Strategic Performance Measurement: Cost Centers, Profit Centers, and the Balanced Scorecard
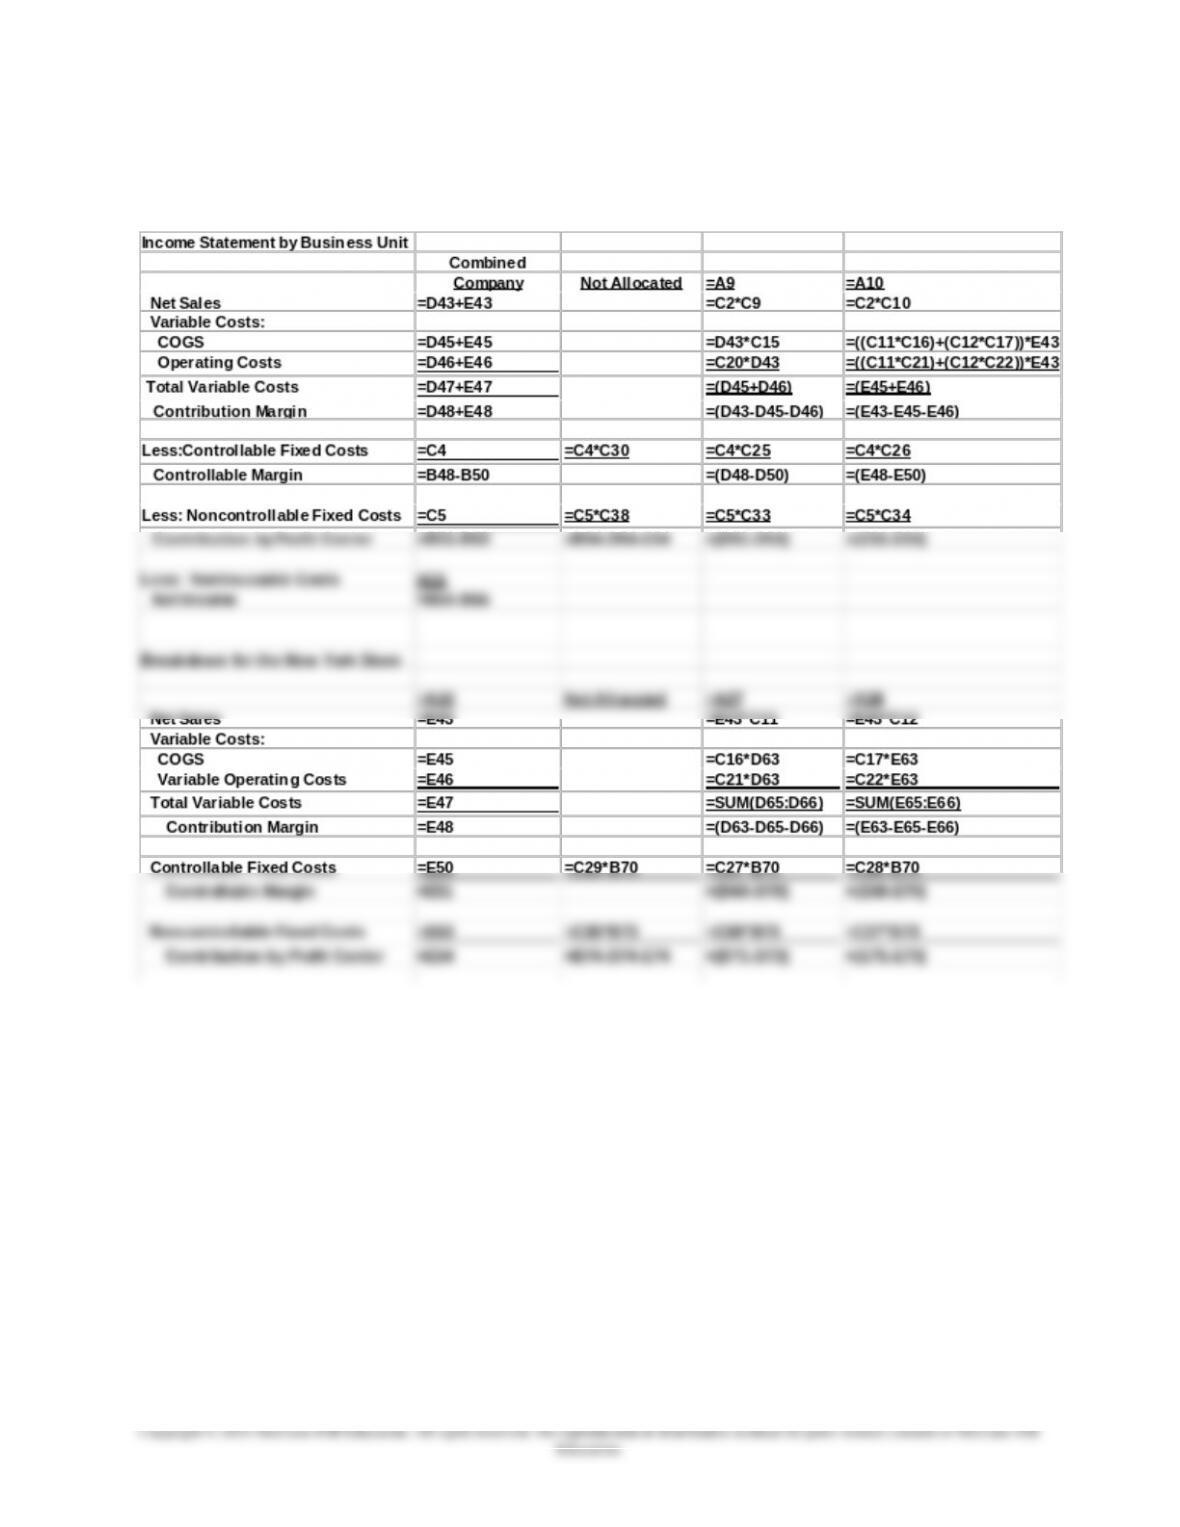
18-51 Contribution Income Statement; Spreadsheet
Application(25 min)
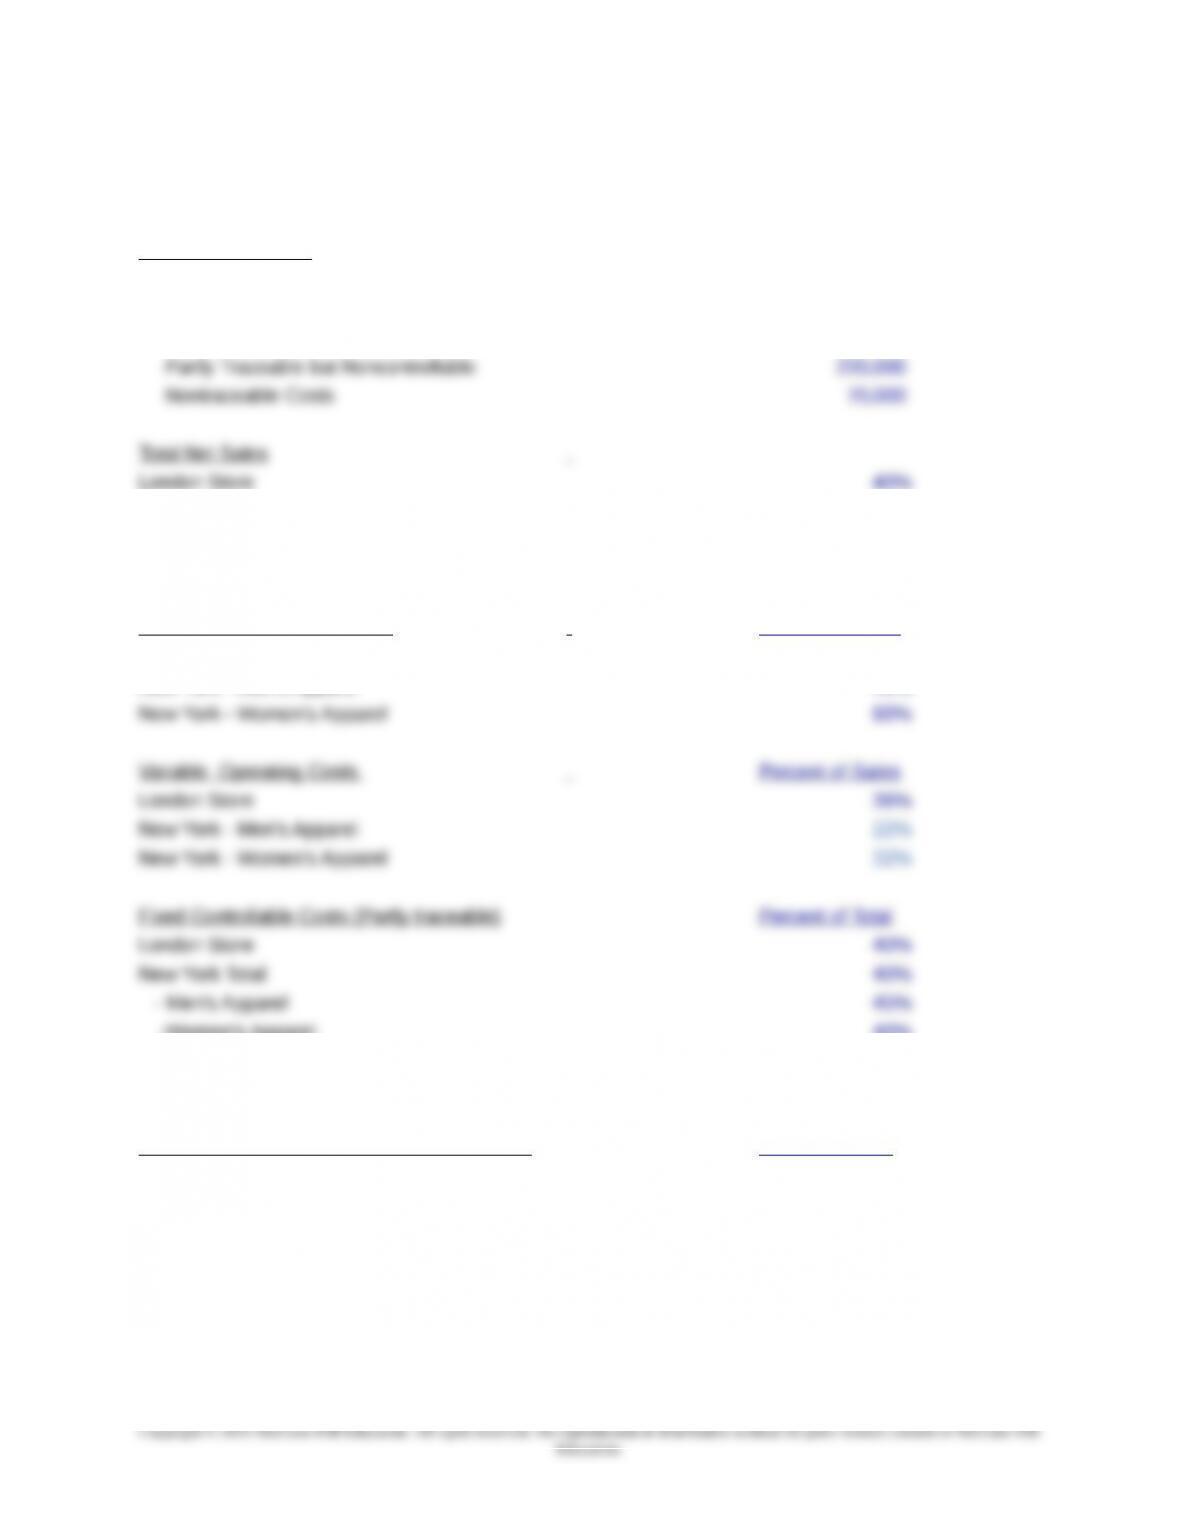
Data (in thousands)
Total Net Sales $ 3,500,000
Fixed Costs
Partly Traceable and Controllable 250,000
New York Store 60%
New York – Men’s Apparel 40%
New York – Women’s Apparel 60%
Cost of Goods Sold (Variable) Percent of Sales
London Store 52%
New York – Men’s Apparel 45%
-Women’s Apparel 40%
-Could not be Traced to Men’s or Women’s Apparel 15%
Could not be Traced to London or New York 20%
Fixed Noncontrollable Costs (Partly traceable) Percent of Total
London Store 50%
New York Total 40%
-Men’s Apparel 35%
-Women’s Apparel 15%
-Could not be Traced to Men or Women’s Apparel 50%
Could not be Traced to London or New York stores 10%
18-51 (continued -1)
18-53
Chapter 18 – Strategic Performance Measurement: Cost Centers, Profit Centers, and the Balanced Scorecard
18-54
Education.
Chapter 18 – Strategic Performance Measurement: Cost Centers, Profit Centers, and the Balanced Scorecard
18-51 (continued -2)
The formulas for the above spreadsheet are as follows:
18-55
Chapter 18 – Strategic Performance Measurement: Cost Centers, Profit Centers, and the Balanced Scorecard
18-51 (continued – 3)
2. The global issues for High Fashion include foreign currency
translation, as the U.S. dollar fluctuates relative the U.K. pound. For
example, the U.S. dollar increased in value approximately 25%
relative to the pound during 2008 and then the two currencies were
been relatively stable into 2013. The dollar then began losing value,
reaching a low in late November, 2014, before a new phase of
increase began and it reached a high as of April 2015. The higher
value of the dollar in 2008 meant that the company’s sales in the U.K.
would be at higher prices, with the probable effect of reducing those
Other global issues include the state of the economies of the
different countries where Fashionisto is doing business. For
example, in 2011, the economies of both the U.S. and the U.K. were
in recession. Economists in mid-2011 had not stated clearly when
the global recession and debt crisis might abate, so the company
needs to adjust its strategy to effectively deal with a radically different
sales outlook. The economies did not emerge from this recession as
the same time, and this could mean significant changes in the types
of clothing carried at the various locations, the hours the stores are
open, and new product offerings, among other measures. In keeping
structure this type of broadened evaluation.
Chapter 18 – Strategic Performance Measurement: Cost Centers, Profit Centers, and the Balanced Scorecard
18-52 Validating the Balanced Scorecard; Spreadsheet Application
(35 min)
1. The balanced scorecard is a more comprehensive approach to
strategic performance measurement. In addition to profit, it includes
2. The correlation matrix for the data are shown below. Some
observations are as follows:
There is a high correlation (r= .89) on the customer survey data with
the sales increase variable, indicating that the survey is a valuable
on this measure.
Training hours appears to have no effect on store success. This is a
surprising result which should be examined by store managers and
district managers to determine the cause. Are the in-house training
sessions properly focused and of the desired quality?
Note that there is a high negative correlation between wait time and
18-57
Education.
Chapter 18 – Strategic Performance Measurement: Cost Centers, Profit Centers, and the Balanced Scorecard
18-52 (continued -1)
The change in sales at each of the stores is driven by a number of factors
in addition to those in the analysis shown here. For example, the
economic environment at each store could be changing for better or worse.
Also, a given store might be impacted by the opening or closing of a
competitive store in its area. A full validation study would attempt to
capture as many of these additional variable as possible.
The correlations results for the data:
Sales Survey Review Wait Time Hours
Sales 1.000000000
Survey 0.887385586 1.000000000
Note: correlations greater than .5 are significant at p < .05
18-58
Education.
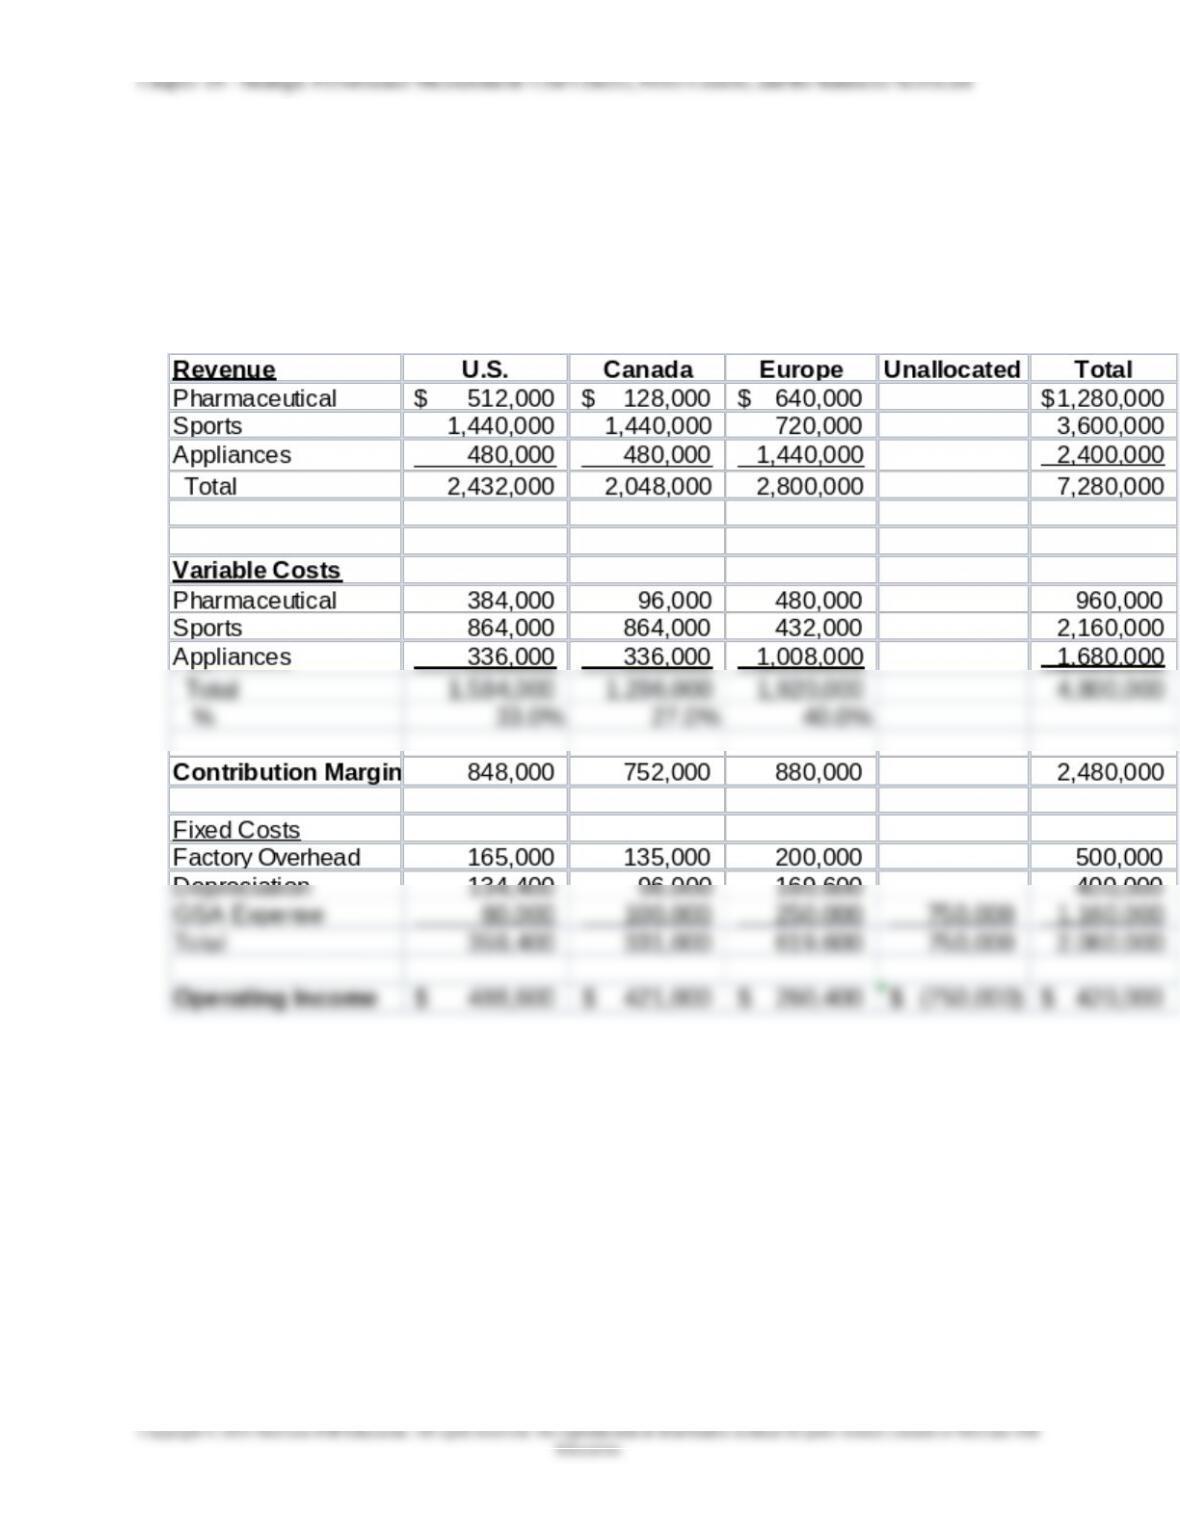
18-53 Contribution Income Statement for Profit Centers; Strategy;
International (60 min)
1. Stratford Corporation
Statement of Income by Geographic Area
For the Fiscal Year Ended April 30
18-59
Chapter 18 – Strategic Performance Measurement: Cost Centers, Profit Centers, and the Balanced Scorecard
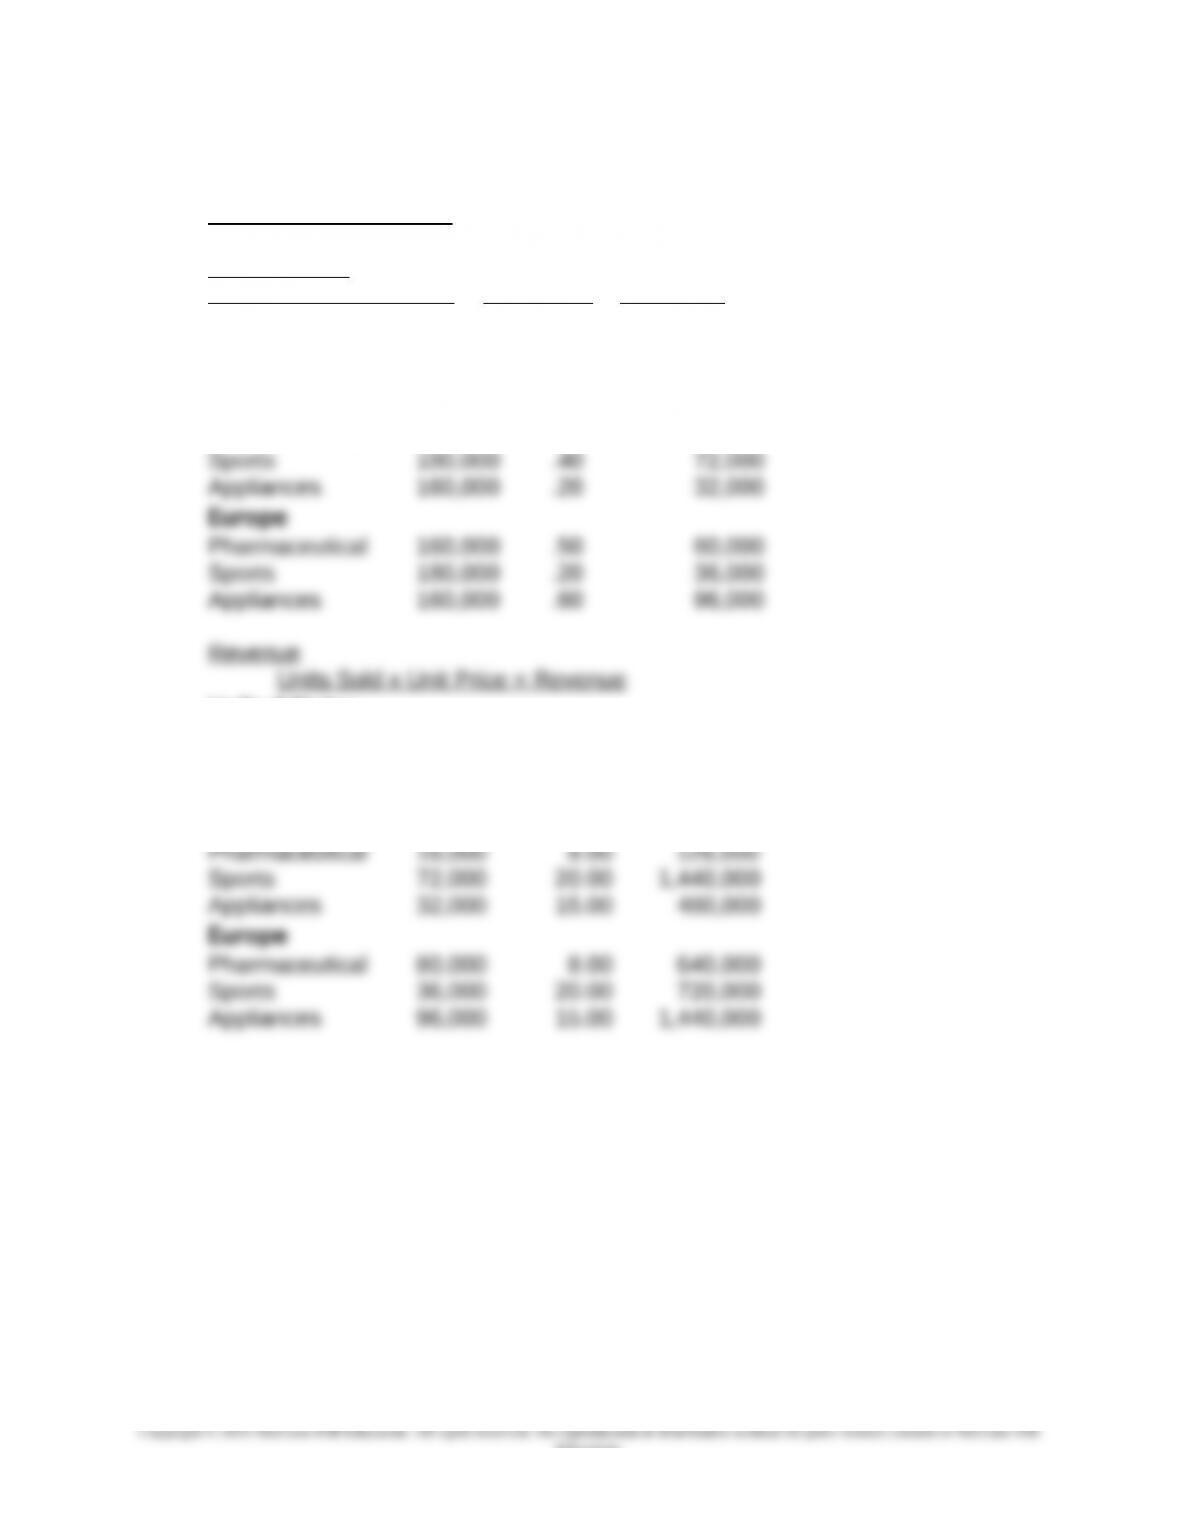
18-53 (continued -1)
Supporting Calculations
Sales in Units
United StatesTotal Units X % of Sales = Units Sold
Pharmaceutical 160,000 .40 64,000
Sports 180,000 .40 72,000
Appliances 160,000 .20 32,000
Canada
Pharmaceutical 160,000 .10 16,000
United States
Pharmaceutical 64,000 $8.00 $512,000
Sports 72,000 20.00 1,440,000
Appliances 32,000 15.00 480,000
Canada
18-60
Education.