Chapter 18 – Strategic Performance Measurement: Cost Centers, Profit Centers, and the Balanced Scorecard
18-40 Financial Incentives and Auto Repair/Inspection Companies (20
min)
The findings of the research suggest that in fact the financial incentives of
the auto repair shop are to pass vehicles that fail the emissions test
because many of the owners of these vehicles are regular customers. The
auto repair shop wants to retain these customers for the more lucrative
work of replacing tires, batteries, and performing repair work. The loss of
a customer due to a failed test could be very costly to the repair shop in the
long term.
The financial incentives needed to ensure compliance with the inspection
standards require independence between the shop owner and the vehicle
owner. Independent inspection stations that only perform inspections
would be one answer to the problem, but this solution could be a very
reducing or eliminating state sales tax on this type of work, by using state
income tax credits or partial reimbursements as financial incentives for the
motorist to perform the needed emissions-related work. The key issue is to
provide the financial incentives for the auto owner to keep their vehicles
emission-compliant.
The ethical issues arise clearly in this case as the shop owner and the
vehicle owner have financial incentives not to follow the state’s regulations
regarding emission controls.
The sustainability issue is also clear. The failure to perform proper
inspections could lead to a greater number of vehicles on the road with
emissions problems, increasing greenhouse gasses and reducing the
quality of the environment.
Reference: Pierce, L. and J. Snyder. (2008). “Ethical Spillovers in Firms:
Evidence from Vehicle Emissions Testing.” Management Science 54 (11):
pp 1891-1903.
Chapter 18 – Strategic Performance Measurement: Cost Centers, Profit Centers, and the Balanced Scorecard
18-41 Allocation of Central Costs; Profit Centers (30 min)
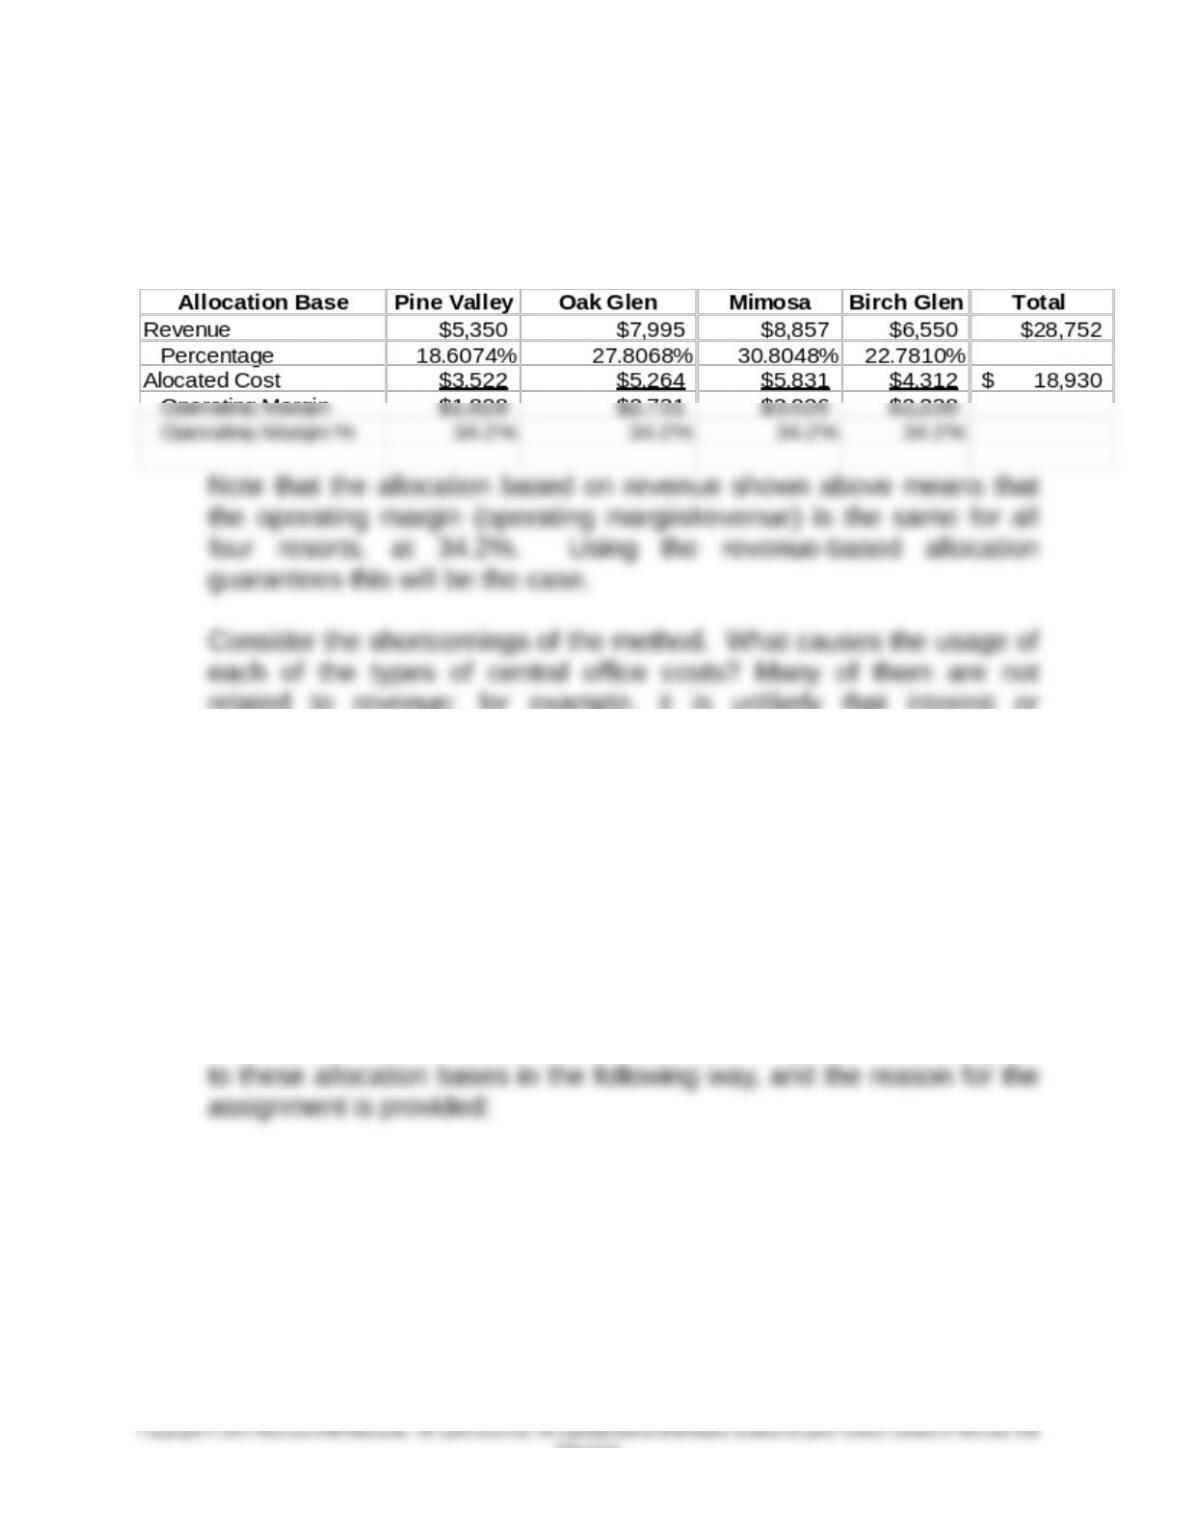
1. Allocation based on revenue
related to revenue; for example, it is unlikely that interest or
administrative and executive salaries are closely related to revenue.
Also, the cost of front office personnel is likely to be related to same
measure of the number of customers of the resort. Perhaps the
number of rooms is a better measure of the usage of the cost of front
office personnel.
2. There are a number of possible answers. A useful starting point for
class discussion might be the following solution:
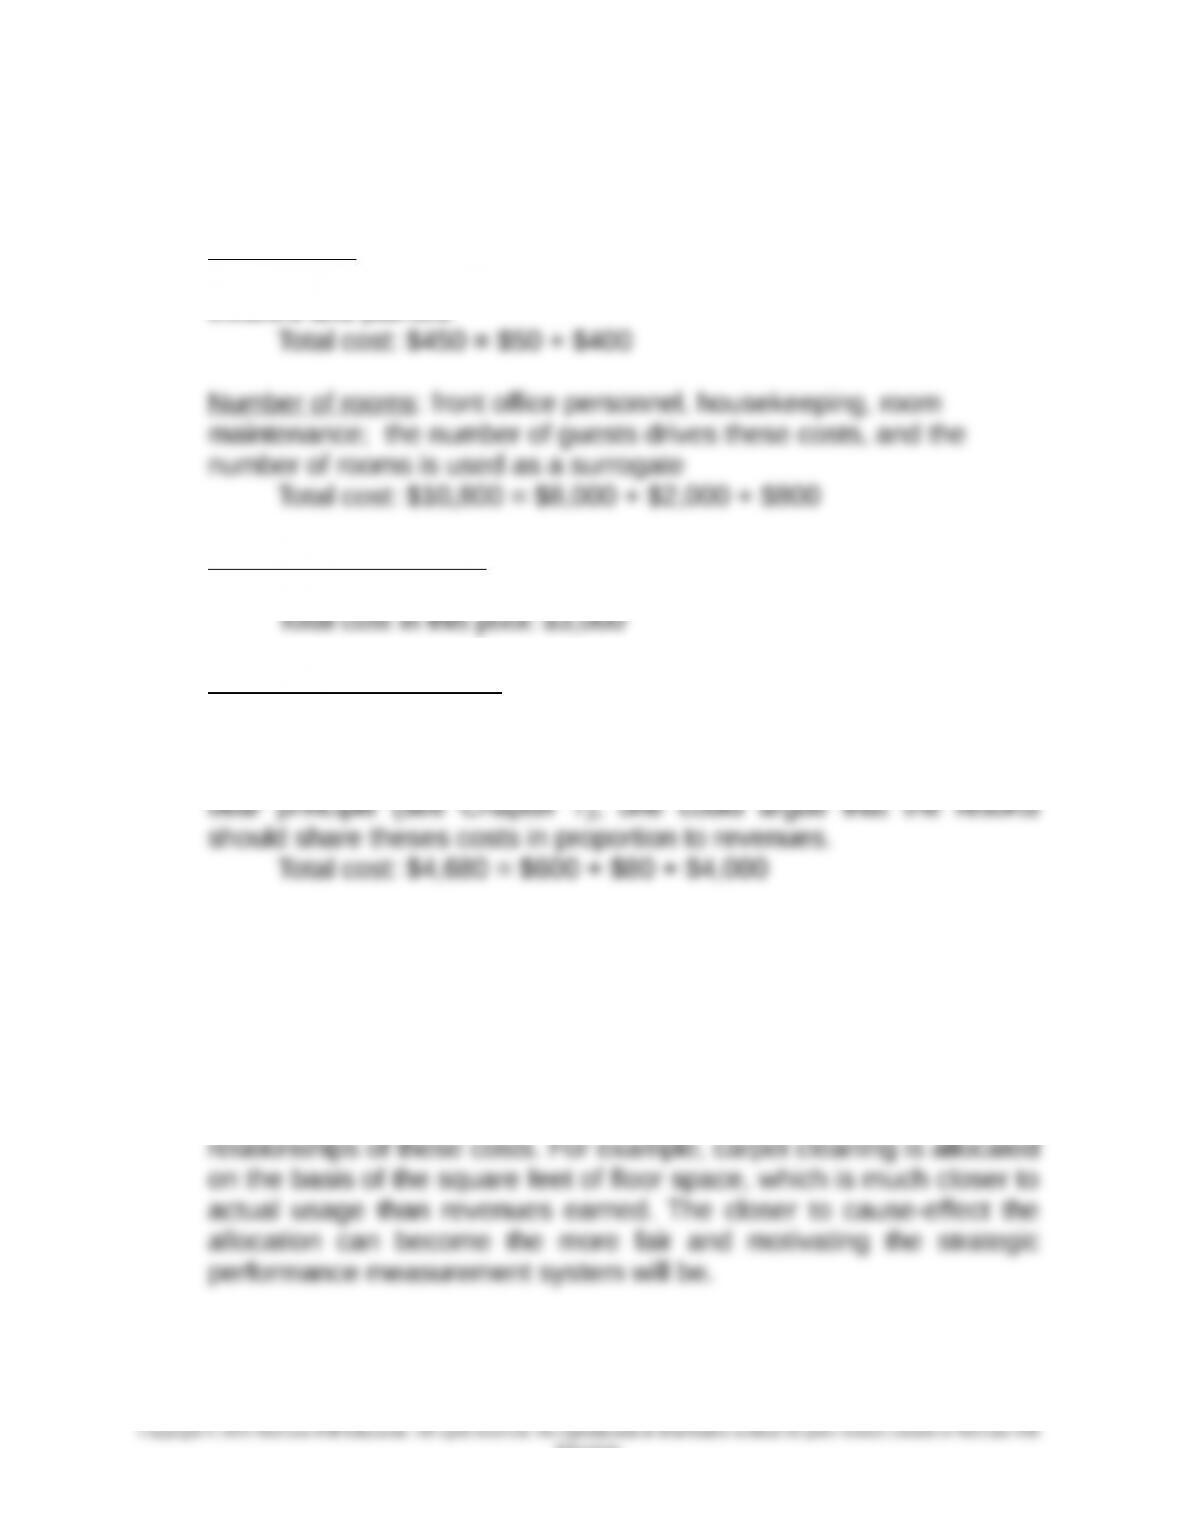
The four allocation bases are revenues, square feet, number of
rooms, and value of resort assets. The operating costs are assigned
18-32
Education.
Chapter 18 – Strategic Performance Measurement: Cost Centers, Profit Centers, and the Balanced Scorecard
18-41 (continued -1)
Square Feet: carpet cleaning, contract to repaint rooms; it could be
argued that these costs are driven by the size of the areas to be
cleaned and painted
Value of resort’s assets: interest on resort purchase; the reasoning
here is that the cost of the assets is what drives interest cost
Revenue cost pool: advertising, depreciation on reservations
computer system, administrative and executive salaries. These are
the office costs that cannot be traced to one of the above costs
drivers (square feet, number of rooms, assets), but using the ability to
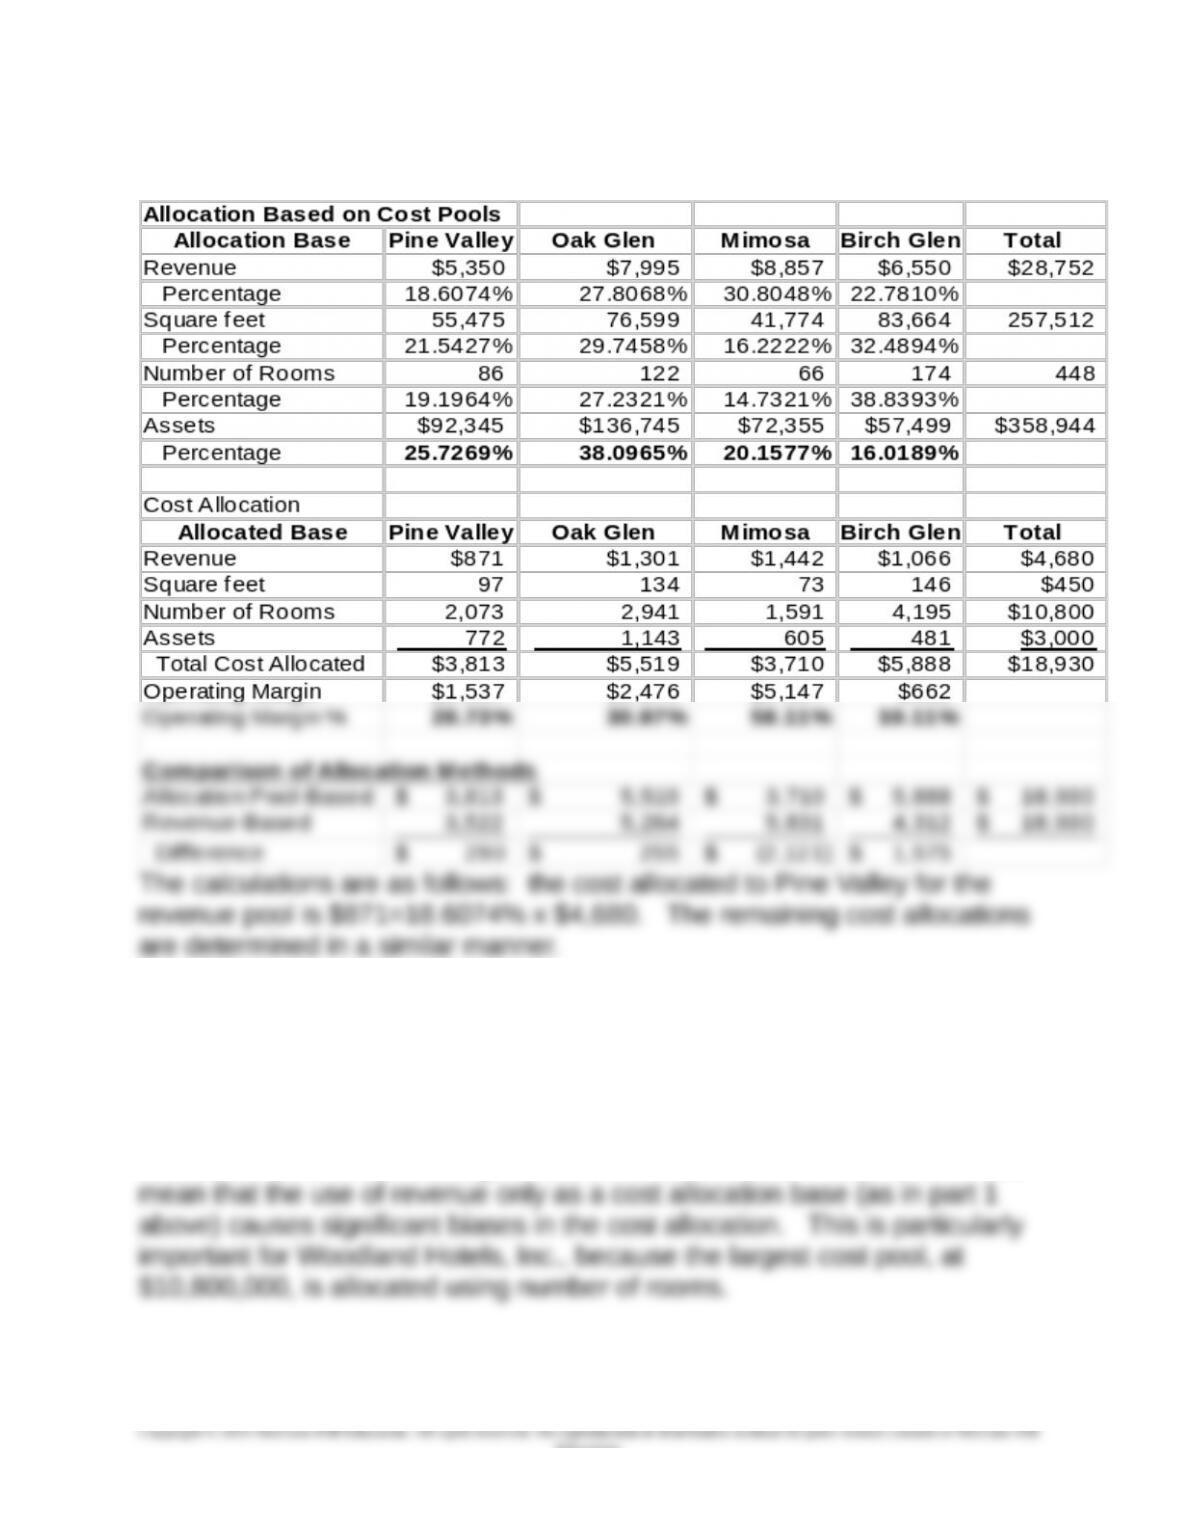
3. Cost Allocation
This part can be compared to the application of ABC costing in
chapter 5; the goal is to allocate costs in a manner that most nearly
reflects the consumption of the costs.
The allocation using the multiple cost pools is preferred because it
allocates costs in a manner more closely related to the cause-effect
18-33
Education.
Chapter 18 – Strategic Performance Measurement: Cost Centers, Profit Centers, and the Balanced Scorecard
18-41 (continued -2)
The allocation rates for each of the four cost drivers are determined above.
Note the large differences between the rates for revenue and for the
number of rooms; relative to Oak Glen, Pine Valley is a smaller resort with
lower room rates, while Mimosa is also a smaller resort but with higher
rates, and Birch Glen is a larger resort with lower rates. These differences
18-34
Education.
Chapter 18 – Strategic Performance Measurement: Cost Centers, Profit Centers, and the Balanced Scorecard
18-41 (continued -3)
Based on the relationship between revenue and number of rooms,
the result is that Pine Valley and Oak Glen’s cost allocation and operating
margin are similar under the revenue-only and the multiple-driver
18-35
Education.
Chapter 18 – Strategic Performance Measurement: Cost Centers, Profit Centers, and the Balanced Scorecard
18-42 Product Cost Under Full versus Variable Costing (10 min)
1.
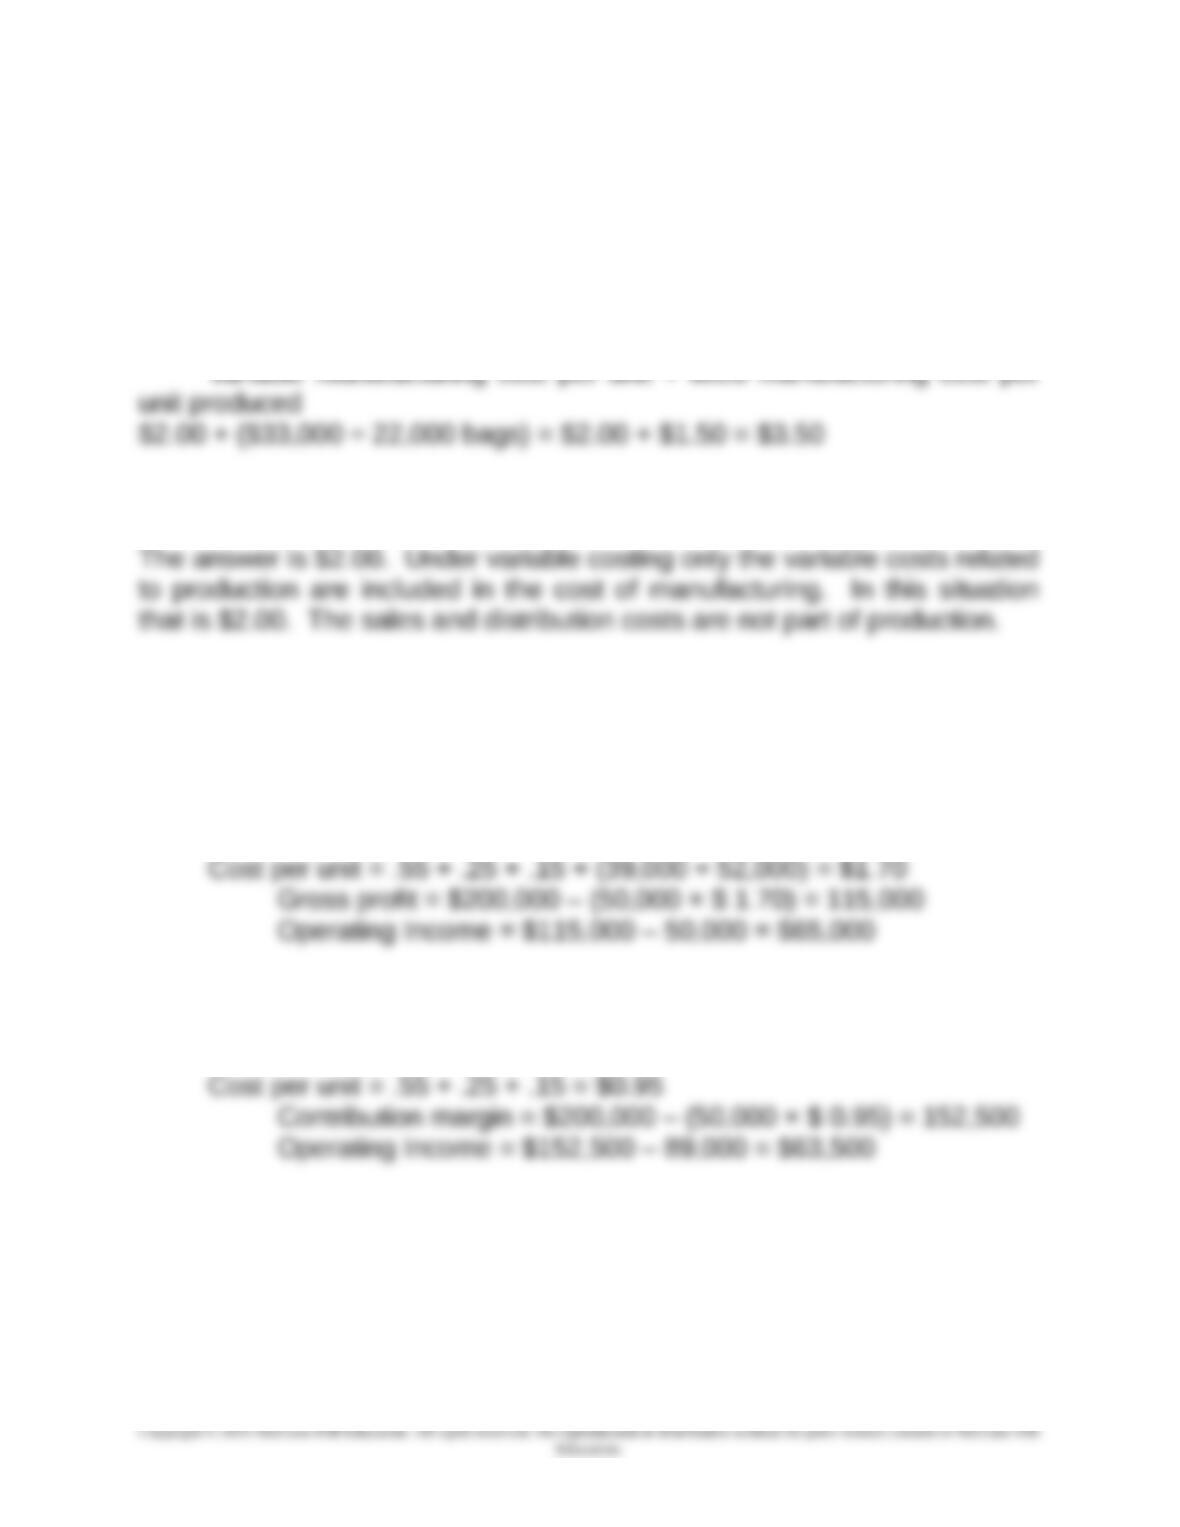
Under absorption costing both the fixed and variable production costs are
used to determine the cost of each unit produced. The number of units
sold (20,000) is irrelevant to the cost of production.
2.
18-43 Full Costing and Variable Costing Operating Income (15 min)
1.
Revenue = 50,000 × $ 4.00 = $200,000
2.
Revenue = 50,000 × $ 4.00 = $200,000
18-36
Chapter 18 – Strategic Performance Measurement: Cost Centers, Profit Centers, and the Balanced Scorecard
18-44 Profit Centers: Comparison of Variable and Full Costing (20
min)
PART ONE
DATA SUMMARY Prior Year Current Year
Units
Beginning Inventory 0 200
Price $ 3.00 $ 3.00
Sold 1,800 2,200
Produced 2,000 2,000
Unit Variable Costs
Manufacturing $ 0.60 $ 0.60
Selling and Administrative $ 0.40 $ 0.40
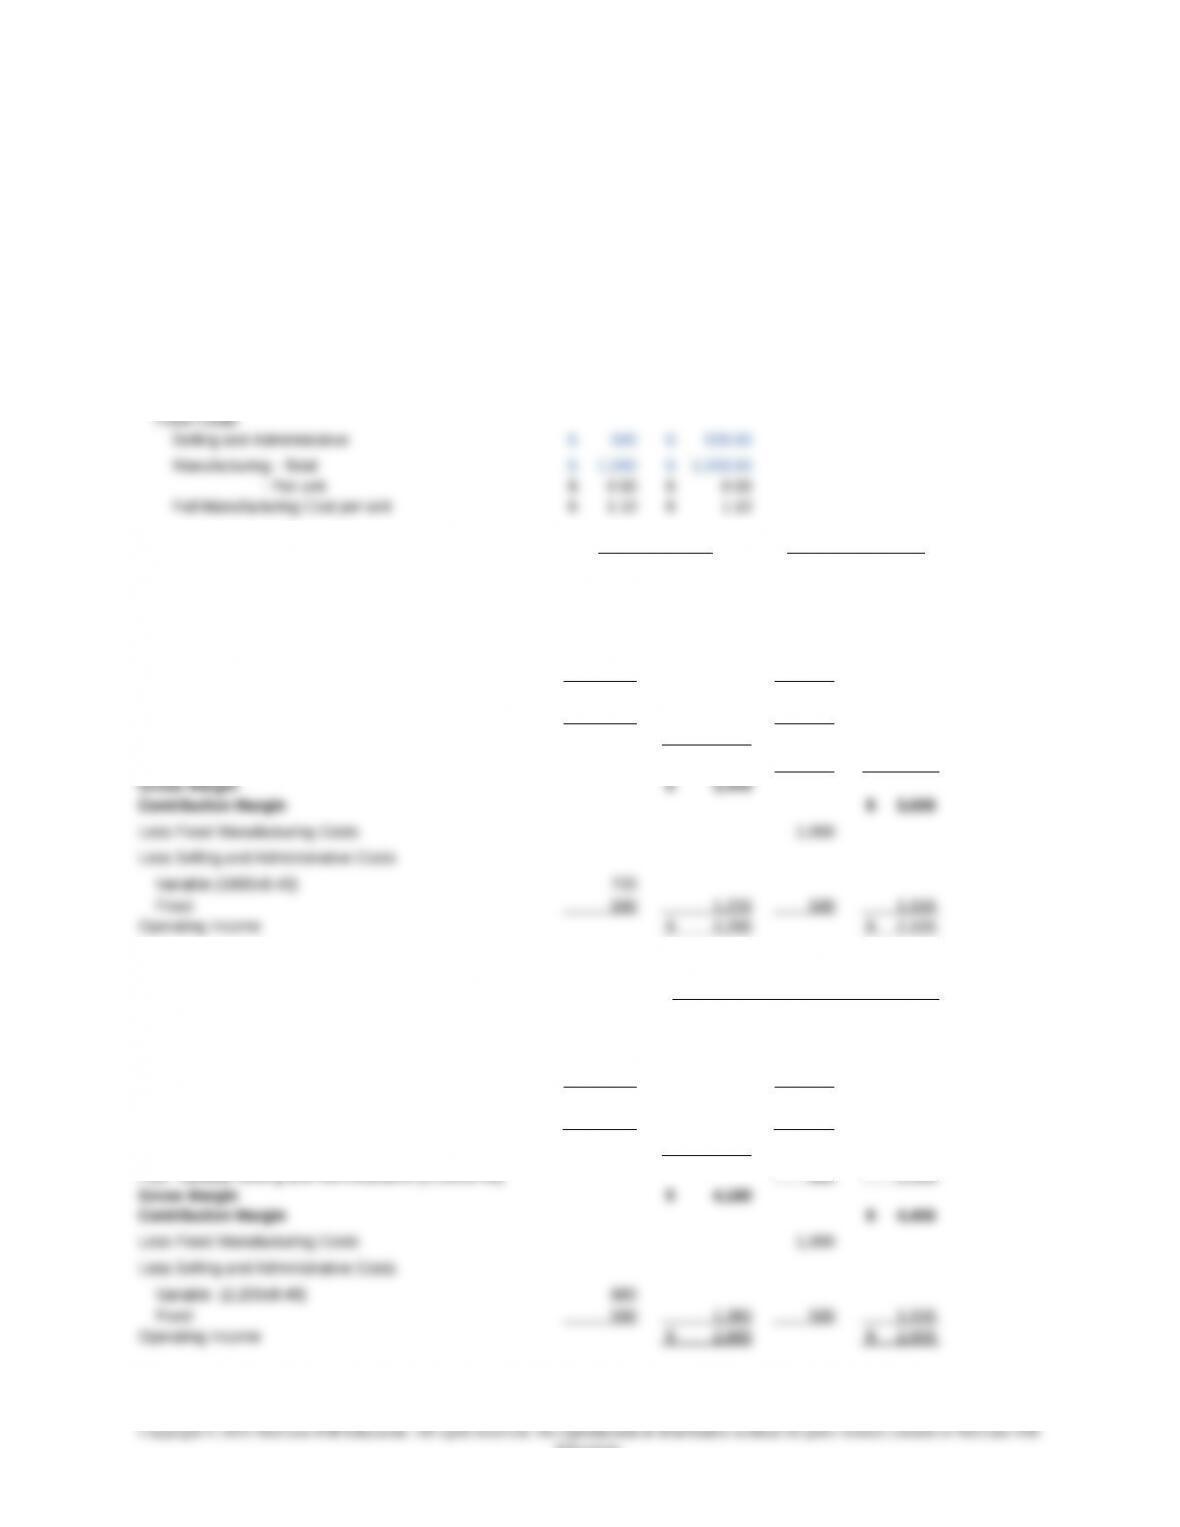
PART TWO Full Costing Variable Costing
Income Statement for Prior Year
Sales (1,800 x $3) $ 5,400 $ 5,400
Less: Cost of Goods Sold
Beginning Inventory – –
Cost of Goods Produced (2,000 x $1.10; 2,000x$.6) $ 2,200 $ 1,200
Available for Sale 2,200 1,200
Less Ending Inventory (200x $1.10;200x$.6) 220 120
Cost of Goods Sold 1,980 1,080
Plus Variable Selling (1,800x$.40) 720 1,800
Income Statement for Current Year
Sales (2,200 x $3) $ 6,600 $ 6,600
Less: Cost of Goods Sold
Beginning Inventory $ 220 $ 120
Cost of Goods Produced (2,000 x $1.10; 2,000x$.6) 2,200 1,200
Available for Sale 2,420 1,320
Less Ending Inventory – –
Cost of Goods Sold 2,420 1,320
Plus Variable Selling and Administrative (2,200x$.40) 880 2,200
18-37
Education.

Chapter 18 – Strategic Performance Measurement: Cost Centers, Profit Centers, and the Balanced Scorecard
18-38
Education.
Chapter 18 – Strategic Performance Measurement: Cost Centers, Profit Centers, and the Balanced Scorecard
18-44 (continued -1)
PART THREE
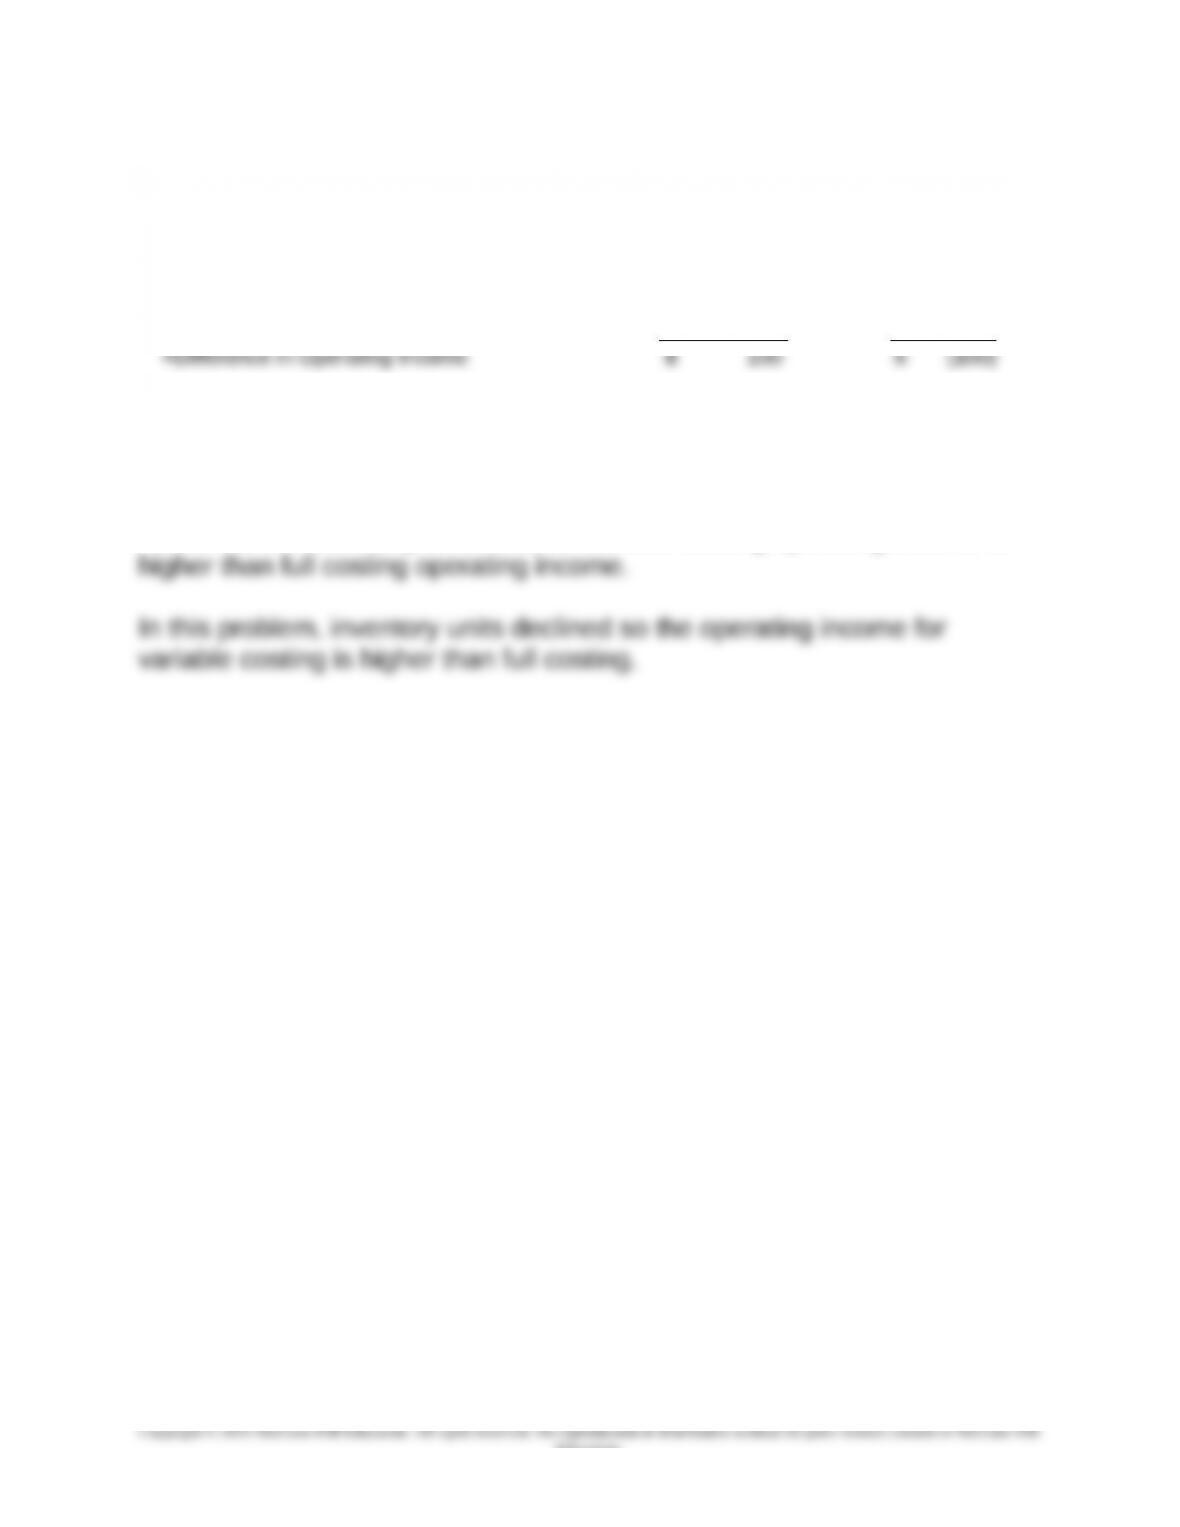
Reconciling Difference in Operating Income between Full
and Variable Costing
Prior Year Current Year
Change in Inventory in Units 200 (200)
Multiply times Fixed Overhead Rate $ 0.50 $ 0.50
An increase in inventory units means full costing operating income is higher
than variable costing operating income.
A decrease in inventory units means variable costing operating income is
18-39
Education.
Chapter 18 – Strategic Performance Measurement: Cost Centers, Profit Centers, and the Balanced Scorecard
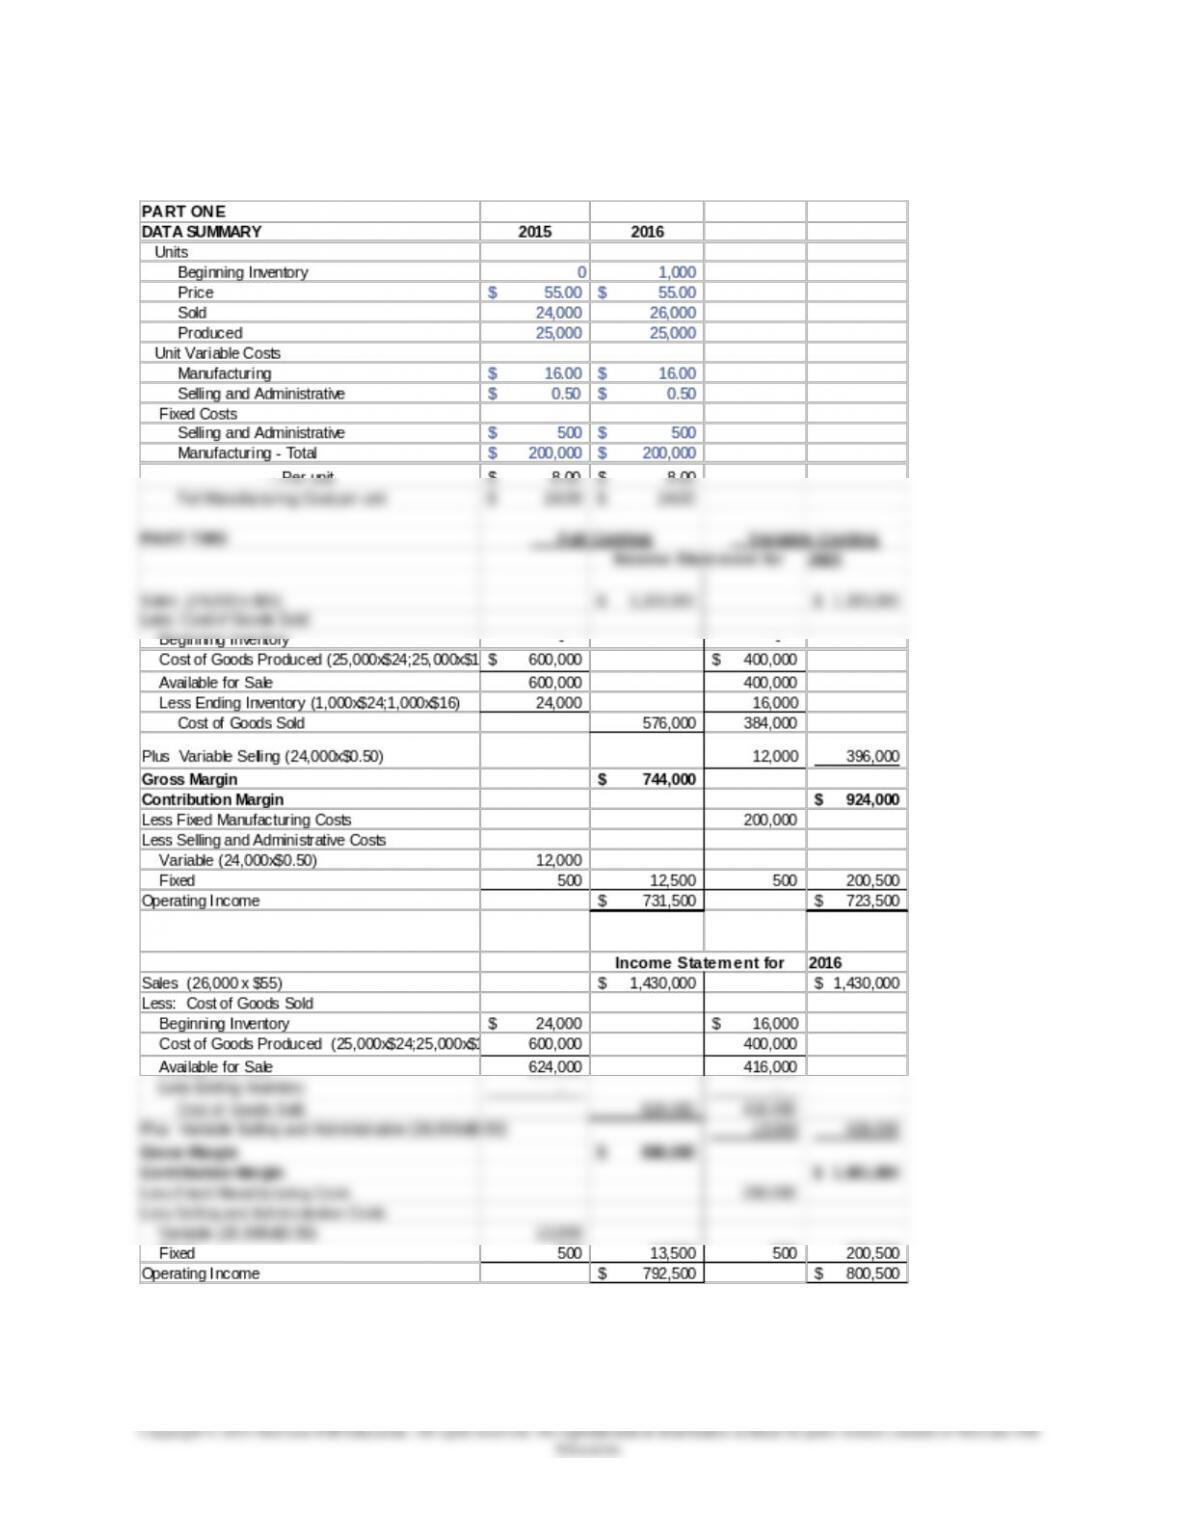
18-45 Full versus Variable Costing (25 min)
1.
18-40