
Chapter 18 – Strategic Performance Measurement: Cost Centers, Profit Centers, and the Balanced Scorecard
Chapter 18
Strategic Performance Measurement: Cost Centers, Profit Centers,
and the Balanced Scorecard
Learning Objectives
1. Identify the objectives of management control.
2. Identify the types of management control systems.
3. Explain the objectives and applications of strategic performance measurement for cost centers,
revenue centers, and profit centers.
4. Explain the role of variable costing and full costing in evaluating profit centers.
5. Explain the role of the balance scorecard in strategic performance measurement.
New in this Edition
Three new Real World Focus (RWF) items that touch upon profit centers, separate business units,
and the use of the balanced scorecard to evaluate strategy
Eight new or revised exercises or problems with a focus strategic business units, absorption
costing, and the contribution income statement
Teaching Suggestions
This chapter introduces management control. The emphasis is on strategic business units (SBUs) and
how managers of these units are motivated, evaluated, and rewarded to contribute most effectively to the
success of the firm. We look at two types of strategic business units in this chapter – one evaluated on cost
only and the other based on profit in the SBU. Unique aspects of this chapter include the use of the
balanced scorecard, the role of outsourcing for cost centers, the development of the principal agent model,
the explanation of the role of the sales life cycle in management control, and a special section on
determining which type of SBU a firm should use, based on its competitive strategy.
A major theme to begin with in this chapter is that the three objectives of management control are to
(1) motivate managers to exert a high level of effort to achieve the goals of top management, (2) provide
the right incentive for managers to make decisions that are consistent with the goals of top management,
and (3) fairly determine the rewards managers earn for their effort and skill and for the effectiveness of
their decision making. The objectives are often in conflict in a given case situation, and the goal is to
make sure the students understand that. We use these objectives consistently throughout this chapter and
Chapters 19 and 20 as well. That is, these also become the key objectives for investment centers and
transfer pricing (Chapter 19) and for management compensation and the evaluation of the firm (Chapter
20). When you begin a case or exercise in class for Chapters 18, 19, or 20, you may consider asking the
students to keep these three objectives in mind and to frame their answers around these objectives. In
some exercises or cases the motivation objective will be critical, and in others the fairness objectives will
be most important, and so on. You can also have the students think about what they are trying to
accomplish in a solution in terms of one or more of these objectives.
You can cover this chapter in two or three class meetings, depending on your objectives for the class.
On the first class day consider giving an introduction to management control and then cover cost Centers.
On the second day you might cover profit centers. The focus in the coverage is twofold: (1) to have the
students begin to understand when one type of SBU is preferred to another, and (2) to have the students
18-1
Education.

Chapter 18 – Strategic Performance Measurement: Cost Centers, Profit Centers, and the Balanced Scorecard
understand the role of cost allocation in both cost and profit centers, so try to get these points across while
discussing cases. In-class coverage of this chapter is likely to be heavily focused on case discussion, so
consider beginning with shorter cases in the exercises and problems at the end of the chapter and follow
that with the longer cases, sometimes from the case book supplement.
The two key topics in the coverage of cost centers are cost allocation and outsourcing.
Cost allocation is important because it is pervasive and has an important effect on cost centers’ total
costs. Examples in the text and problem material show how to handle a variety of situations. Outsourcing
is also an increasingly common issue for cost centersshould these activities simply be outsourced? This
topic is a recap of the coverage on outsourcing presented earlier in the textin Chapter 2 within the
context of the value chain, and in Chapter 7 within the context of departmental cost allocation.
The two key topics in profit centers are the contribution income statement and absorption versus
variable costing. The contribution income statement is developed in detail, to include fixed costs
distinguished as short and long term as well as controllable and noncontrollable. The contribution income
statement is a simple extension of the one developed in Chapter 11. Absorption and variable costing are
covered here because they represent an important way in which profit Centers can differ for reported
income, due only to differences in accounting treatment. The key issues are comparability among Centers
and the potential bias in absorption income due to changes in inventory levels. Lean accounting and
value stream analysis are also covered in this chapter.
18-2
Education.

Chapter 18 – Strategic Performance Measurement: Cost Centers, Profit Centers, and the Balanced Scorecard
Assignment Matrix
End-of-Chapter Exercises & Problems Learning Objectives Text Features
7e
6e
Transition
X = included on Connect
Time
1.
Objectives of management control
2.
Types of control systems
3.
Cost centers, revenue
enters, and profit centers
4.
Variable and full costing
5.
The Balanced Scorecard
Strategy
Service
International
Ethics
Sustainability
Brief Exercises
18-14 18-14 – 05 min X
18-15 18-15 – 05 min X
18-16 Moved to 18-19
18-17 Moved to 18-20
18-18 Moved to 18-24
18-16 18-19 Moved 05 min X
18-17 New X 05 min X
18-18 New X 05 min X
18-19 18-16 Moved X 10 min X
18-20 18-17 Moved X 10 min X
18-20 Moved to 18-23
18-21 18-21 X 10 min X
18-22 18-22 X 10 min X
18-23 18-20 Moved X 10 min X
18-24 18-18 Moved – 05 min X
Exercises
18-25 18-23 Moved to 18-25 X 20 min. X X
18-26 18-24 Moved to 18-26 – 20 min. X X
18-27 18-25 Moved to 18-27 – 20 min. X
18-28 18-26 Moved to 18-28 – 20 min. X
18-29 18-27 Moved to 18-29 X 20 min. X
18-30 18-28 Moved to 18-30 X 20 min. X X
18-31 18-29 Moved to 18-31 X 20 min. X X X
18-32 18-30 Moved to 18-32 – 15 min. X X
18-33 18-31 Moved to 18-33 – 10 min. X
18-34 18-32 Moved to 18-34 – 15 min. X X X
18-35 18-33 Moved to 18-35 – 15 min. X X
18-36 18-34 Moved to 18-36 X 15 min. X
18-37 18-35 Moved to 18-37 – 15 min. X X
18-38 18-36 Moved to 18-38 – 20 min. X X
18-39 18-37 Moved to 18-39 – 20 min. X X
18-40 18-38 Moved to 18-40 – 20 min. X X X X
18-41 18-39 Moved to 18-41 X 30 min. X X
18-42 New X X
18-43 New X X
18-44 18-40 Moved to 18-44 X 20 min. X X
18-45 18-41 Moved to 18-45 X 25 min. X X
18-46 18-42 Moved to 18-46 X 30 min. X X
18-47 18-43 Moved to 18-47 – 15 min. X
Continued on next page …
18-3
Education.

Chapter 18 – Strategic Performance Measurement: Cost Centers, Profit Centers, and the Balanced Scorecard
Assignment Matrix continued
End-of-Chapter Exercises & Problems Learning Objectives Text Features
7e
6e
Transition
X = included on Connect
Time
1.
Objectives of management control
2.
Types of control systems
3.
Cost centers, revenue
enters, and profit centers
4.
Variable and full costing
5.
The Balanced Scorecard
Strategy
Service
International
Ethics
Sustainability
18-48 18-44 Moved to 18-48 – 15 min. X
18-49 18-45 Moved to 18-49 – 15 min. X
Problems –
18-50 18-46 Moved to 18-50 – 25 min. X X
18-51 18-47 Revised and
Moved to 18-51
– 25 min. X X
18-48 Removed – 20 min. X X
18-52 18-49 Revised and
Moved to 18-52
– 35 min. X X
18-53 18-50 Moved to 18-53 – 60 min. X X X
18-54 18-51 Moved to 18-54 – 30 min. X X X
18-55 18-52 Moved to 18-55 – 40 min. X X X
18-53 Removed – 20 min. X
18-56 18-54 Moved to 18-56 – 20 min. X X
18-55 Removed – 20 min. X
18-57 18-56 Moved to 18-57 – 30 min. X X
18-58 18-57 Moved to 18-58 – 20 min. X X
18-58 Removed – 30 min. X X X
18-59 18-59 – 20 min. X X X X
18-60 18-60 Revised – 30 min. X
18-61 18-61 – 25 min. X X X
18-62 18-62 Revised – 40 min. X
18-63 18-63 – 20 min. X X
18-64 18-64 – 45 min. X X X
Lecture Notes
A. Performance Evaluation and Control.
Performance evaluation is the process by which managers at all levels gain information about the
performance of tasks within the firm and judge that performance against pre-established criteria as set out
in budgets, plans and goals. Performance evaluation is applied for each of the three management
functions: operations, marketing, and finance. Performance is also evaluated at many different levels in
the firm: top management, mid-management, and the operating level employees. Management control
refers to the evaluation by upper level managers of the performance of mid-level managers. Operational
control means the evaluation of operating level employees by mid-level managers.
1. Operational Control versus Management Control. In contrast to operational control, which focuses
on detailed short-term performance measures, management control focuses on higher-level managers and
long-term, strategic issues. Operational control has a management-by-exception approach (hunt, find,
18-4

Chapter 18 – Strategic Performance Measurement: Cost Centers, Profit Centers, and the Balanced Scorecard
and correct problems), while management control follows a management-by-objective (MBO) approach,
where long-term goals are determined and performance is periodically measured against these goals.
Management control also has broader, more strategic objectives: to evaluate the unit’s overall profitability
as well as the performance of its manager, to decide if the unit should remain open, and to motivate the
manager to achieve top management’s goals.
2. Objectives of Management Control. The areas of responsibility determined by an MBO style of
management are called strategic business units (SBUs). A SBU is a well-defined set of controllable
operating activities over which the SBU is responsible. Generally, managers have autonomy for making
decisions and managing the SBUs human and physical resources. The objectives of management control
are:
To motivate managers to exert a high level of effort to achieve goals set by top management;
To provide the right amount of incentive for managers to make decisions consistent with the goals
set by top management; and
To determine fairly the rewards earned by managers for their efforts and skill and the
effectiveness of their decision-making.
A common method for achieving these multiple objectives is to develop an employment contract that
covers each of these points.
3. Employment Contracts. Two important aspects of management performance that affect the
contracting relationship are:
a. Uncertainty. Because managers operate in environments where they can’t control everything,
there is some degree of uncertainty about the effectiveness of the manager’s actions, independent of
the efforts and abilities they bring to the job.
b. Lack of observability. Often, the efforts and decisions of a manager are not observable by top
management. Because of this, top management is able to observe only concrete outcomes, not the
efforts that led to them.
Therefore, employee contracts must anticipate uncertainty and lack of observability. Here are three
principles of employment contracts that address these issues:
The contract should separate the outcome of the manager’s actions from the effort and decision-
making skills employed by the managers; basically, separate the performance of the manager
from that of the operating unit.
The contract must include only factors the manager can control.
A risk-averse manager is improperly biased to avoid decisions with uncertain outcomes; however,
top management’s risk tolerance is usually greater. Therefore, the employee contract should
recognize and address a manager’s risk-aversion.
B. Design of Management Control Systems for Evaluation. The design of the control system should
consider three critical questions of strategic performance evaluation.
Who is interested in evaluating the organization’s performance: creditors, the community, the
employees, and the firm’s owners, directors, and shareholders.
What is being evaluated: either the individual manager’s performance or the SBU’s
performance.
18-5
Education.

Chapter 18 – Strategic Performance Measurement: Cost Centers, Profit Centers, and the Balanced Scorecard
When is the performance evaluation conducted: if the outputs of a manager’s decisions are
unclear, then a manager’s evaluation is ex ante, before the decision has been made. Conversely,
the evaluation could be ex post, based on actual outputs. Also, the timing of the evaluations
should be aligned with the different stages of the product life cycle, since management priorities
and performance measures tend to change.
1. Informal Control Systems. Informal control systems reflect the managers’ and employees’
reactions and feelings that result from the positive and negative aspects of the work environment.
Informal systems can be used on both the individual and group level. At the individual level, employee’s
performance is influenced by individual drives and aspirations, separate from any management
incentives. At a broader level, informal systems can occur at the team level, through shared team or
organizational level norms.
2. Formal Control Systems. Formal systems are developed with explicit management guidance.
Three important formal control systems at the individual level are hiring practices, promotion policies,
and strategic performance systems. In each system, management sets expectations for desired employee
performance. An increased emphasis on teamwork is an example of a control system at the team level.
C. Strategic Performance Measurement. Strategic performance measurement is a system used by top
management to evaluate CENTER managers based on their delegated responsibilities.
1. Decentralization. Decentralization occurs when top management delegates a large number of
responsibilities to SBU managers (the opposite of this is centralization). The benefits of centralization are
that top management retains control over key business functions and that upper managers’ expertise is
being properly used. However, decentralization also has its benefits, such when top management lacks
the local knowledge to make quick, sound decisions. Furthermore, decentralization motivates middle
managers with the opportunity to demonstrate their skills and to achieve results. However, a possible
downside of decentralization is it that can lead to reduced cooperation and coordination within the
company.
2. Types of SBUs.
a. Cost Centers. Cost centers are a firm’s production or support centers that provide the best quality
product or service at the lowest cost. Cost centers work well with products that require little
coordination between the selling and manufacturing functions
b. Revenue Centers. When the focus is the selling function, the centers are called revenue centers
and are defined by either product line or geographical area.
c. Profit Centers. When an SBU both generates profit and incurs a major portion of the cost for
producing these revenues, it is a profit center. The use of a profit center is an improvement over cost
and revenue centers since a profit center aligns the manager’s goals more directly with top
management’s goal to make the firm profitable. A profit center is preferred when products demand a
great deal of interaction and coordination between the selling and manufacturing functions.
d. Investment Center. An investment center includes assets employed by the center as well as profits
in performance evaluation.
While all of the types of centers focus on critical financial measures of performance, they can be
combined with the balanced scorecard to provide a more complete means of performance evaluation.
18-6
Education.

Chapter 18 – Strategic Performance Measurement: Cost Centers, Profit Centers, and the Balanced Scorecard
D. Cost Centers. Cost centers include direct manufacturing departments and manufacturing support
departments, because these departments have significant direct control over costs.
1. Strategic Issues Related to Implementing Cost Centers.
a. Cost Shifting. Cost shifting occurs when a department replaces its controllable costs with
noncontrollable costs. The reason for this is that the manager generally is not held responsible for
increases in noncontrollable costs. This could lead to lower controllable costs for the department
manager, yet higher total costs for the firm. Not-for-profit organizations must also beware of this
practice, since many organizations do distinguish between direct and indirect costs.
b. Excessive short-term focus. Since many performance measurement systems focus heavily on
annual cost figures, there is a tendency for cost centers to attend only to short-term goals and ignore
long-term strategic issues. A possible solution to this problem is to use a balanced scorecard
approach that includes nonfinancial data as well.
c. Budget slack. Budget slack is the difference between budgeted performance and expected
performance. While its common for most managers to include a small amount of slack in their
performance budgets, it is also possible that managers may include an unreasonably large amount of
slack, in order to make their goals easier.
2. Implementing Cost Centers in Departments.
The two methods for implementing cost centers for production and support departments are the
discretionary-cost method and the engineered-cost method:
a. Discretionary-cost method. This method considers costs largely uncontrollable and applies
discretion at the planning stage; it is an input-oriented approach often applied at the facility level
where operations are ill defined.
b. Engineered-cost method. This method considers costs to variable and therefore engineered, or
controllable; it is an output-oriented approach often applied at the unit, batch, or product levels where
operations are well defined.
c. General and administrative departments. Administrative support departments can be classified as
either discretionary-cost or engineered-cost, depending on the department’s cost behavior and
management’s philosophy and objectives.
d. Outsourcing cost Centers. Many firms have found that the use of an outside source is an effective
way to obtain reliable service at a reasonable cost. However, the cost of outsourcing is that the firm
losses control over a potentially strategic resource and must rely on the outside firm’s performance.
e. Dual allocation. Dual allocation is a cost allocation method that separates fixed and variable costs.
Variable costs are directly traced to user departments, and fixed costs are allocated on some logical
basis.
E. Revenue Centers. Management often uses revenue drivers when evaluating revenue centers.
Revenue drivers are the factors that affect sales volume (such as price changes, discounts, delivery dates,
etc.). Oftentimes, the marketing department is viewed as a revenue center; the following are two
categories of marketing costs used in performance evaluation:
a. Order-getting costs. Order-getting costs are expenditures to advertise and promote the product.
18-7
Education.

Chapter 18 – Strategic Performance Measurement: Cost Centers, Profit Centers, and the Balanced Scorecard
b. Order-filling costs. These costs include freight, warehousing, packing and shipping, and
collections.
F. Profit Centers. The profit center manager’s goal is to earn profits. A key advantage of the profit
center is that it brings the manager’s incentives into congruence with those of top management.
1. Strategic Role of Profit Centers. Three strategic issues cause firms to choose profit centers rather
than cost or revenue centers:
Profit centers provide the incentive for desired coordination among the different business
functions.
Firms use profit centers to motivate managers to consider their product as marketable to
outside customers.
Choosing profit centers motivates managers to develop new ways to make a profit from their
products and services. Managers have the incentive to create new products and services because
the profit center evaluation rewards the incremental profits.
2. The Contribution Income Statement. A common form of profit center evaluation is the contribution
income statement, which is based on the contribution margin developed for each profit center and for the
relevant group of profit centers. The level of detail at which the contribution income statement is
developed varies depending on the management’s needs. The contribution income statement can also be
used to determine whether an center should be dropped or retained.
a. The contribution by profit center (CPC). CPC measures all costs traceable to, and therefore
controllable by, the individual profit centers. CPC is a more complete and fair measure of
performance than either the contribution margin or profit.
b. Controllable fixed costs. Controllable fixed costs are those fixed costs that the profit center
manager can influence in approximately a year or less. Managers typically budget these costs in the
annual budget.
c. Noncontrollable fixed costs. Noncontrollable fixed costs are those that are not controllable within
a year’s time.
d. Controllable margin. The controllable margin is determined by subtracting short-term controllable
fixed costs from the contribution margin. This is used to measure the profit center manager’s short-
term performance. When measuring both short and long-term performance, CPC is more
appropriate.
G. Variable Costing versus Absorption Costing. The use of the contribution income statement often is
called variable costing because it separates variable and fixed costs. In contrast, absorption costing is the
conventional costing system because it is required by financial reporting standards and the IRS. The
advantage of variable costing is that it meets the three objectives of management control systems by
showing separately those costs that can be traced to, and controlled by, each SBU. Another advantage to
variable costing is that, under variable costing, net income is unaffected by changes in inventory.
H. Strategic Performance Measurement and the Balanced Scorecard. While cost, revenue, and
profit centers are all used to evaluate management performance, all three use little to no nonfinancial data.
The balanced scorecard can be used in this case to help provide nonfinancial measures of success
necessary for a total evaluation. However, a difficulty in using the balanced scorecard is that it is difficult
18-8
Education.

Chapter 18 – Strategic Performance Measurement: Cost Centers, Profit Centers, and the Balanced Scorecard
to use to balanced scorecards in measuring performance across SBUs. Each SBU has its own scorecard;
thus, the scorecard evaluation is more likely based on progress relative to the prior year or to a budget
than the more common, compare-across-all-managers approach. Furthermore, there are several issues
relating to the reliability and timeliness of nonfinancial data that deter some companies from using it.
A Strategy Map. A strategy map uses the balanced scorecard to describe the firm’s strategy in
detail by using cause-and-effect diagrams. The strategy map is a detailed view of how the firm achieves
its strategic goals, showing the interaction between the scorecard’s perspectives. The strategy map also
reinforces the idea that financial performance and shareholder value are the ultimate goals for most
applications of the balanced scorecard. Also, the strategy map emphasizes the important point that, by
describing the firm’s strategy in some detail, the balanced scorecard can also be used as a means for
developing strategy and evaluating progress to achieve strategy.
I. Management Control in Service Firms and Not-for-Profit Organizations. Management control in
service and not-for-profit organizations is commonly implemented in the form of a cost or profit center.
These organizations choose a cost center when the manager’s critical mission is to control costs; a profit
center is preferred when the department manager must manage both costs and revenues or, alternatively
(in a not-for-profit organization), manage costs without exceeding budgeted revenues. The most common
type of SBU in service firms and not-for–profit organizations is the cost center.
Advanced Lecture Notes
The supplementary material for Chapter 18 includes two teaching notes, each of which involves
an extension of the area of risk preferences as introduced in the chapter. The notes can be used as
handouts as a basis for class discussion of a more advanced treatment of risk preferences and the role of
information in decision making. The two notes are:
1. Defining and Measuring Risk Preferences
2. The Role of Information and Risk Preferences In Decision Making
Defining And Measuring Risk Preferences
Since the explicit consideration of risk preferences is important in managerial contexts, as
illustrated in this chapter, the management accountant should be able to understand how risk preferences
are employed in decision making, and how they can be measured in practice. This appendix explains how
risk preferences are conventionally developed within the framework of certainty equivalents and gambles.
If we assume that a decision maker’s marginal utility for wealth is positive, that is, more wealth is
better than less, then we can characterize risk-neutral, risk-averse, and risk-prone utility functions in terms
of an individual’s trade-off between the certainty equivalent (linear expected value) of a gamble and the
price the individual will be willing to pay for the gamble.
18-9
Education.
Chapter 18 – Strategic Performance Measurement: Cost Centers, Profit Centers, and the Balanced Scorecard
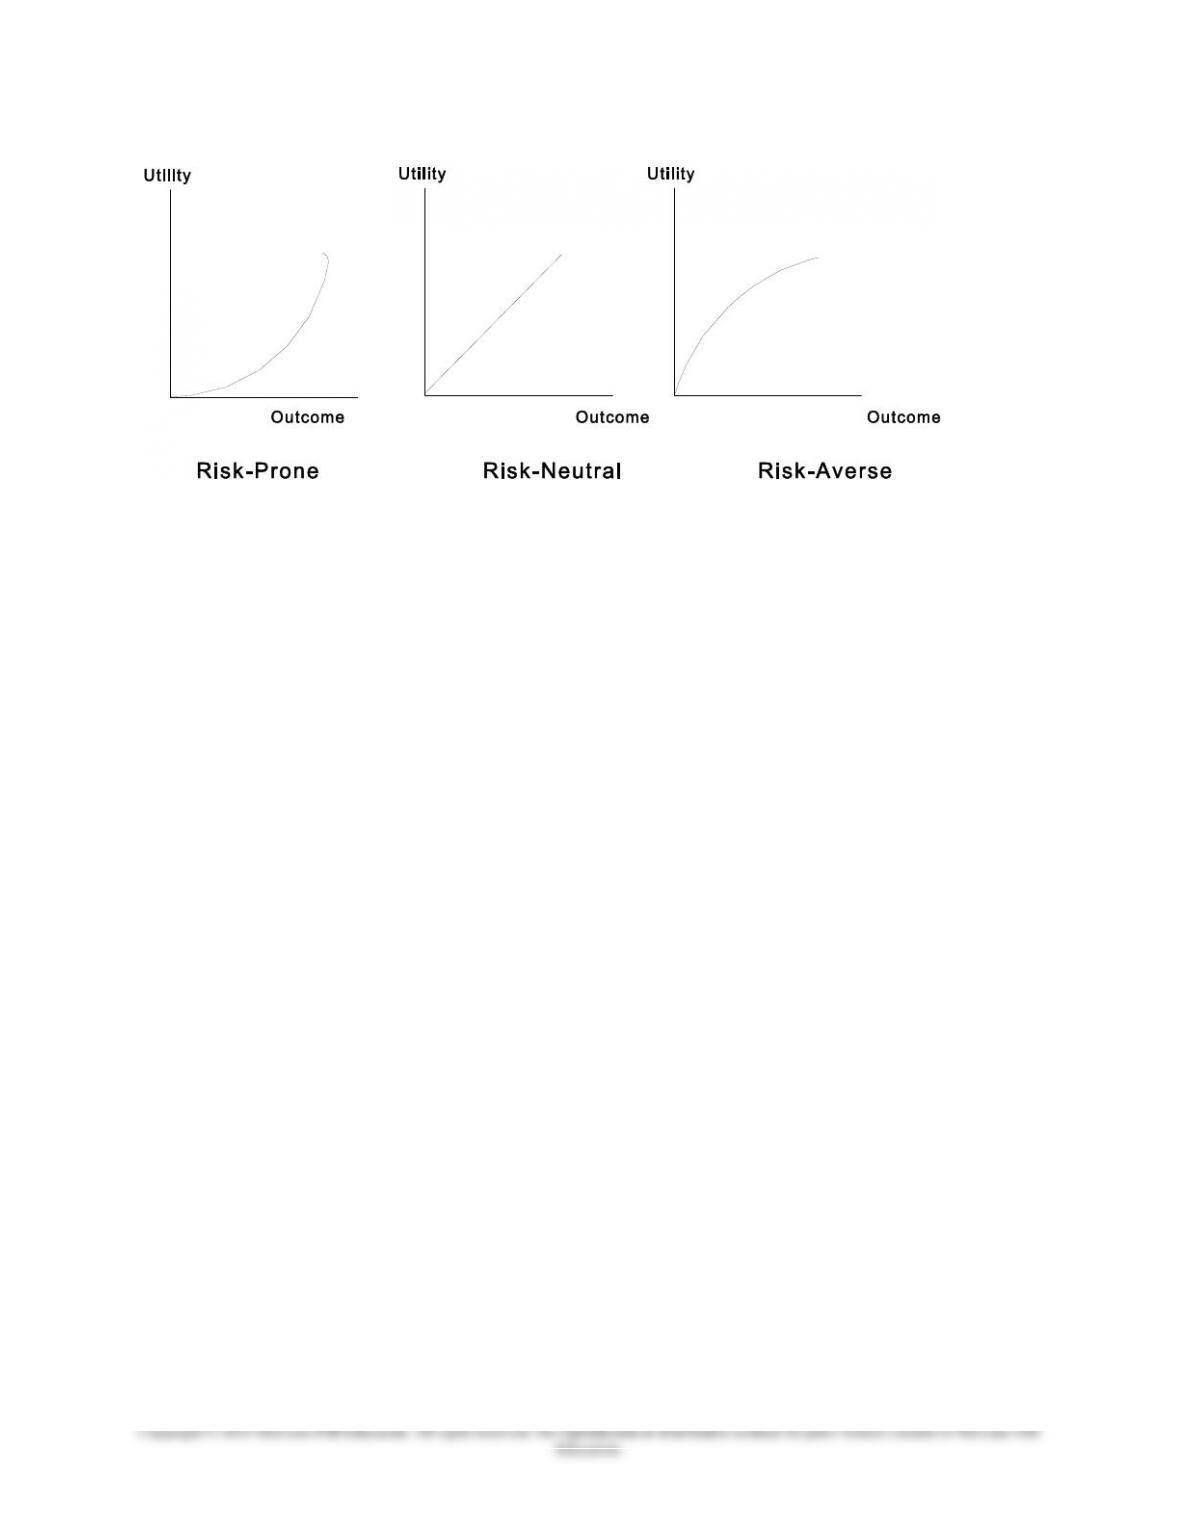
Exhibit 1: Three Utility Curves
In general, if the individual prefers the gamble to the certainty equivalent, an assured amount equal
to the expected monetary value of the gamble, we will call the individual risk-prone. While, if the
individual would prefer the certainty equivalent to the gamble, we will say the individual is risk-averse. If
the individual sees the value of the gamble as equal to its certainty equivalent, then the individual is risk-
neutral, and therefore has a utility that is equivalent to that of linear expected utility in monetary values.
The three utility functions are illustrated in Exhibit 1.
To obtain an individual’s utility curve, and therefore a measure of the person’s risk propensity, we
construct a simple gamble, say, the gamble is a 70% chance of winning $100 and a 30% chance of
$10,000. The expected monetary value of the gamble, and also the certainty equivalent of the gamble is:
.7 x $100 + .3 x $10,000 = $3,070
A risk-neutral decision maker would pay exactly $3,070 for the opportunity for this gamble, and a
risk prone decision maker would be willing to paying something more, perhaps as high as $10,000 for the
opportunity to win $10,000 (even though paying more than $3,070 means the decision maker will be
accepting an expected loss on the gamble). In contrast, the risk-averse decision maker will not be willing
to pay as much as $3,070 because of a greater concern for the certain loss of the $3,070 as opposed to the
uncertainty of a potential gain of $10,000. We will now illustrate how a risk-averse utility function could
be developed in this case; the case for a relatively risk-prone decision maker would be handled in a
similar manner.
A common way for representing the utility of a risk-averse decision maker is to use the square root
of the related monetary value, often multiplied by a scale factor, so that the resulting utility values are in a
meaningful proportion to the monetary values. For the above case we select a scale factor of 1,000. The
relationship of the utility curve to linear utility is shown in Exhibit 2. Observe first of all that the risk-
averse utility curve is irrelevant below the $1,000 level of expected return for the gamble, because of the
scale factor (1,000) used in the square root function.
The expected value of the gamble, $3,070, has a utility to the risk-averse decision maker of 2,247 =,
and a value of $3,070 to the risk-neutral decision maker. To see how utility changes as the odds for the
gamble change, assume that the payoff of $10,000 now has a probability of 50%. The new expected value
of the gamble is $5,050 to the risk neutral decision maker, and a utility of 1,752 = to the risk-averse
decision maker.
18-10