Chapter 17 – The Management and Control of Quality
17-74 (Continued-2)
3. The report indicates that prevention, appraisal, and internal failure costs have
increased from 2016 to 2017. The external failure cost category decreased by
2017.
Lee Enterprises benefits from decreases in its external failure costs. Three external
failure costs (product recalls, warranty repairs, and warranty replacements) have
decreased by approximately 70 percent from what these costs were the year before.
4. One of the most effective ways for production workers to be conscientious in their
work is to hold them responsible for mistakes. Holding employees responsible for
their work can include a policy for workers to do rework on their own time and to pay
Note: Two linked Excel spreadsheet solution files for this Problem are embedded
below. You can open each spreadsheet “object” by doing the following:
1. Right click anywhere in the worksheet area.
2. Select “worksheet object” and then select “Open.”
3. To return to the Word document, select “File” and then “Close and return to...”
while you are in the spreadsheet mode. The screen should return you to this
Word document.
17-82
Education.
Pr. 17-74(b) 7e.xlsx
Pr. 17-74(a) 7e.xlsx
Chapter 17 – The Management and Control of Quality
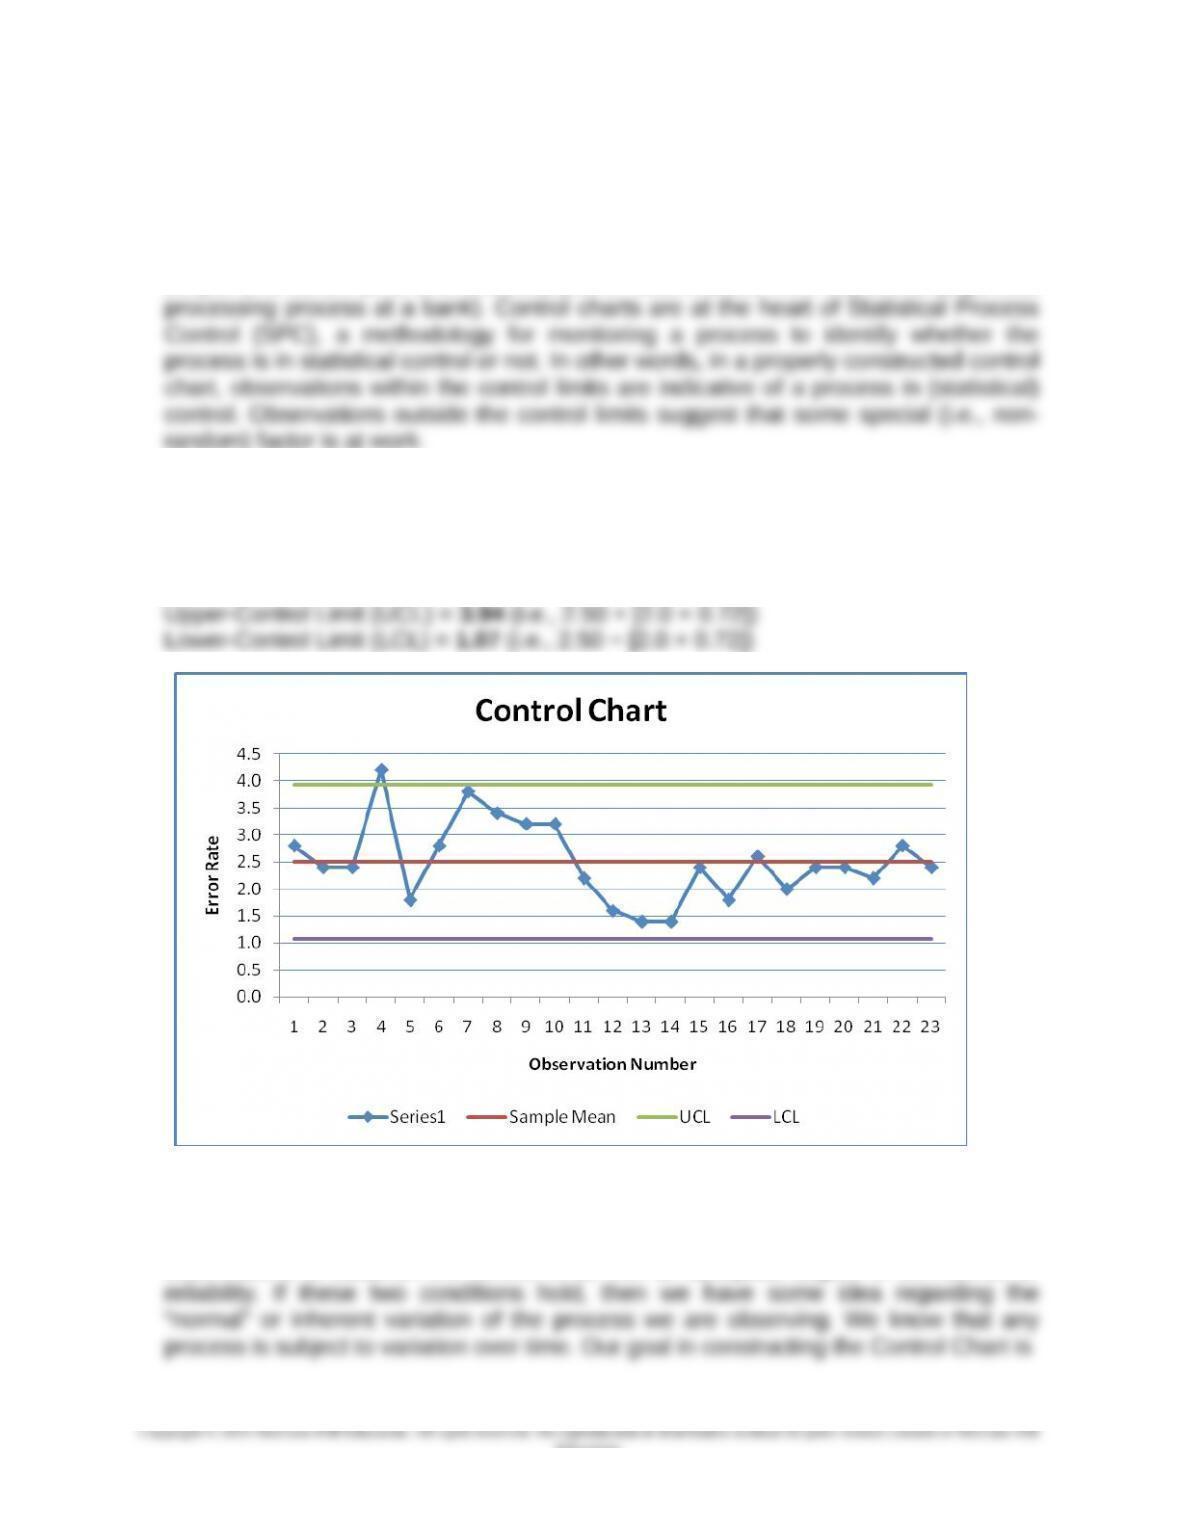
17-75 Constructing and Interpreting a Control Chart (50 Minutes)
1. A “control chart” might best be thought of as a time-series run chart with statistically
determined upper and lower control limits, around a target value (usually defined as
the mean value of the characteristic under examination). By contrast, a run chart is a
simple time-series (i.e., time-ordered) plot of observations from a process (e.g., loan
2. Construction of Control Chart:
Sample mean of process = 2.50
Sample standard deviation = 0.72
No. of standard deviations = 2
3. Interpretation of control limits: we assume that the sample observations were
obtained during the time that the underlying process (in this case, processing of loan
applications) is in control, that is, is stable. We also assume that we have sufficient
observations to establish the control limits with an adequate degree of confidence or
17-83
Education.
Chapter 17 – The Management and Control of Quality
17-75 (Continued)
to develop a tool that will provide an indication of when, going forward, the process is
likely in or out of statistical control. Because we are working with some uncertainty,
we realize that we can make one of two errors in interpreting the control chart results:
we might conclude that the process is out of control when in fact (unbeknownst to us)
it is in control; or, we might conclude that everything is fine, when in fact the variation
4. As indicated above in (3), the basic approach to judging process control is statistical
in nature. That is, on the basis of whether or not actual observations fall within the
control limits we draw a conclusion as to whether the process is in control (i.e., the
variations we are observing have random, or non-systematic, causes) or out-of-
control. This approach is sometimes referred to as the “outlier” approach to
interpreting results from a Control Chart.
Another approach would be to look for what appear to be an abnormal number of
runs. The likelihood of a stable process generating, say, eight points in a row on the
same side of the centerline is like tossing a coin and getting “tails” eight times in a
variation.
5. Some plausible quality measures for non-manufacturing companies:
a) Hospitals—lab test accuracy, insurance claim accuracy, on-time delivery of meals
and medications
b) Insurance Company—claims-processing response time, billing accuracy
17-84
Education.
Chapter 17 – The Management and Control of Quality
17-76 Research: Applying Lean Principles to “Knowledge Work” (60 minutes,
including reading time)
1. The term “lean,” as derived from the Toyota Production System, can be taken to
mean “relentless attention to detail, commitment to data-driven experimentation, and
charging employees with the ongoing task of increasing efficiency and eliminating waste
2. The term “knowledge work” is used by the authors of this article to mean any decision
process (or operation) that involves judgment and expertise (so-called “tacit
knowledge”—that is, knowledge “locked inside the worker’s head). Unlike many
manufacturing contexts (in which work processes can more or less be defined
unambiguously and therefore modeled), conventional wisdom holds that “knowledge-
3. Perhaps the most significant assertion is stated at the very end of the article (p. 110):
turning a knowledge operation into a lean system is difficult, but possible; this very
difficulty implies that the system will be hard for competitors to replicate. In other words,
making a knowledge-based operation “lean” can allow the organization to improve
faster than competitors and therefore be a source of competitive advantage for the
organization.
4. The authors believe (based on their experience of over 1,800 projects at Wipro
Technologies) that knowledge work can be made lean if organizations draw on six
principles, summarized as follows:
Continually Root Out/Eliminate Waste
The authors assert that even in knowledge work, there are routine activities that do not
involve judgment or expertise and that are therefore candidates for application of “lean
principles.”
17-85
Education.
Chapter 17 – The Management and Control of Quality
17-76 (Continued-1)
The key, according to the authors, is to (p. 103) “get everyone in the organization to
systematically make waste visible and (then to) do something about it.” To accomplish
this, the authors offer the following specific strategies: teach everyone in the
and how the specification (codification) of tasks resulted in increased
performance (i.e., document the benefits)
(d) Keep studying the work that has been designated as “tacit” (what is currently
an uncommon event may, in the future, occur frequently, i.e., may be
repetitive in nature and therefore capable of being codified)
Structure Communications (i.e., how workers should communicate with one
another)
The workplace today is truly global in nature: work teams may have members from all
over the world. Thus, an effective employee communication plan or structure should be
in place to determine how employee communications should take place.
Three suggestions are offered by the authors in terms of structuring communications:
17-86
Education.
Chapter 17 – The Management and Control of Quality
17-76 (Continued-2)
(c) Resolve disagreements with facts, not opinions
it becomes to find a fix for the problem)
Plan for an Incremental Journey: A Lean System Takes Years to Build
(a) Start small (e.g., use pilot projects, to explore for your organization whether a
lean approach is a viable option)
(b) Codify lessons learned
(c) Keep looking for new ways to work—keep in mind that the ultimate goal is to
fundamentally change how knowledge work is performed
training and motivating their teams. Among other things, these managers
should impress upon their teams the notion that lean efforts will improve
performance.
17-87
Education.

Chapter 17 – The Management and Control of Quality
17-76 (Continued-3)
(b) Senior leaders must be long-term champions—remember: the ultimate goal is
17-88
Education.
Chapter 17 – The Management and Control of Quality
CHECK FIGURES
17-37 No check figure.
17-40 No check figure.
17-41 No check figure.
17-45 No check figure.
17-46 No check figure.
17-48 No check figure.
17-49 1. Total Prevention Costs = $280,000; Total Internal Failure Costs = $600,000;
$137,700.
17-55 No check figure.
17-56 1. Production (manufacturing) lead time: under current process = 480 minutes;
Alternative #1 = 0.48; under Alternative #2 = 0.39
17-59 No check figure.
17-89
Education.
Chapter 17 – The Management and Control of Quality
17-62 No check figure.
17-63 No check figure.
17-65 No check figure.
17-66 3. Estimated annual increase in contribution margin = $950,000; estimated
17-67 No check figure.
17-68 1. Change in pre-tax cash flow per year (after installation of new tracking
Failure Cost to Sales = 1.10%; External Failure Costs to Sales = 1.50%.
17-72 No check figure.
17-73 2. Net promoter score = 2.8% (i.e., 36.2% − 33.4%)
17-76 No check figure.
17-90
Education.