Chapter 17 – The Management and Control of Quality
17-71 (Continued-1)
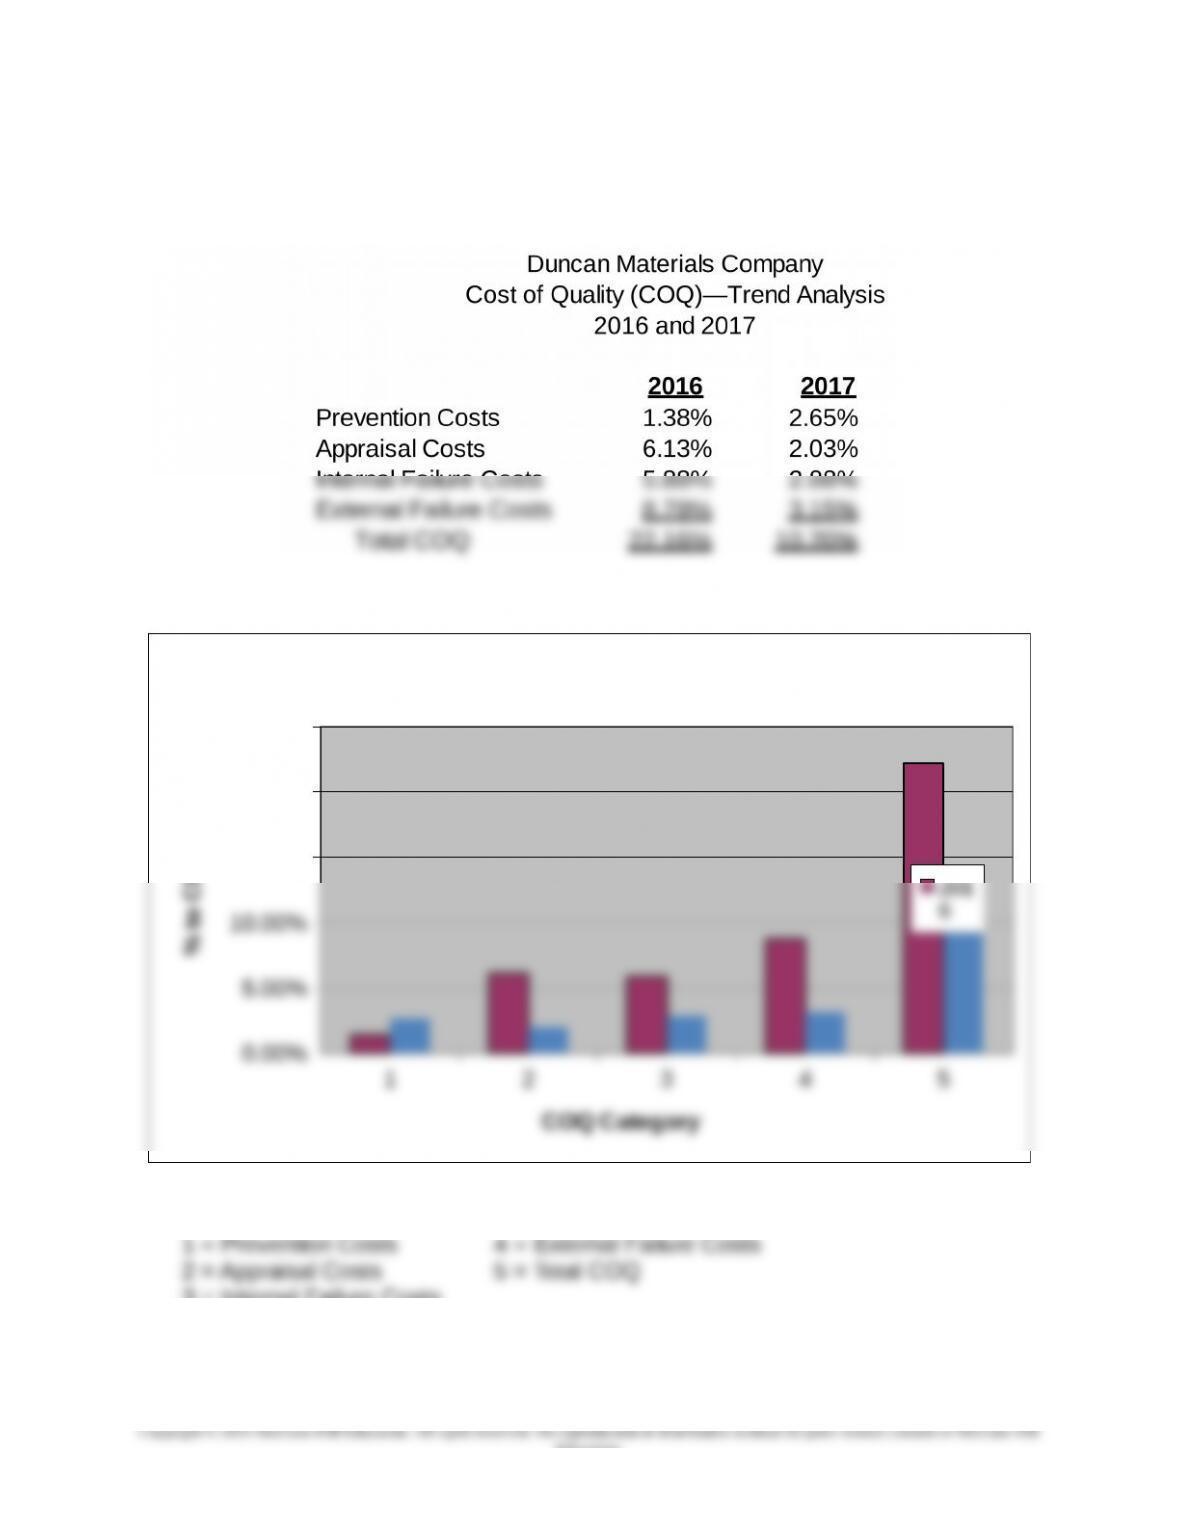
5. Data for Trend Analysis (2016 and 2017 Category Results)
6. Bar Chart: COQ Report, 2016 and 2017
12345
0.00%
5.00%
10.00%
15.00%
20.00%
25.00%
Duncan Materials: COQ Trend Analysis
201
6
COQ Category
% to CGS
COQ Categories:
17-72
Education.
Chapter 17 – The Management and Control of Quality
17-71 (Continued-2)
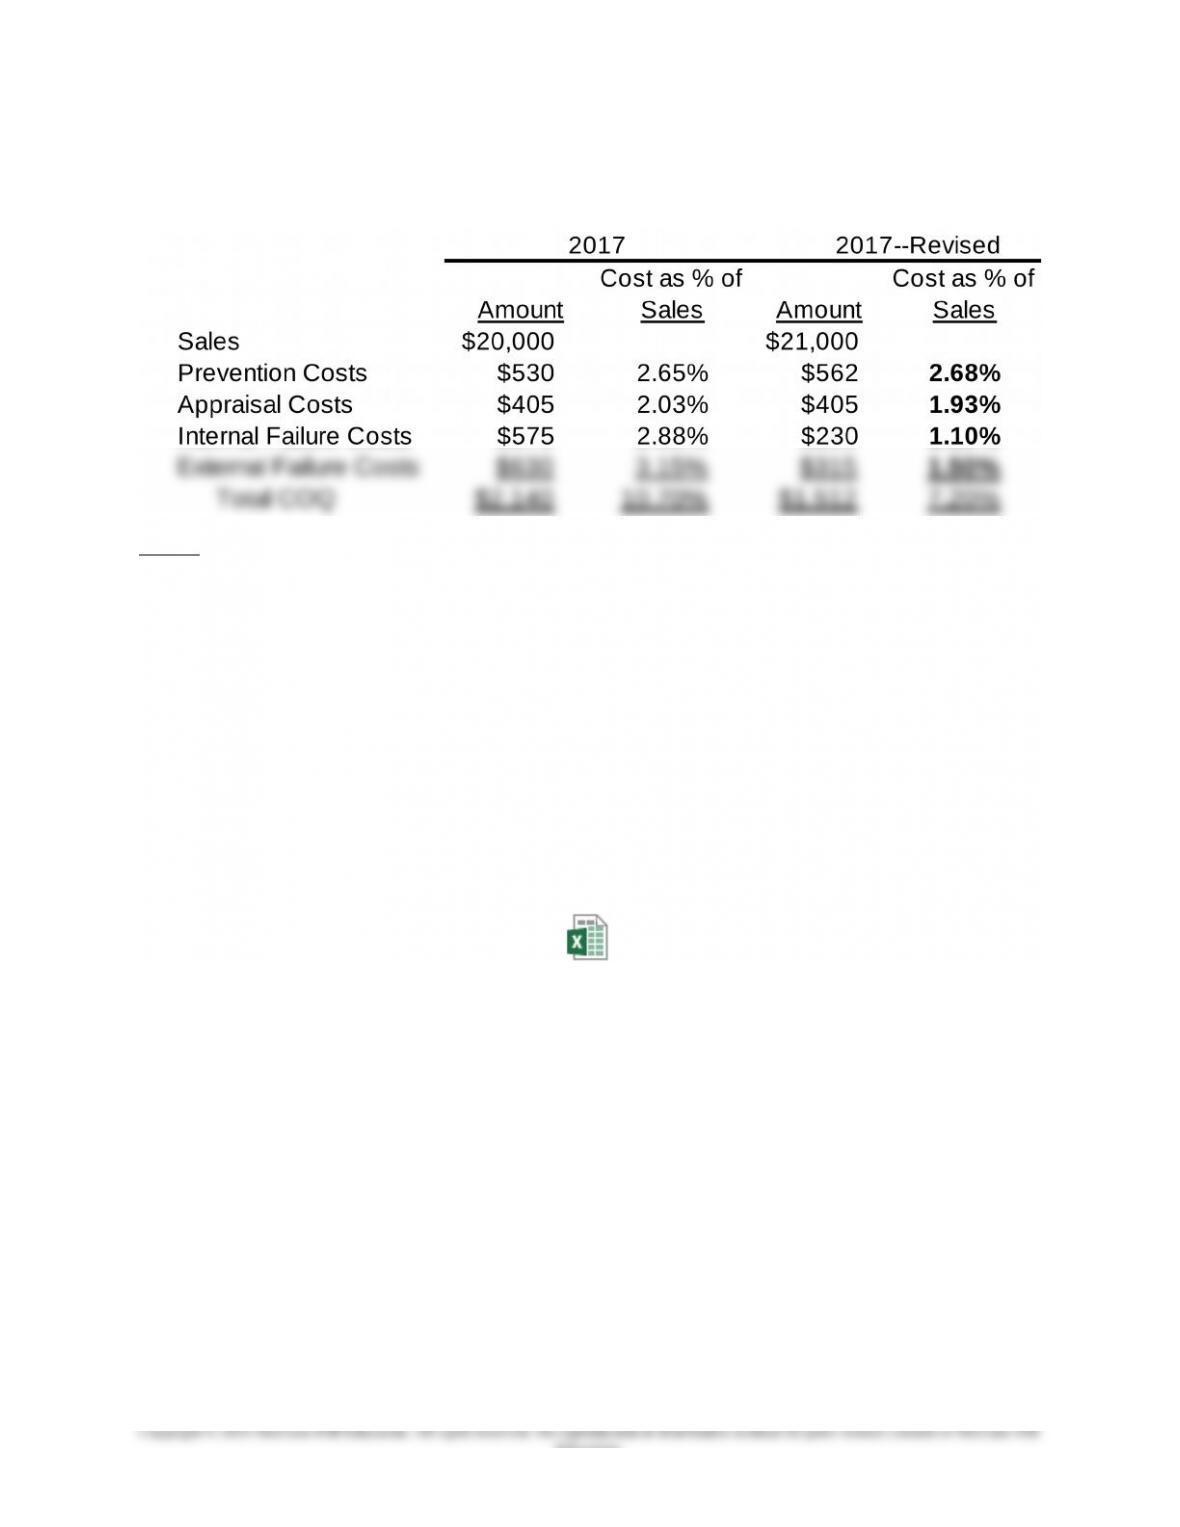
7. Sensitivity Analysis
Notes:
11.05 × $20,000 = $21,000 3(1 − 0.60) × $575 = $230
21.06 × $530 = $562 4(1 − 0.50) × $630 = $315
Note: An Excel spreadsheet solution file for this Problem is embedded in this
document. You can open the spreadsheet “object” that follows by doing the
following:
1. Right click anywhere in the worksheets below.
2. Select “worksheet object” and then select “Open.”
3. To return to the Word document, select “File” and then “Close and return to…”
while you are in the spreadsheet mode. The screen should then return you to
the Word document.
Pr. 17-71 7e.xlsx
17-73
Education.

Chapter 17 – The Management and Control of Quality
17-72 Environmental Performance—Meeting Stakeholder Expectations (60 Minutes)
1. As indicated in the cited HBR piece, the following stakeholders are likely to be
interested in corporate disclosures regarding environmental performance:
customers, employees, capital markets (i.e., investors and potential investors),
government (both federal and state), and not-for-profit organizations (such as
Climate Counts).
2. The environmental performance scorecard created by Climate Counts
(http://www.climatecounts.org/pdf/Climate_Counts_Scorecard.pdf) consists of 22
items, broken down into four areas, as follows:
Review:
(1) GHS emissions inventory completed? (5 points)
(2) Rough calculations or standard protocol/calculator? (3 points)
(3) Are Kyoto gases besides CO2 included? (2 points)
(4) Are indirect emissions accounted for (supply chain, travel, etc.)? (4 points)
(5) Is there external, qualified third-party verification of emissions data,
reductions, and reporting (where applicable)? (4 points)
(6) Is the inventory an ongoing, regular process accounting for multiple years?
(4 points)
Reduce:
(7) Has a clear goal been set? (4 points)
(8) Strength of baseline year used for the reduction goal? (3 points)
(9) Magnitude of reduction goal? (5 points)
(10) Have a measurement plan and organizational structure been established
for climate? (5 points)
(11) Is there top-level support for climate-change action? (2 points)
(12) Has the company taken steps towards achieving reduction target? (Interim
progress on reduction) (8 points)
(13) Has the company achieved emissions reductions? (10 points)
(14) Absolute or intensity-based reductions? (4 points)
(15) Has the company achieved verified reductions to date (prior to current goal
setting)? (5 points)
(16) Has the company made successful efforts to reduce greenhouse gas
(GHG) impacts associated with the use of its products/services? (4 points)
(17) Does the company work to educate its employees, trade associations,
and/or customers on how they can reduce individual GHG emissions
(through direct education programs, incentives, or philanthropic projects?
(4 points)
(18) Does the company require suppliers to take climate change action or give
preference to those that do? (2 points)
17-72 (Continued-1)
17-75

Chapter 17 – The Management and Control of Quality
Policy Stance:
(19) Does the company support public policy that could require mandatory
climate change action by business? (10 points)
(20) Does the company oppose public policy on climate change that could
require mandatory action by business, or has it made efforts to undermine
climate-change action? (-10 points)
Report:
(21) Is the company publicly reporting on emissions, risks, and actions? How is
information disclosed? Company-based (e.g., on their website or annual
report) or through a credible third-party program (e.g., CDP, GRI, etc.)? (10
points)
(22) Are emissions broken out by facility, business unit, country of operations,
or other meaningful sub-segments? (2 points)
3. As seen at http://www.climatecounts.org/scorecard_score.php?co=28 (accessed 25
November, 2011), IBM’s scorecard total for the current year is 82 (an increase of 3
points over last year’s score). It has scored highly in each of the areas, with the
possible exception of Policy Stance (4 out of 10 points). Its current score places it #2
among the 12 firms from the electronics sector. The website lists IBM as “striding,” as
follows:
Apple, on the other hand, scored last among 12 companies in the electronics industry
category (see http://www.climatecounts.org/scorecard_score.php?co=7, accessed 25
January, 2011). Apple’s current score is 60, a one-point change from last year, but
significantly above the score of three years ago (which score is mentioned in the HBR
article). Apple’s component scores are as follows: Review: 19/22 points. Apple has
completed a comprehensive inventory of the impact it has on global warming and that
the company expects to continue its review in the future. Reduce: 26/56 points.
Apple has established clear goals to reduce the company’s greenhouse gas
emissions and has initiated projects that have resulted in reductions. Policy Stance:
7/10 points. Apple has distinguished itself by strongly advocating for comprehensive
public policy that addresses climate change and would lead to market-wide reduction
in greenhouse gas emissions and the growth of renewable energy capacity. Apple
resigned from the US Chamber of Commerce over the trade group’s opposition to
comprehensive climate and energy legislation. Report: 8/12 points. Apple has made
some public information available on its efforts to address global warming.
17-76
Education.
Chapter 17 – The Management and Control of Quality
17-72 (Continued-2)
4. As indicated in the referenced HBR piece (October 2007, pp. 30, 34), companies that
have sub-par performance in the environmental area face potential risks for four
reasons:
a) Reputation risk
5. Role of the management accountant: environmental performance, as evidenced by
the corporate-performance scorecard used by Climate Counts, fundamentally
involves measurement, reporting, and analysis. Presumably, the management
accountant has a competitive advantage in these areas and, therefore, should be
able to add value to the organization by participating in the design of a
17-77
Education.
Chapter 17 – The Management and Control of Quality
17-73 Net Promoter Score (25 minutes)
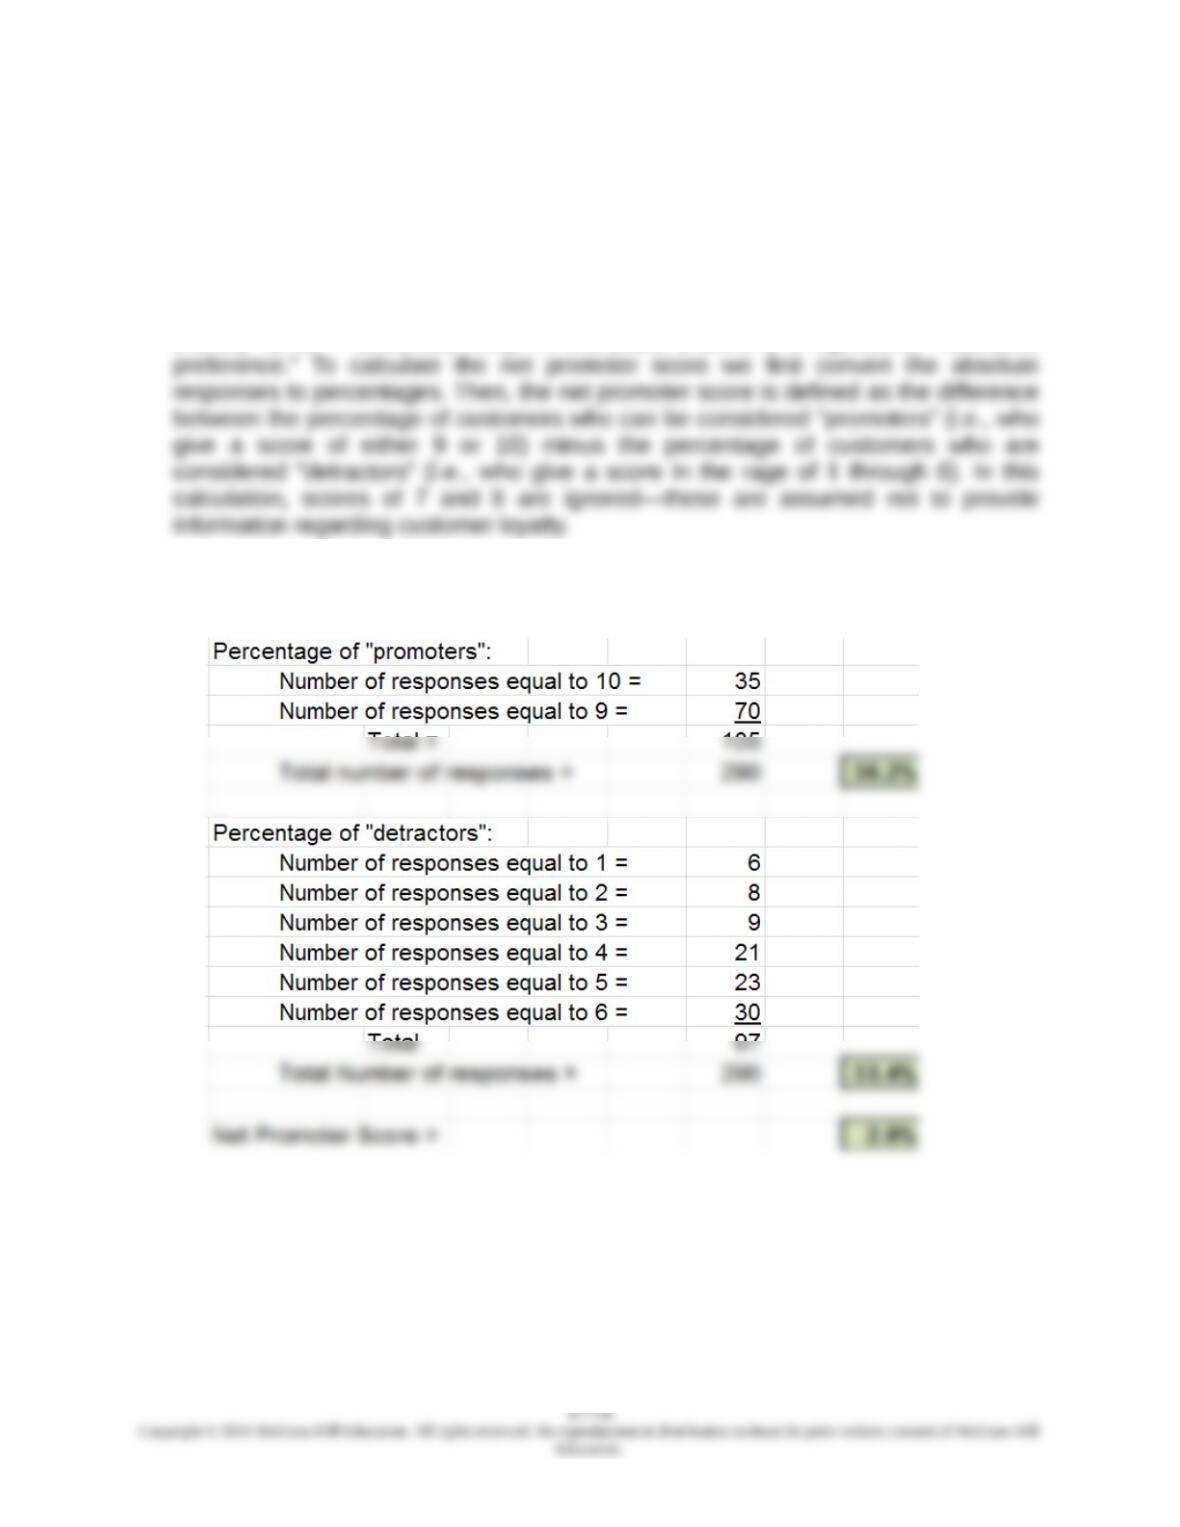
1. The “net promoter score” is an example of a non-financial customer-related
performance indicator. It is calculated based on responses to the following question
posed to an organization’s customers: “How likely is it that you would recommend
our firm/company to a friend or to a colleague?” As indicated in this exercise,
customers respond to this question using a 10-point scale, from 1 = “extremely
unlikely” to 10 = “extremely likely.” In this scale, a score of 5 represents “neutral/no
2. Net promoter score based on the assumed data/customer responses is 2.8%, as
follows:
Chapter 17 – The Management and Control of Quality
17-73 (Continued)
3. The net promoter score is recommended as a nonfinancial customer-related
performance measure based on research that indicates that a customer’s
willingness to recommend a company is positively correlated with future growth and
profitability of the company. The net promoter score can be viewed as a measure of
customer loyalty. The underlying argument is that a traditional measure of customer
loyalty, customer retention, is not a good indicator of a customer’s loyalty. This is
because customers may remain as a customer either because there are no
alternatives, because of high switching costs, or simply because of inertia, not
because of “customer loyalty.” Academic research shows that the only true loyal
customers are those classified as “promoters” of the company’s business.
Source Documents for the Net Promoter Score:
1. F. Reichheld, The Ultimate Question: Driving Good Profits and True Growth (Boston,
MA: Harvard Business Press, 2008).
2. F. Reichheld, “The One Number You Need to Grow,” Harvard Business Review
(December 2003), pp. 46-54.
Chapter 17 – The Management and Control of Quality
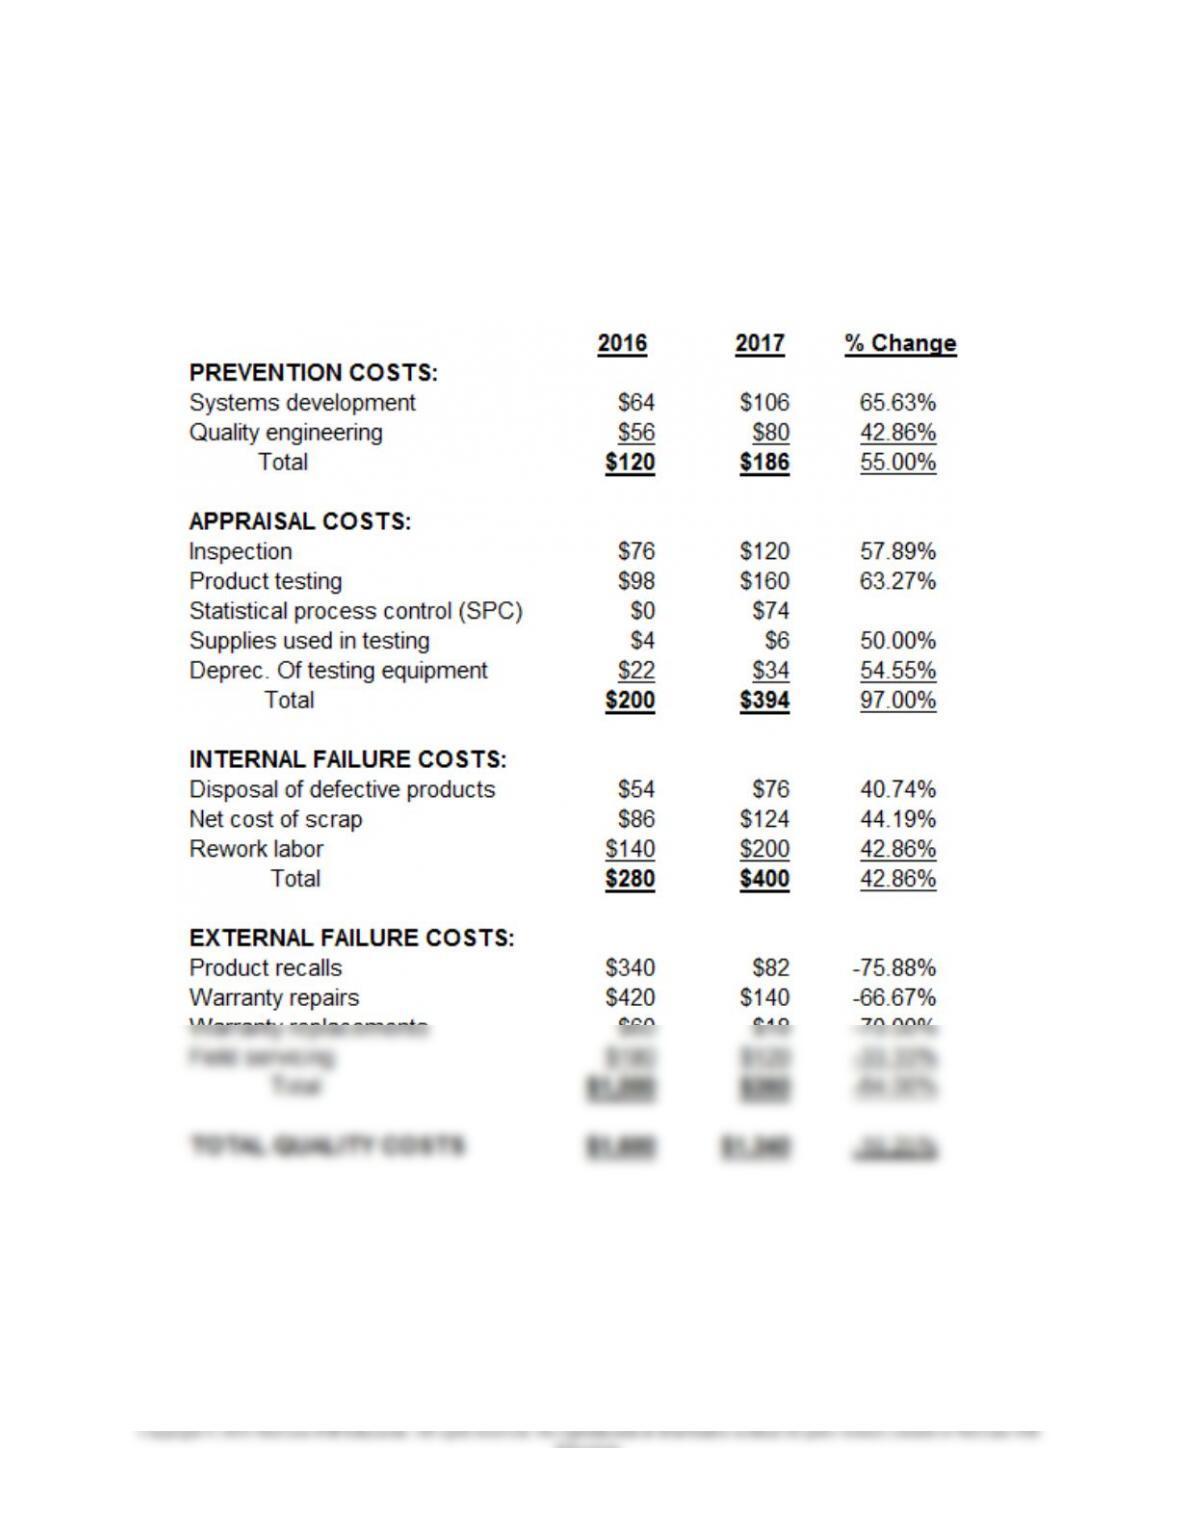
17-74 Cost-of-Quality (COQ) Reporting; Spreadsheet Application (50 Minutes)
1.
LEE ENTERPRISES
COST-OF-QUALITY (COQ) REPORT
FOR YEARS 2016 and 2017
17-80
Education.
Chapter 17 – The Management and Control of Quality
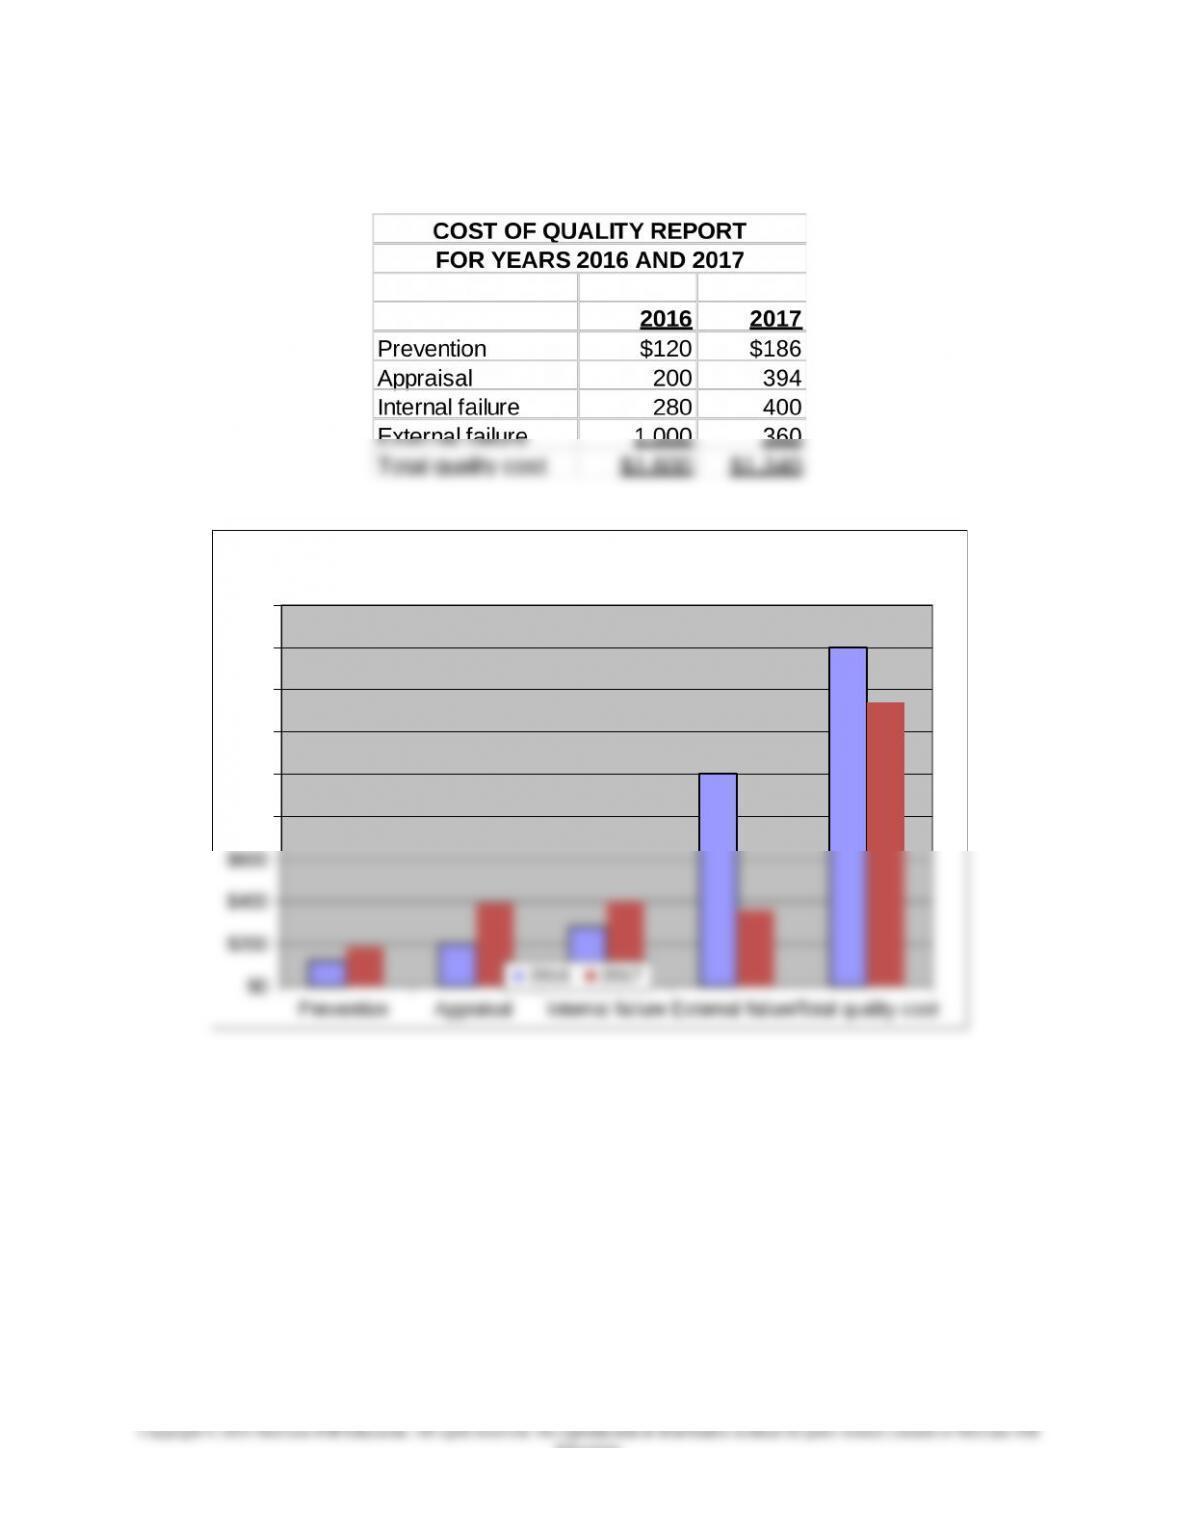
17-74 (Continued-1)
2.
Prevention Appraisal Internal failure External failure Total quality cost
$0
$200
$400
$600
$800
$1,000
$1,200
$1,400
$1,600
$1,800
Cost of Quality (COQ) Summary: 2016 vs. 2017
2016 2017
17-81
Education.