Chapter 17 – The Management and Control of Quality
17-66 (Continued-2)
Since JIT involves smooth and efficient flows throughout the entire value chain,
have suppliers and customers been consulted and included in any planning
17-62
Education.
Chapter 17 – The Management and Control of Quality
17-67 Assessing the Use and Role of Nonfinancial Performance Indicators (60
Minutes)
1. Nonfinancial performance indicators pertain to areas such as customer loyalty and
employee satisfaction. The authors of this cited article argue that monitoring and
reporting such measures as part of a comprehensive management accounting and
control system is important because:
as represented by the framework known as The Balanced Scorecard (BSC),
performance in these areas represents a precursor to financial performance
managers, etc.)
these indicators can, if appropriately developed, be used to assess
managerial performance
2. The authors hypothesize that many organizations are not able to reap the benefits of
including nonfinancial performance indicators in their management accounting and
control systems because:
haphazard selection of the set of nonfinancial performance indicators—many
organizations simply fail to choose and act on the right measures; in short,
and consistent with arguments that underlie the construction of an
Chapter 17 – The Management and Control of Quality
17-67 (Continued)
there is a natural tendency (i.e., bias) for managers to choose performance
indicators.
measurement errors—that is, companies choose performance indicators that
are not psychometrically sound (i.e., evidence regarding the validity of the
measures is not established)
3. The Institute of Management Accountants (IMA) has recently (December 11, 2008) a
revised its definition of “management accounting” (http://www.imanet.org [requires
log-in name and password]). This statement indicates that management accounting:
… is a profession that involves partnering in management decision-
making, devising planning and performance-management systems, and
providing expertise in financial reporting and control to assist management
in the formulation and implementation of an organization’s strategy.
Source: Christopher D. Ittner and David F. Larker, “Coming Up Short on Nonfinancial
Performance Measurement,” Harvard Business Review (November 2003), pp. 88-95.
17-64
Education.
Chapter 17 – The Management and Control of Quality
17-68 Relevant Costs and Quality Improvement (25 minutes)
1.
Lightening Bulk Company
Cost and Benefit Analysis of the Proposed
Scheduling and Tracking System
Cost of the new system (per year) $ 125,000
Expected benefits each year from the new system:
Contribution margin from sales increase:
(6,000 × 10%) × $200 × 37.5% = $ 45,000
Cost savings from decrease in misplaced
items—existing sales: 6,000 × (13% − 1.0%) × $65 = 46,800
Savings foregone from decrease in lost items—existing
2. Among other factors the manager needs to consider are: reliability and accuracy of
the estimates, including contribution margins, cost of tracking misplaced and lost
items (and their behavior patterns), and the estimated decreases in misplaced and
3. Cost to handle lost or misplaced items in the country in question:
Misplaced items: 6,000 × 13.0% × 0.8 × $65 = $40,560
Lost items: 6,000 × 2.0% × 0.8 × $300 = + 28,800
Total cost of handling lost/misplaced items $69,360
17-65
Education.
Chapter 17 – The Management and Control of Quality
17-69 Relevant Costs and Quality Improvement (50 Minutes)
1. Cost of new equipment and installation $12,000,000
Training 3,000,000
2. Quality cost if no change is made:
Rework (3,000 × 40%) × $2,000/unit = $ 2,400,000
Repair (3,000 × 15%) × $2,500/unit = 1,125,000
Appraisal 600,000
Inspection 3,000 × $50 = 150,000
Foregone contribution from lost sales:
Contribution margin per unit:
($12,000 × 85%) − $2,500 = $7,700
Quality cost of the new process:
Warranty repairs (3,000 0.8) × 5.0% × $1,000/unit = (187,500)
Savings from the new process each year $ 9,862,500
Years effective × 3
Savings over Three-Year Period $29,587,500
Appraisal and inspection cost, Year 1 ($600,000 +
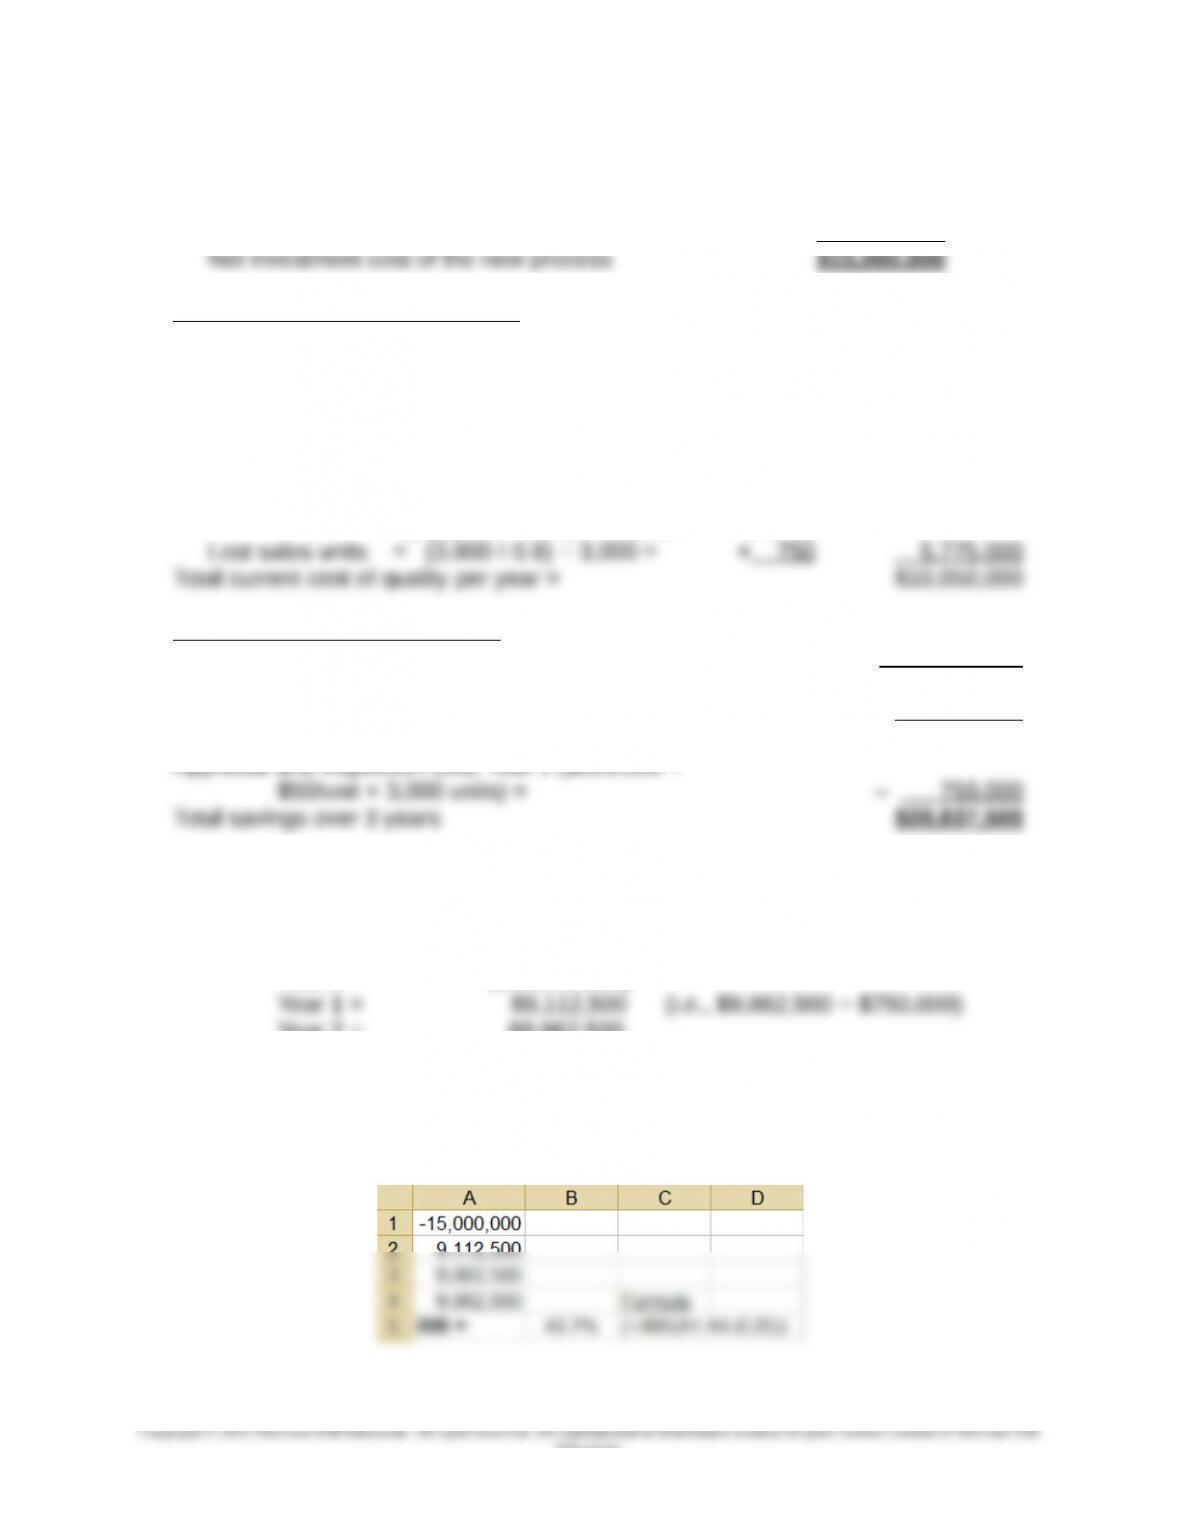
3. Yes. The cost of the new process is $15,000,000 and the expected benefits total
$28,837,500 over three years. The pattern of pre-tax cash flows for this investment
opportunity is as follows:
Year 0 = ($15,000,000)
Year 2 = $9,862,500
Year 3 = $9,862,500
Thus, the payback period for this proposed investment is less than two years. Its
internal rate of return (IRR) is approximately 41%, as shown in the following screen
shot from Excel:
17-66
Education.
Chapter 17 – The Management and Control of Quality
17-69 (Continued)
4. The following factors should be considered before making the final decision:
a. Accuracy of cost estimates, including:
contribution margin per unit
costs of current repair and rework
cost of the new process
b. Reliability of estimations of
rates of rework and repair
making
5. The member of the board would be right if we ignore the financial payoff of the new
process and if the company is going to be in business for only three years. Having
17-67
Education.
Chapter 17 – The Management and Control of Quality
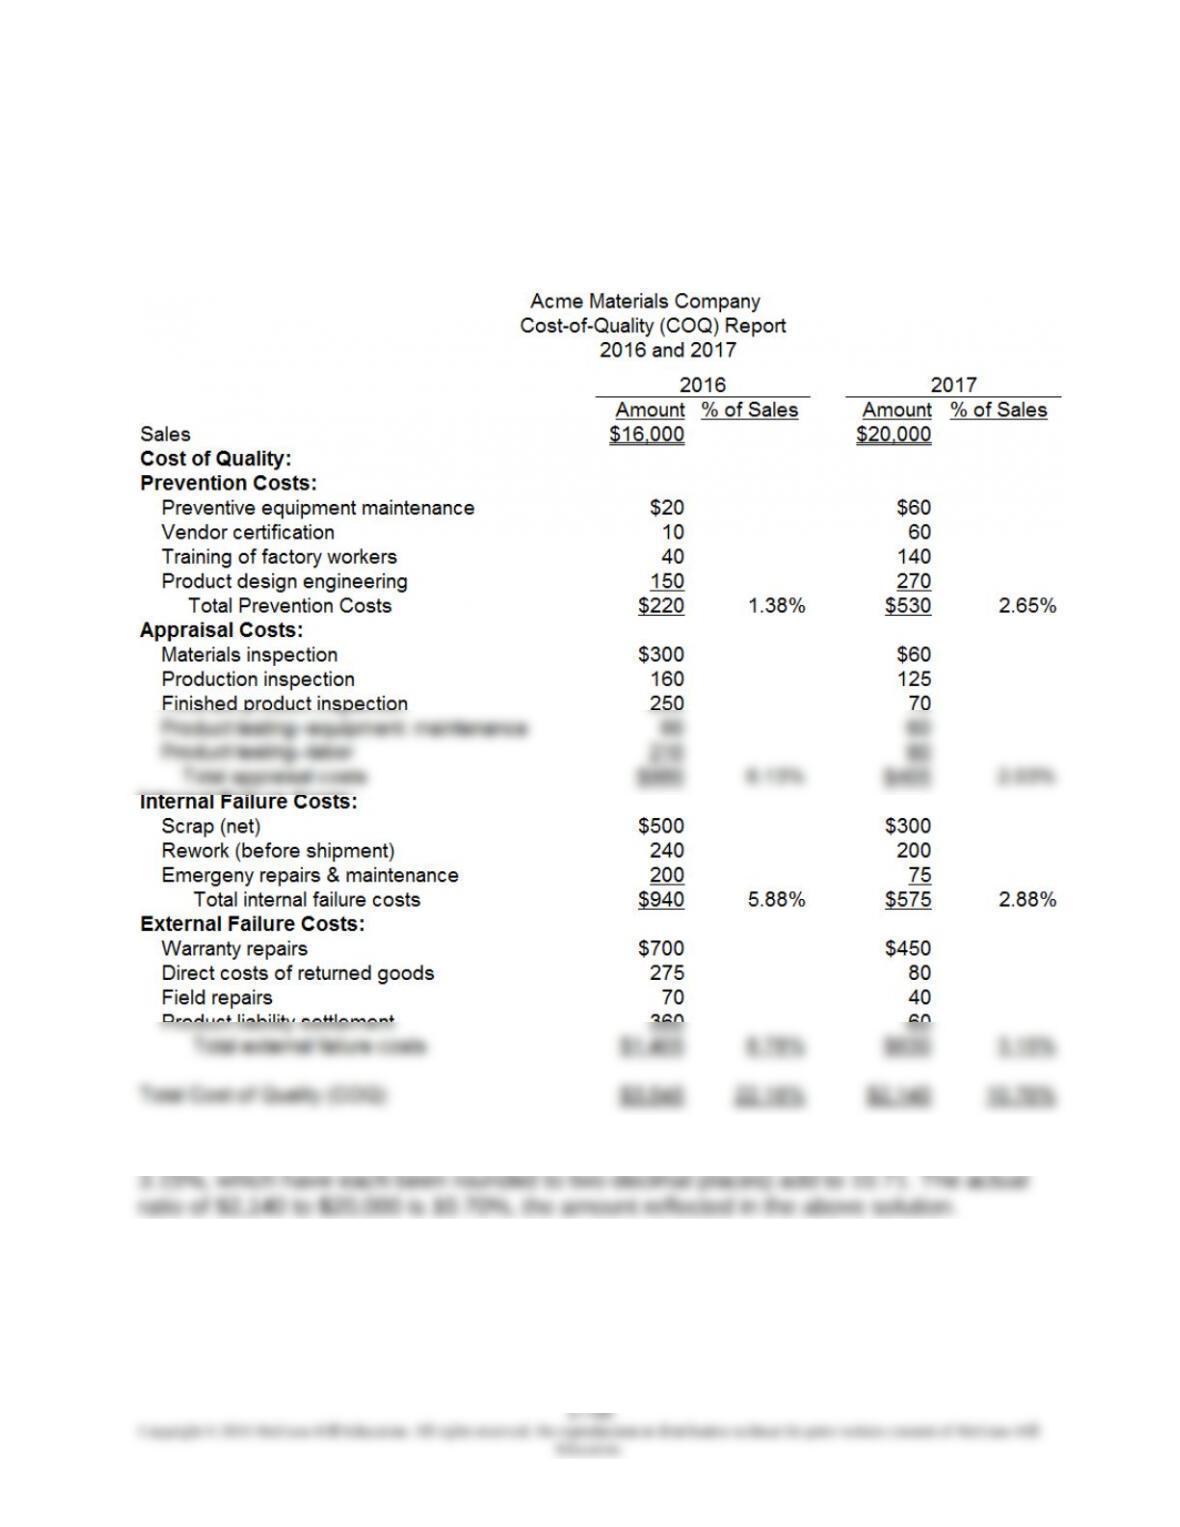
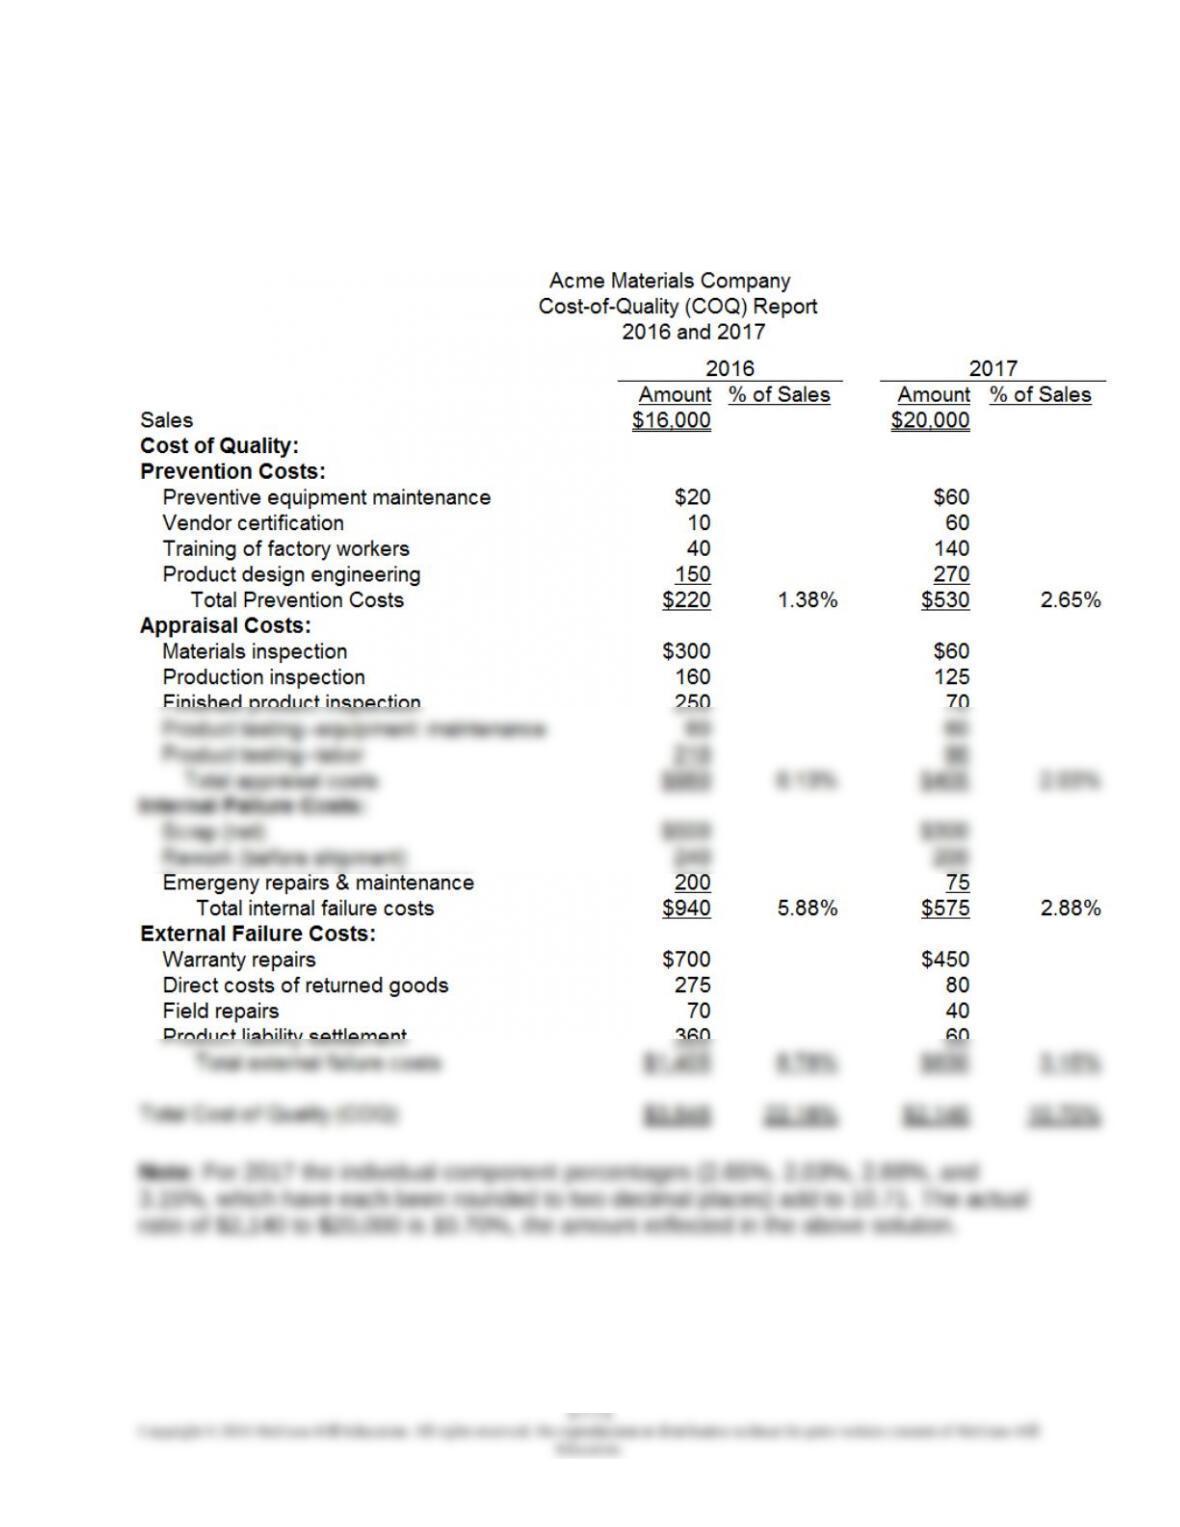
17-70 Cost-of-Quality (COQ) Analysis; Nonfinancial Performance Measures (60
Minutes)
1. and 2. Cost-of-Quality (COQ) Report
Note: For 2017 the individual component percentages (2.65%, 2.03%, 2.88%, and
Chapter 17 – The Management and Control of Quality
17-70 (Continued-1)
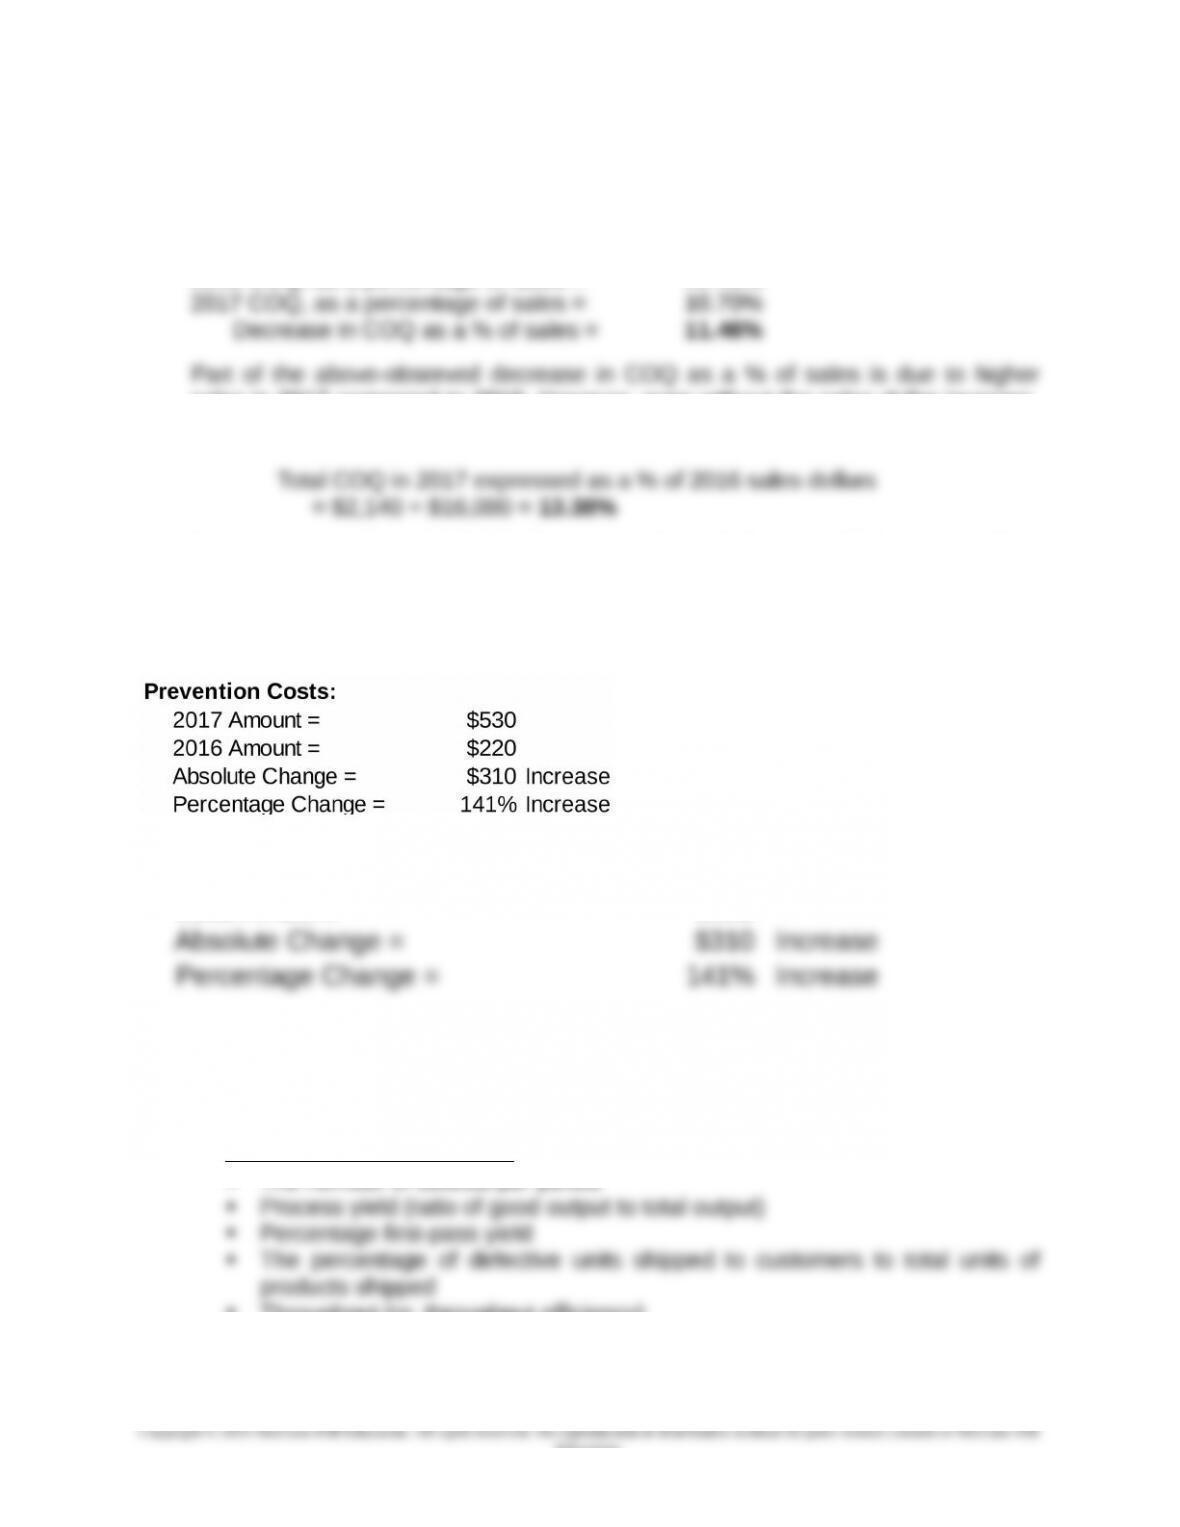
3. Decrease in total Cost of Quality (COQ) as a percentage of sales, from 2016 to
2017, is approximately 11%:
2016 COQ, as a percentage of sales = 22.16%
sales in 2017 compared to 2016. However, even without the sales dollar increase,
the total COQ has decreased, both in absolute and in relative terms:
Acme increased spending in 2017 on prevention (141% of the 2016 amount). As a
result, each of the other three categories of COQ (viz., appraisal, internal failure,
and external failure) decreased in 2017, both in absolute dollars and as a
percentage of sales dollars:
XPrevention Costs:
2017 Amount = $530
2016 Amount = $220
4. To complement the COQ data, the company may want to collect both internal and
external nonfinancial measures of quality, such as the following:
Internal Measures of Quality
The number of defects per period
Throughput (or, throughput efficiency)
17-70 (Continued-2)
17-69
Education.
Chapter 17 – The Management and Control of Quality
External Measures of Quality
The number of customer complaints
5. As should be obvious from an examination of Exhibit 17.3, there is a role for
both financial and nonfinancial quality data (metrics) in a comprehensive
framework for managing and controlling quality. COQ (i.e., financial) data are
reported only periodically. As such, they are likely of greater interest/value to
managers. After all, these are the individuals who ultimately have responsibility
over financial performance and who make spending and investment decisions
regarding quality costs.
Operating personnel, on the other hand, are likely to find nonfinancial quality
data to be more useful. For one thing, such data are expressed in terms that are
17-70
Education.
Chapter 17 – The Management and Control of Quality
17-71 Cost-of-Quality (COQ) Analysis—Spreadsheet Application (60 Minutes)
1-4: Cost of Quality (COQ)—Excel-Generated Report