Chapter 17 – The Management and Control of Quality
17-55 (Continued-2)
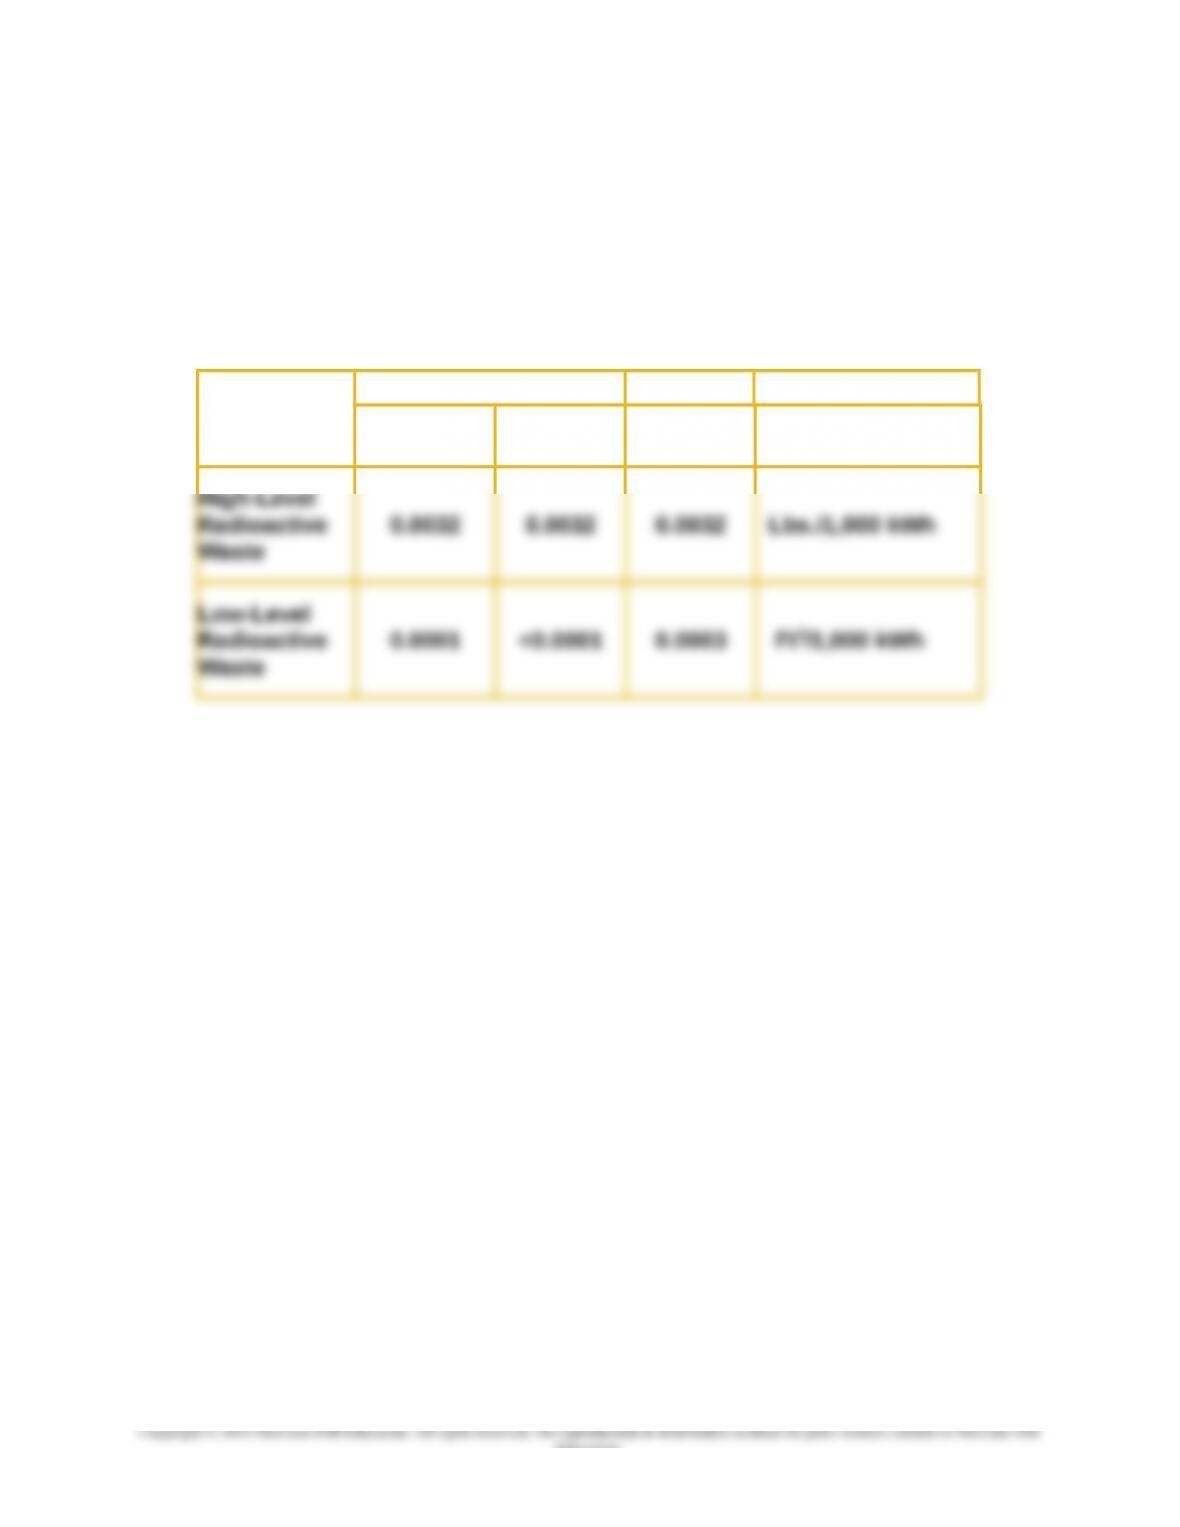
Note: The following chart is no longer available on the FirstEnergy website, but is
viewed as instructive nonetheless.
Radioactive Waste Produced:
Projected (2007) vs. Actual (First Three Quarters 2007)
and Projected Data for 2008
2007 2008
Projected
Quantity
Actual
Quantity
Projected
Quantity Measure
Waste
17-42
Education.
17-56 Nonfinancial Quality Indicators (30 minutes)
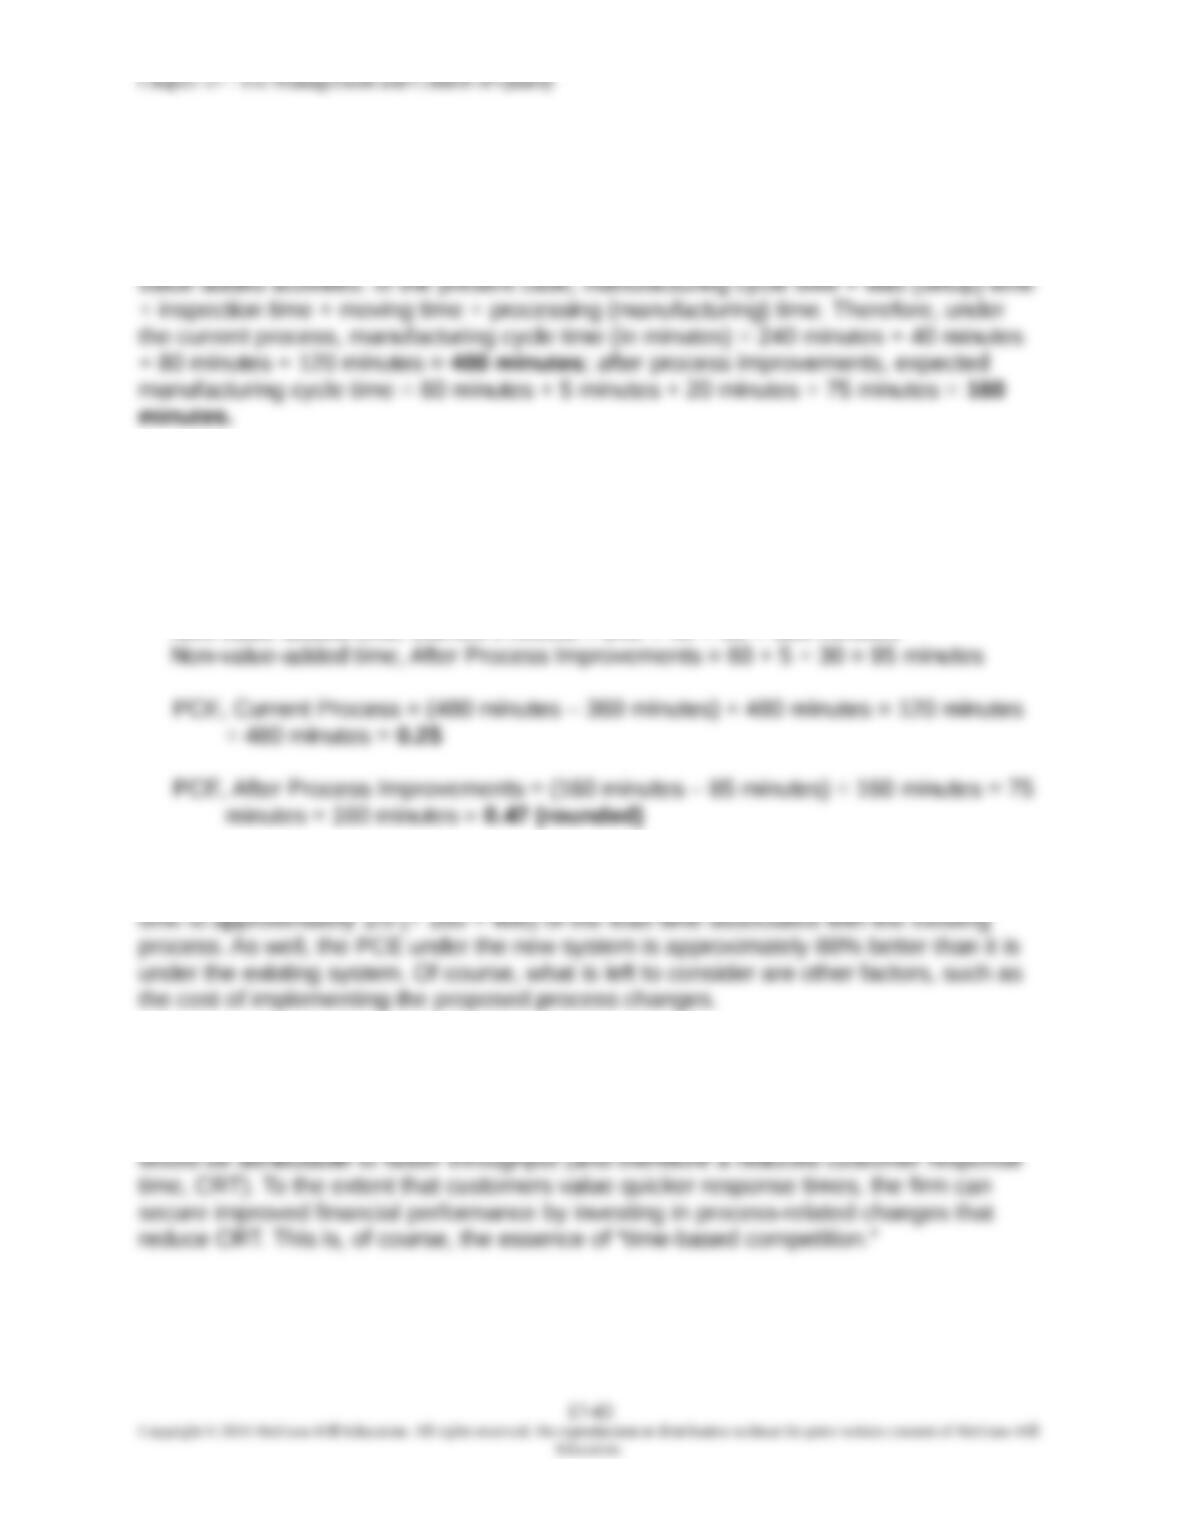
1. Production (manufacturing) lead time (also called manufacturing cycle time) is equal to
the difference between when an order is received by manufacturing and when that order
is completed. As such, manufacturing cycle time includes both value-added and non-
2. Process cycle efficiency (PCE), also called cycle-time efficiency or throughput time ratio,
is equal to the ratio of time spent on value-added activities to the sum of time spent on
all activities, both value-added and non-value-added. In the present case, non-value-
added activities = wait (setup) time + movement time + inspection time (i.e., everything
except for processing time).
Non-value-added time, Current Process = 240 + 40 + 80 = 360 minutes
3. Based only on the calculations presented above in requirements (1) and (2) above, the
company should implement the process improvements. The new manufacturing lead
4. As indicated in text Exhibit 17.1, certain investments in quality (including process-
related changes) can result, from the perspective of the customer, in higher perceived
value of the firm’s outputs. This increase in perceived value could result in higher
product prices, increased market share, or both. Higher perceived value in this case
Chapter 17 – The Management and Control of Quality
17-57 Nonfinancial Quality Measures: Net Promoter Score (30 minutes)
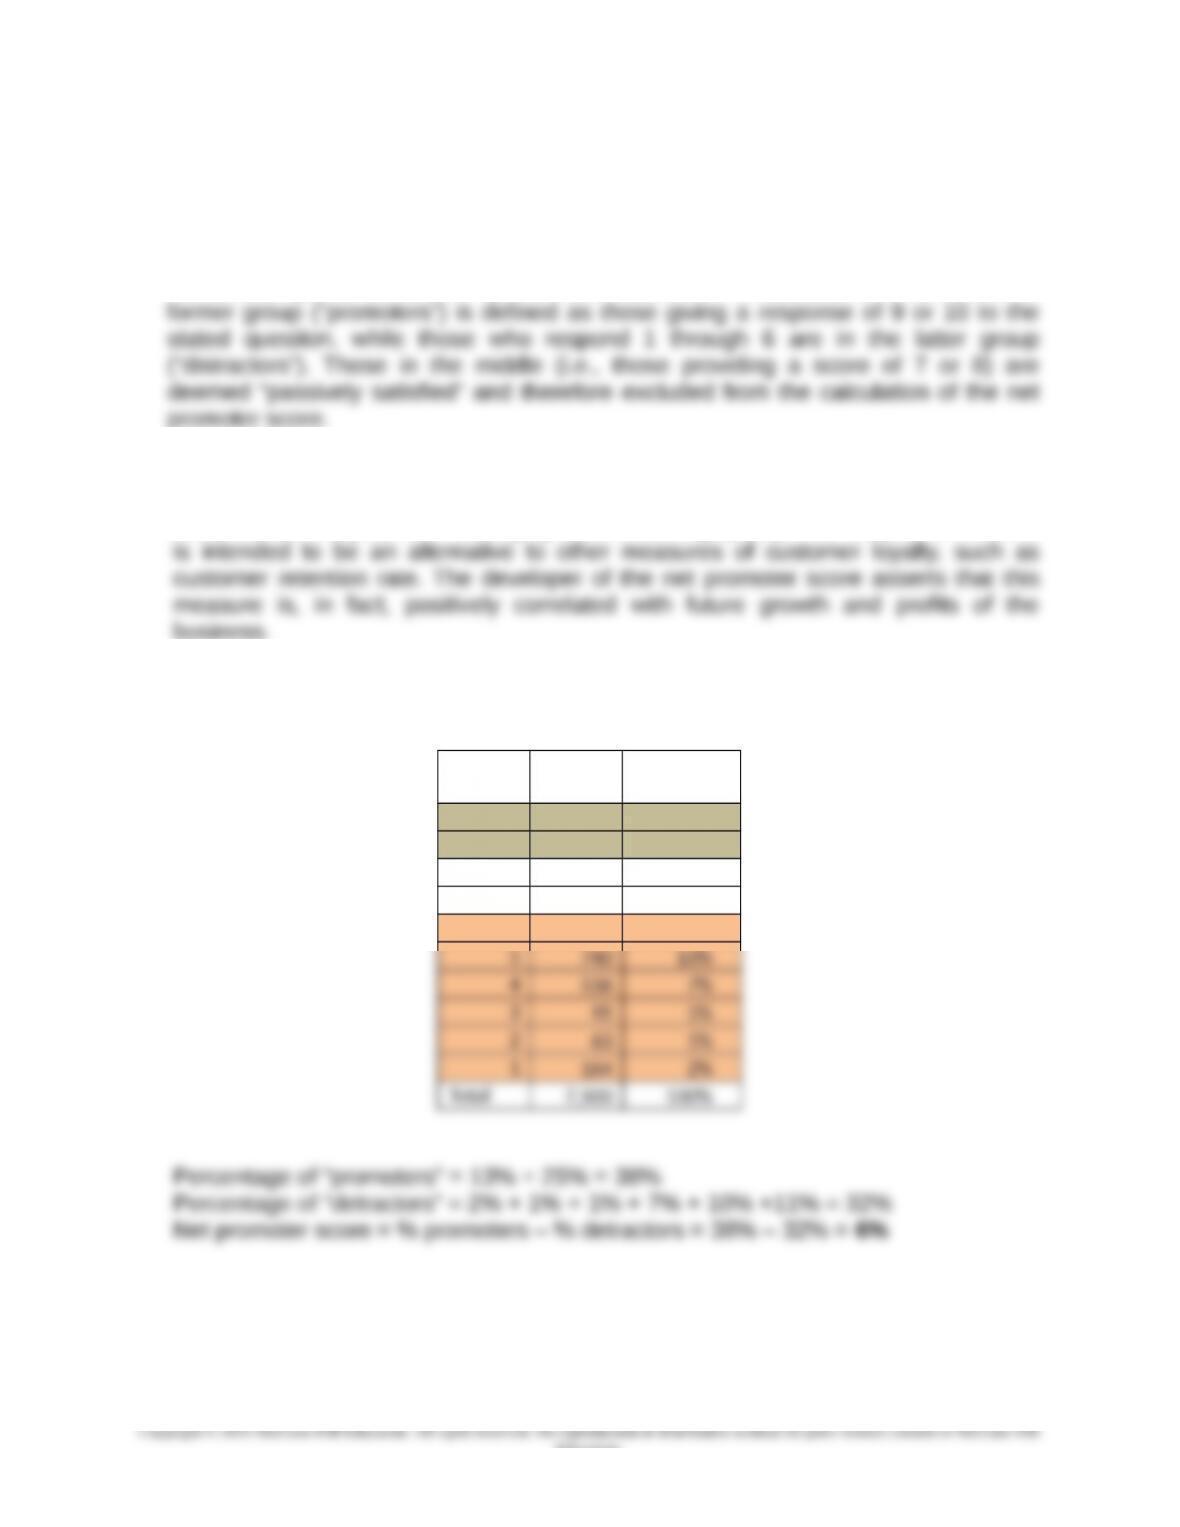
1. The “net promoter score” is a measure of the willingness of customers to recommend
a specified business, here Cope. The net promoter score is measured as the
difference between the percentage of “promoters” (those who strongly recommend
the business) and “detractors” (those who would not recommend the business. The
2. The net promoter score is meant to be a measure of customer loyalty, which is one of
the important nonfinancial performance measures that could be part of a
comprehensive system for managing and controlling quality. The net promoter score
3. Net promoter score based on the assumed data/customer responses is 6%, as
follows:
Score No.
Percentage
of Total
10 962 13%
91,898 25%
81,880 25%
7340 5%
6822 11%
17-44
Education.

Chapter 17 – The Management and Control of Quality
17-57 (Continued)
4. To provide interpretive value, a given net promoter score needs a standard against
which it can be compared. This standard could be past performance of the firm (is
Source Documents for the Net Promoter Score:
1. F. Reichheld, The Ultimate Question: Driving Good Profits and True Growth (Boston,
MA: Harvard Business Press, 2008).
2. F. Reichheld, “The One Number You Need to Grow,” Harvard Business Review
(December 2003), pp. 46-54.
Chapter 17 – The Management and Control of Quality
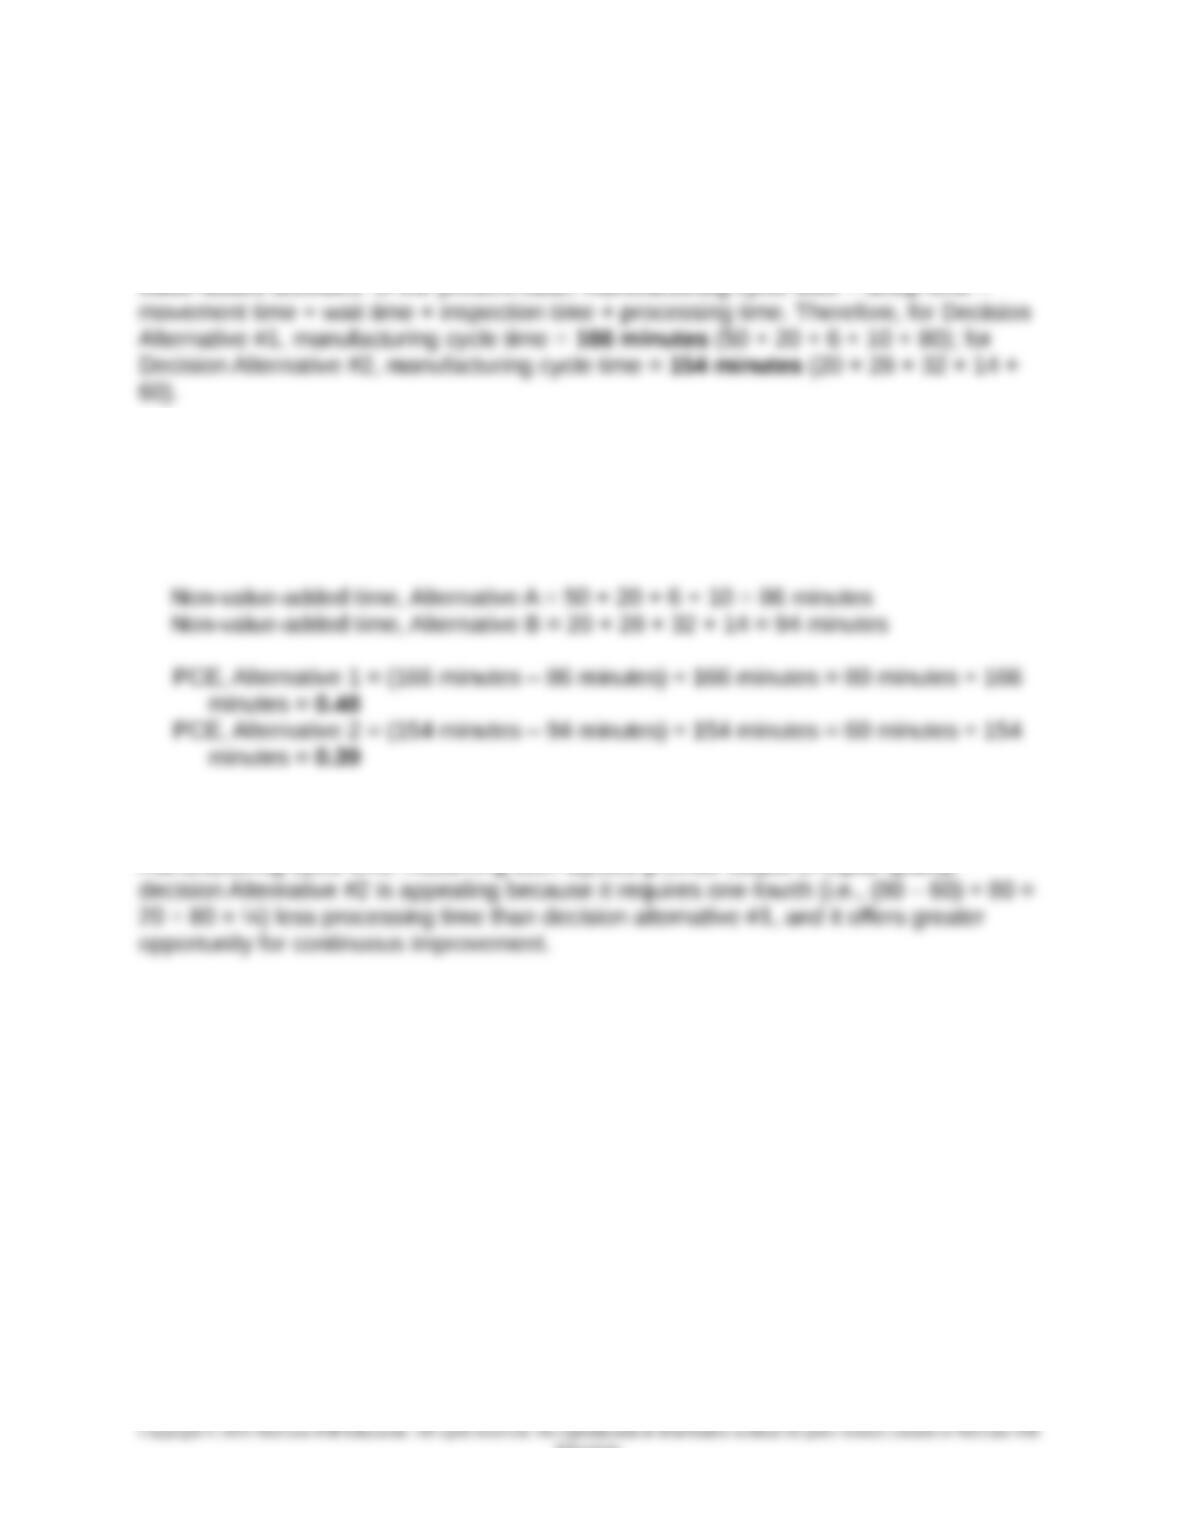
17-58 Process Cycle Efficiency (PCE) (25 minutes)
1. Production (manufacturing) lead time (also called manufacturing cycle time) is equal to
the difference between when an order is received by manufacturing and when that order
is completed. As such, manufacturing cycle time includes both value-added and non-
2. Process cycle efficiency (PCE), also called cycle-time efficiency or throughput time
ratio, is equal to the ratio of time spent on value-added activities to the sum of time
spent on all activities, both value-added and non-value-added (i.e., total manufacturing
cycle time). In the present case, non-value-added activities = setup time + movement
time + wait time + inspection time (i.e., everything except for processing time).
3. In selecting between decision alternatives 1 and 2, the process layout with the highest
efficiency (Alternative #1) would not likely be chosen because it has the longest
manufacturing cycle time. Assuming both layouts provide output of equal quality,
17-46
Education.
Chapter 17 – The Management and Control of Quality
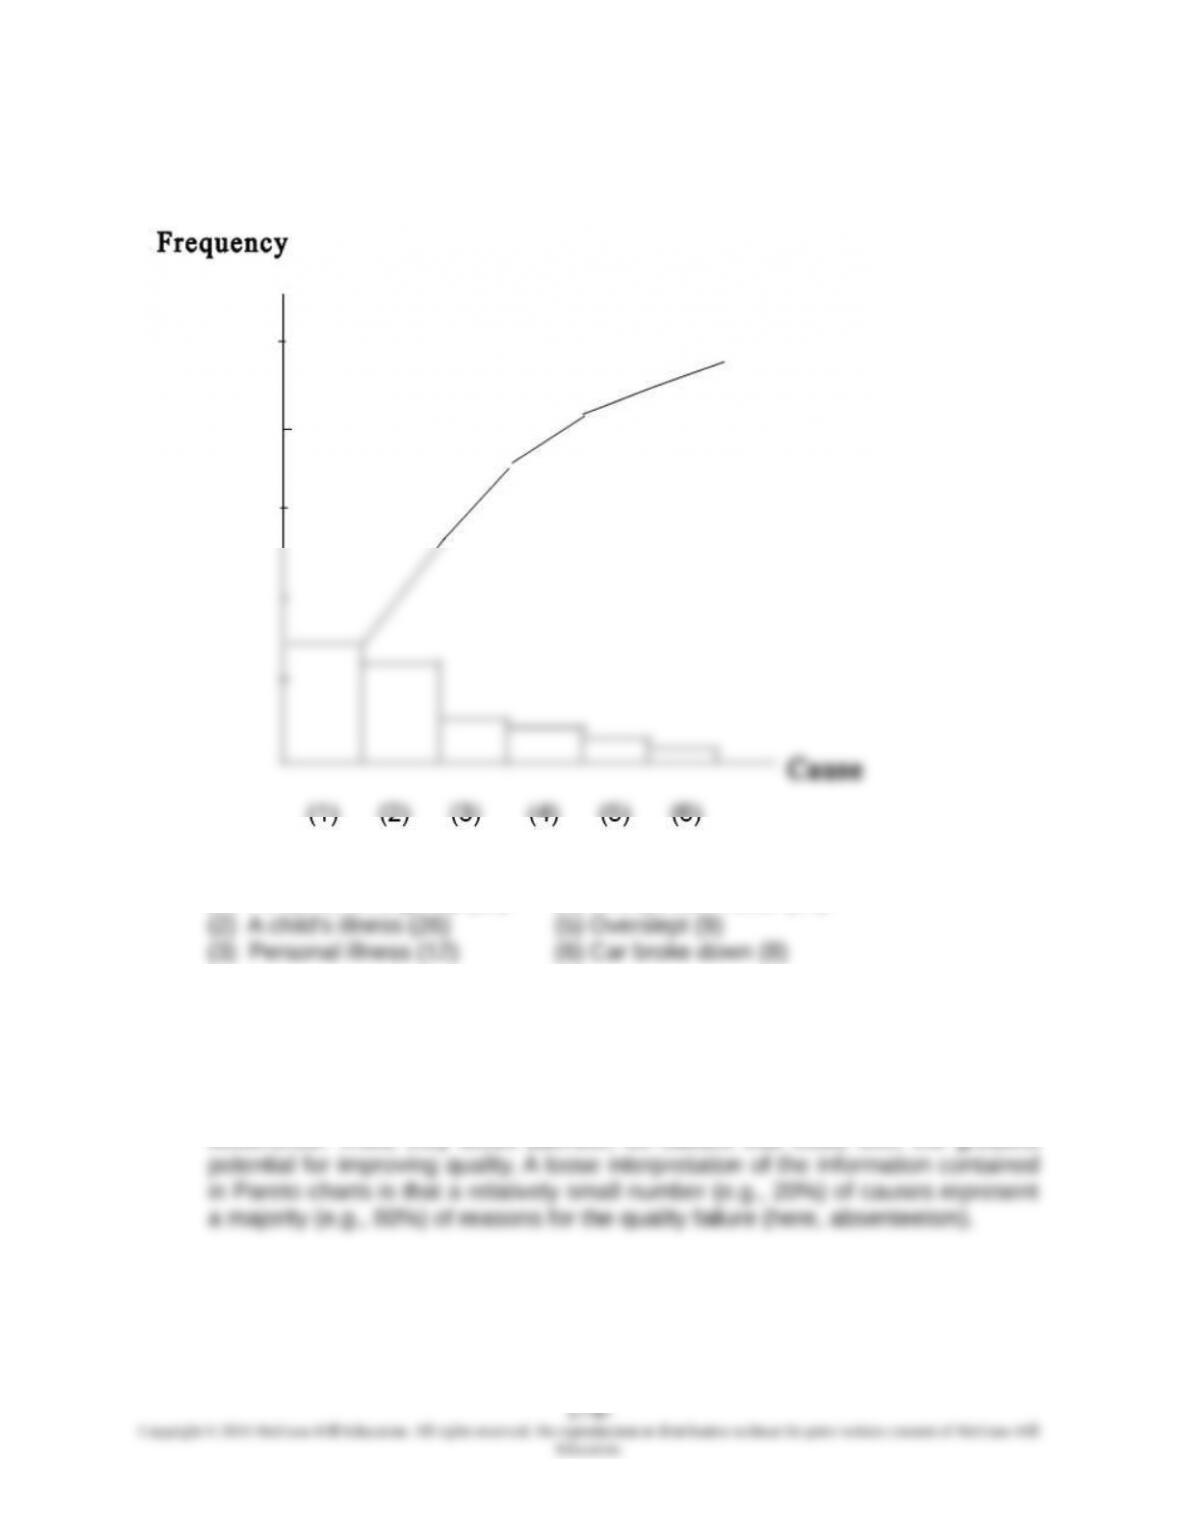
17-59 Pareto Diagram (Chart) (15 minutes)
Legend
(1) Personal emergency (32) (4) Unexpected visitor (11)
Pareto Charts (Diagrams) can be used for diagnostic control purposes, that is,
to identify the primary causes of an identified quality problem (such as
“absenteeism”) and, as such, to identify possible solutions to the problem. These
charts are named after the Italian economist Vilfredo Pareto; they provide a
prioritization of causes of an indicated quality problem, based on frequency of
occurrence. Thus, they focus attention on causes that could offer the greatest
Chapter 17 – The Management and Control of Quality
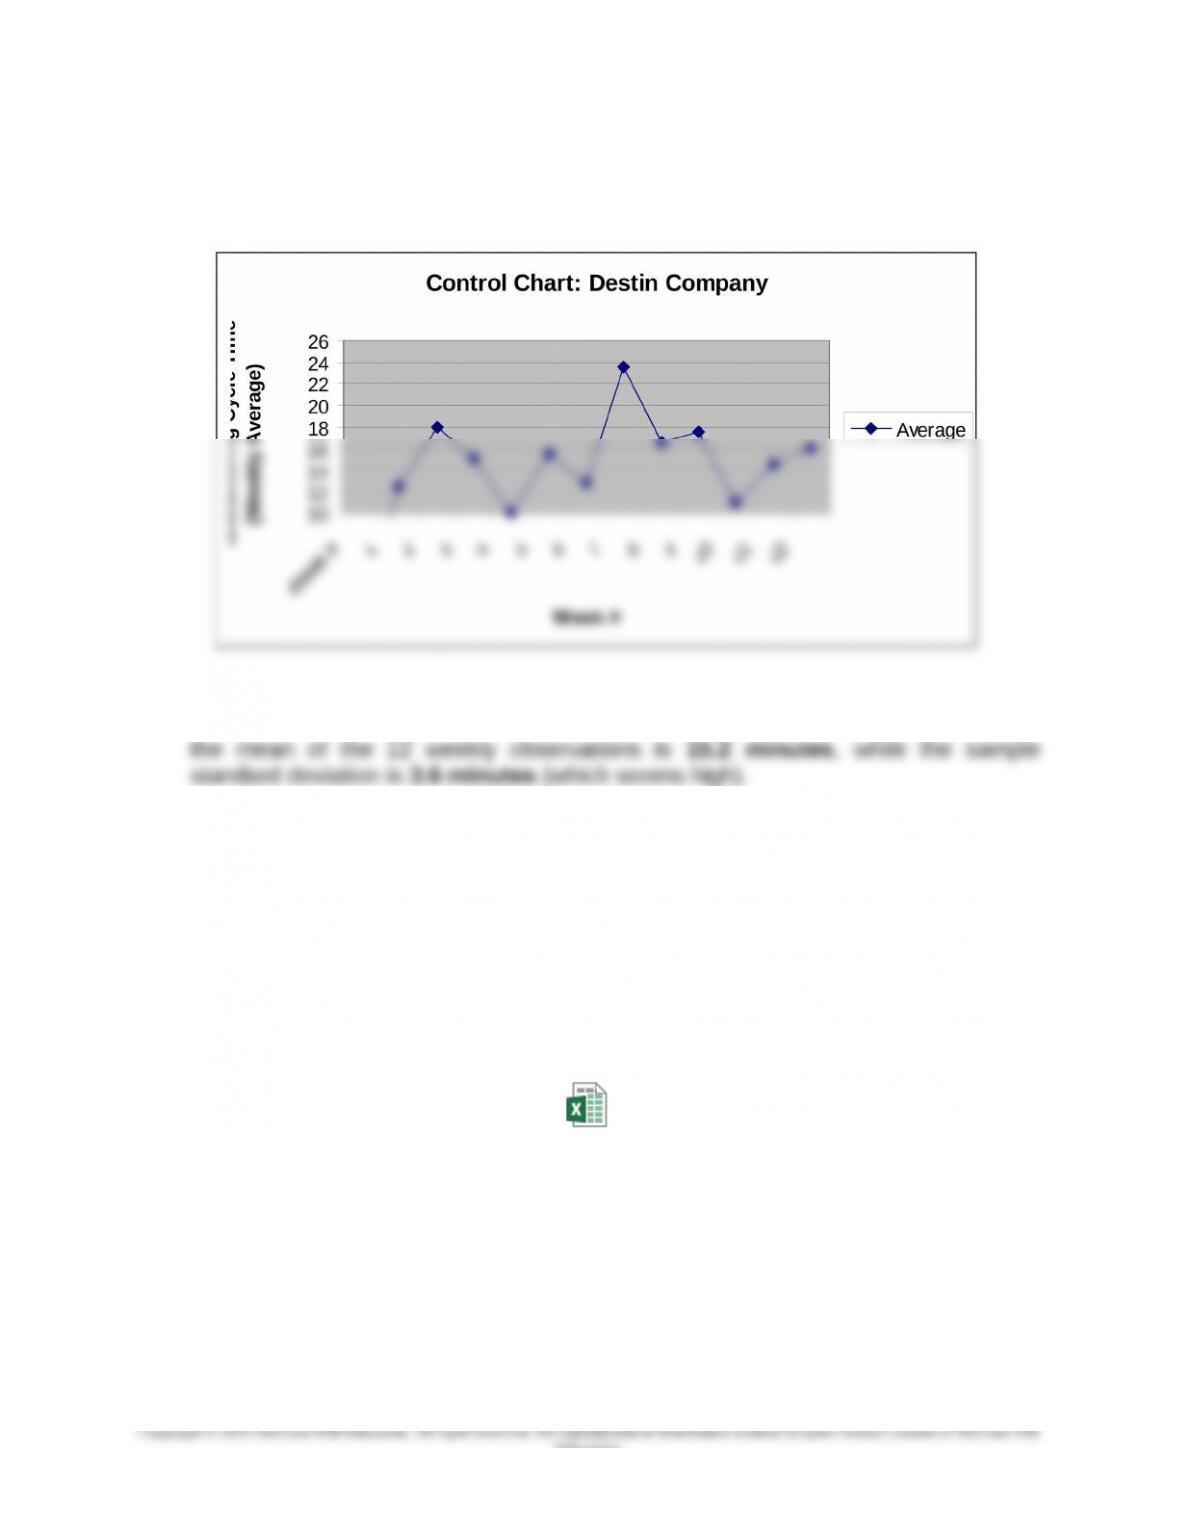
17-60 Control Chart; Spreadsheet Application (45 Minutes)
1. Control Chart—Manufacturing Cycle Times (Weekly Data)
2. The target cycle time is 14.0 minutes; the lower control limit is 12.0 minutes and
the upper control limit is 16.0 minutes. As indicated in the accompanying Excel file,
Note: An Excel spreadsheet solution file for this exercise is embedded in this
document. You can open the spreadsheet “object” that follows by doing the
following:
1. Right click anywhere in the worksheet area below.
2. Select “worksheet object” and then select “Open.”
3. To return to the Word document, select “File” and then “Close and return to…”
while you are in the spreadsheet mode. The screen should then return you to
the Word document.
17-48
Education.
Ex. 17-60 7e.xlsx
Chapter 17 – The Management and Control of Quality
17-60 (Continued)
3. As indicated in part (2), the mean of the sample observations (15.2) is not that far
from the target value (14.0). However, inspection of the control chart suggests wide
variability in the process, which is confirmed by the sample standard deviation of
the 12 observations around the mean value of the dataset. As well, we note that
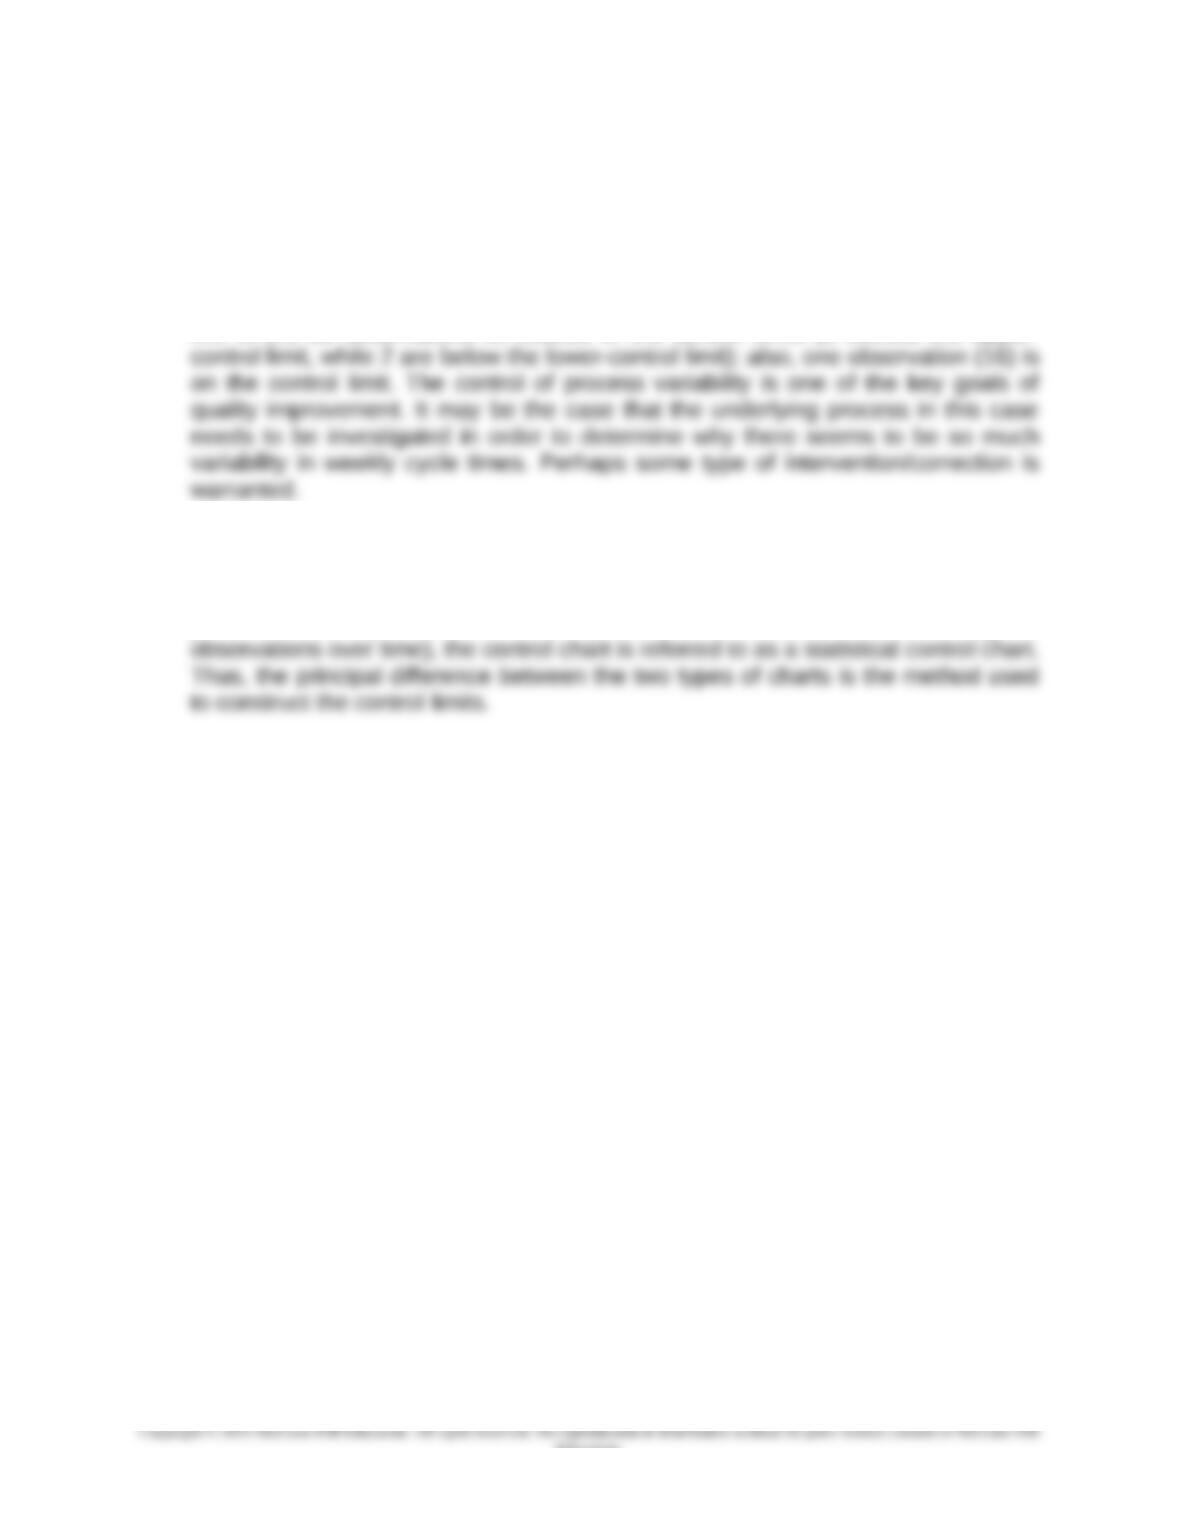
five of the 12 observations lie outside of the control limits (3 exceed the upper-
4. Management can determine the upper and lower control limits on their control
charts through experience (e.g., trial and error) or through the use of statistical
procedures. When these control limits are determined statistically (based on
process variability, measured either by standard deviations or on the range of
17-49
Education.
Chapter 17 – The Management and Control of Quality
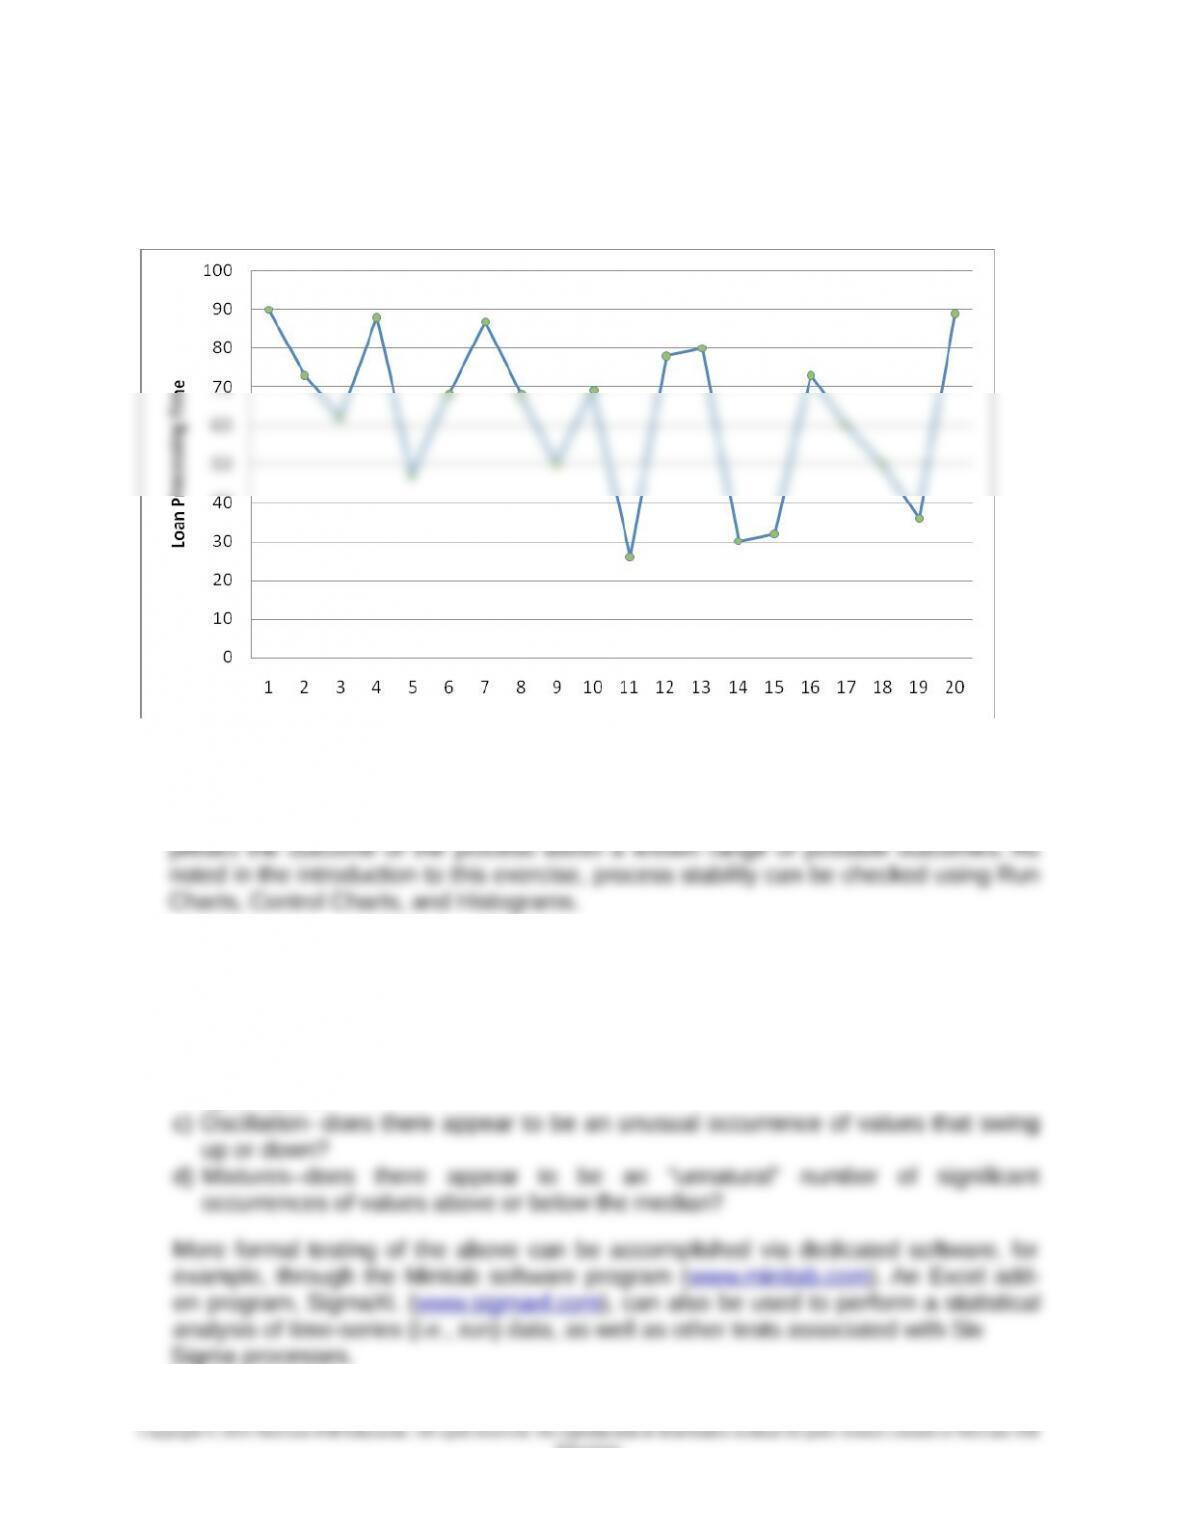
17-61 Using a Run Chart to Examine Process Stability; Spreadsheet Application (35
Minutes)
1. Time-series data plot:
Median Processing Time = 68.00; Mean (average) Processing Time = 62.80
2. The term “process stability” generally refers to how a process (in this case, loan
processing activity) performs over time. Having a stable process implies that you can
3. The data plot provided above in (1) can be checked visually for the following
indicators of process stability (or instability):
a) Clustering–is there what appears to be an “unnatural” grouping of values around
a certain observation?
b) Trend–does there appear to be an “unnatural” run (trend) of observations, either
up or down?
17-50
Education.
Chapter 17 – The Management and Control of Quality
17-62 Benefits and Challenges of Lean (60 minutes)
To: Management of MyOrg
From: I M Student
Re: Lean Accounting
You have asked me to provide information regarding: (1) the definition of “lean,” (2) the
strategic value of adopting lean principles, (3) anticipated costs of moving to lean, (4)
implications for cost-system design, and (5) sources for additional information. Below is
my response to your request.
1. The notion of “lean” can perhaps best be described as a philosophy or strategy of
meeting customer expectations in an increasingly competitive environment. As such,
the term is broad in that it encompasses changes in the way business processes are
executed as well as embracing the notion of continuous improvement coupled with
the elimination of waste and inefficiency. It was probably within this context that the
notion of the “lean enterprise” was coined. In such an organization, we usually find
changes in organizational structure: reduction of managerial layers accompanied by
an increased span of control. In turn, this change is supposed to result in faster and
more flexible decision-making. Finally, we note that some organizations, in
2. Strategically, the adoption of a lean philosophy can enable an organization to more
effectively deliver its stated value proposition to its targeted customer group. The
term “value proposition” is generally construed to mean meeting customer needs in
a unique, sustainable way—one that differentiates you from competitors. Thus, the
3. Cost associated with the move to “lean” are similar to those associated with any
major philosophical shift for an organization: