Chapter 17 – The Management and Control of Quality
17-48 (Continued)
3. There are likely opposing points of view. Companies that are included in
portfolios of high performance in the environmental (or social) area are certainly
likely to favor such disclosures. Stockholders (and potential investors) may favor
such disclosures, particularly since the external failure costs that some
companies face can have devastating effects on the ability of an organization to
17-32
Education.
Chapter 17 – The Management and Control of Quality
17-49 Cost-of-Quality (COQ) Report: Environmental Management (30 Minutes)
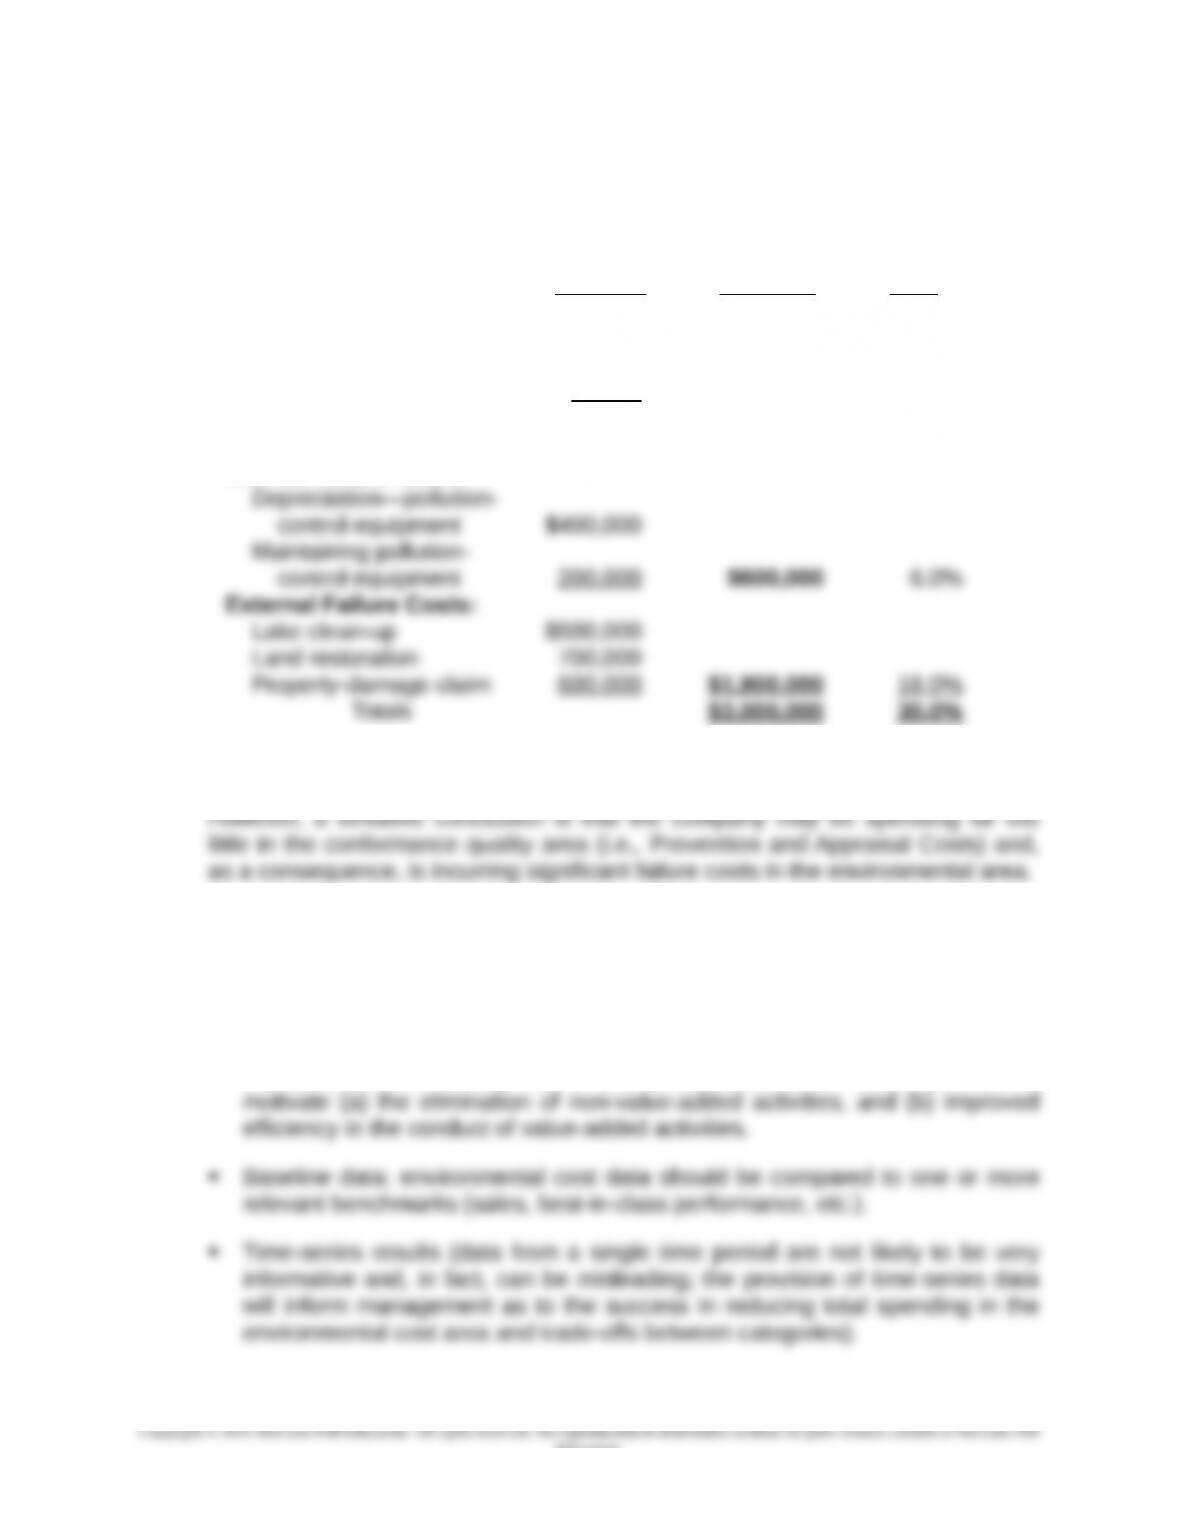
1. Sample Cost of Environmental Quality Report:
% of Total
Operating
Amounts Subtotals Cost
Prevention Costs:
Employee training $100,000
Product design 140,000
Supplier certification 40,000 $280,000 2.8%
Appraisal Costs:
Process inspection $320,000 3.2%
Internal Failure Costs:
2. With only a single year of data, it is difficult to draw any meaningful conclusions.
3. Some qualities (attributes) of an effective (“good”) environmental quality cost
system:
Collect environmental quality-cost data from across the value chain (i.e., the
scope of data collection should be broad).
If possible, utilize activity-based cost (ABC) data, which could be used to
17-33
Education.

Chapter 17 – The Management and Control of Quality
17-50 Cost-of-Quality (COQ) Improvement—Relevant Cost Analysis (30 Minutes)
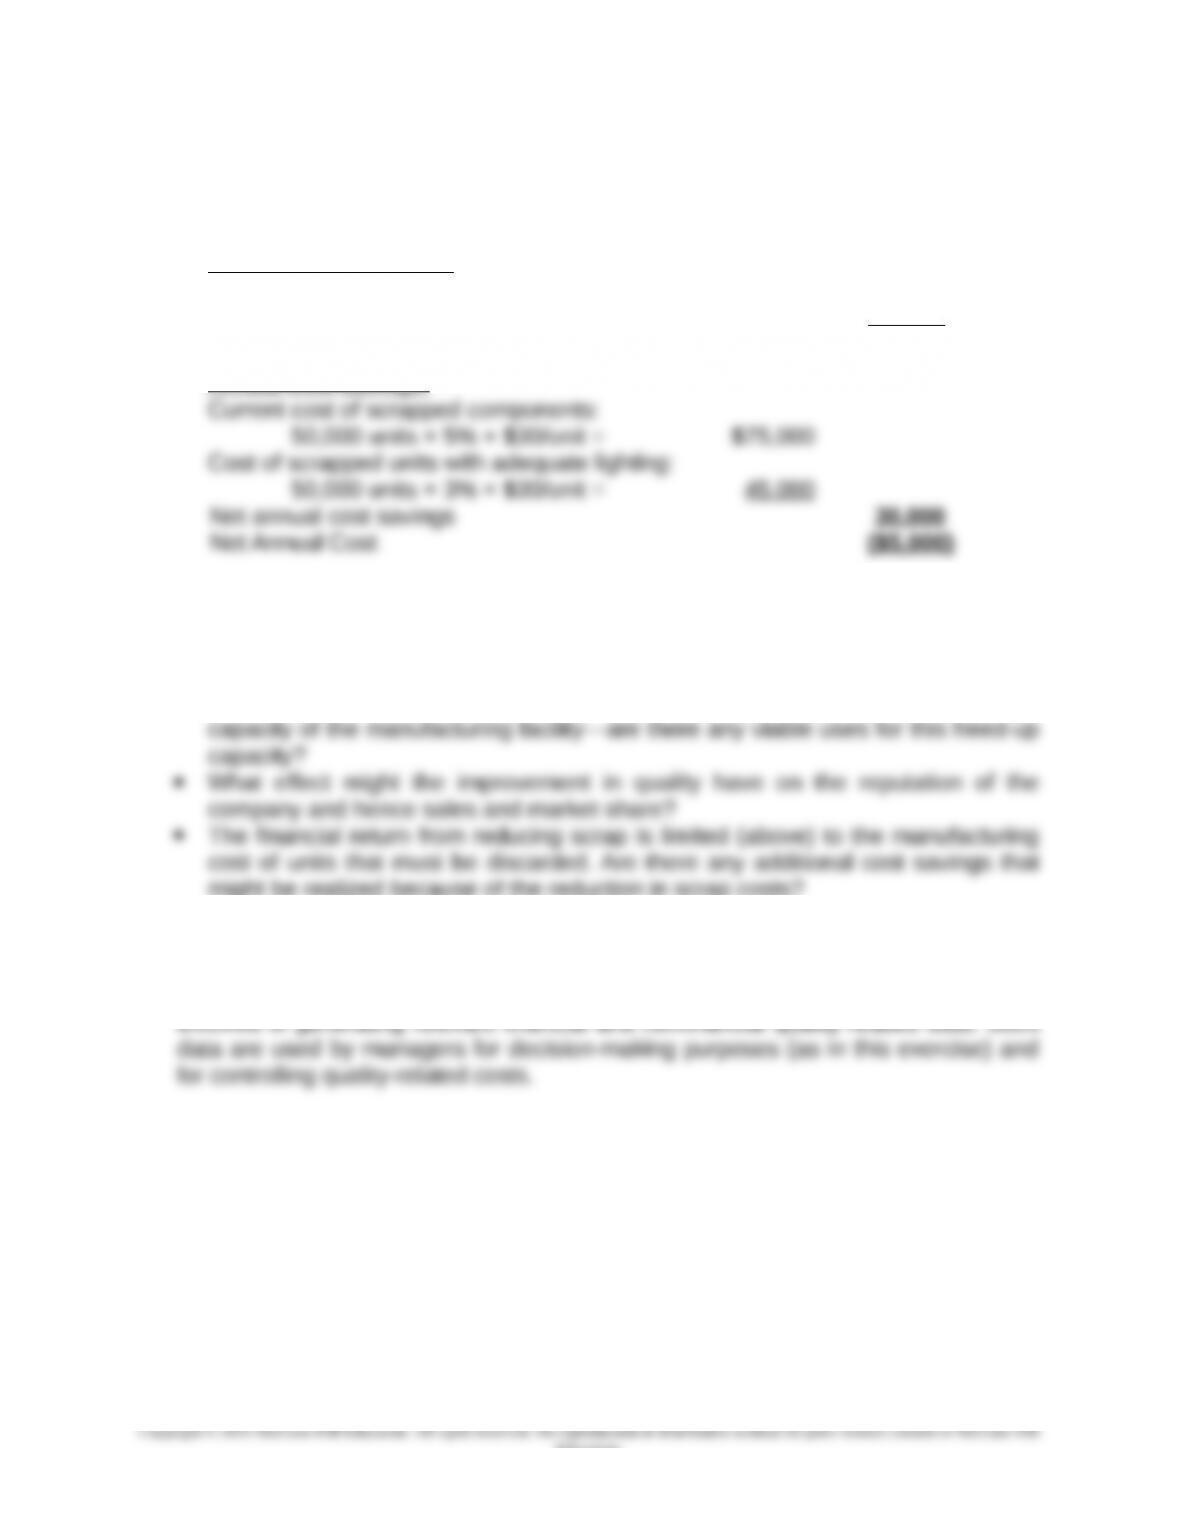
1. Relevant cost analysis (short-term impact on annual operating profit):
Annual Cost of Lighting:
Cost of a new lighting system: $100,000 5 years = $20,000
Additional operating cost per year 5,000
Incremental cost per year $25,000
Annual Cost Savings:
2. Some additional factors that might bear on this decision:
Time-value-of money (this type of problem is an example of a capital budgeting
decision; as such, the time-value-of-money should be taken into consideration).
The reduction in waste/scrapped products produced effectively increases the
might be realized because of the reduction in scrap costs?
3. As indicated in Exhibit 17.3 and the accompanying text discussion, the
management accountant plays a pervasive role in a comprehensive quality
management and control system. Fundamentally, the management accountant is
17-35
Education.
17-51 Relevant Cost Analysis—Conversion to JIT; Spreadsheet Application (25
Minutes)
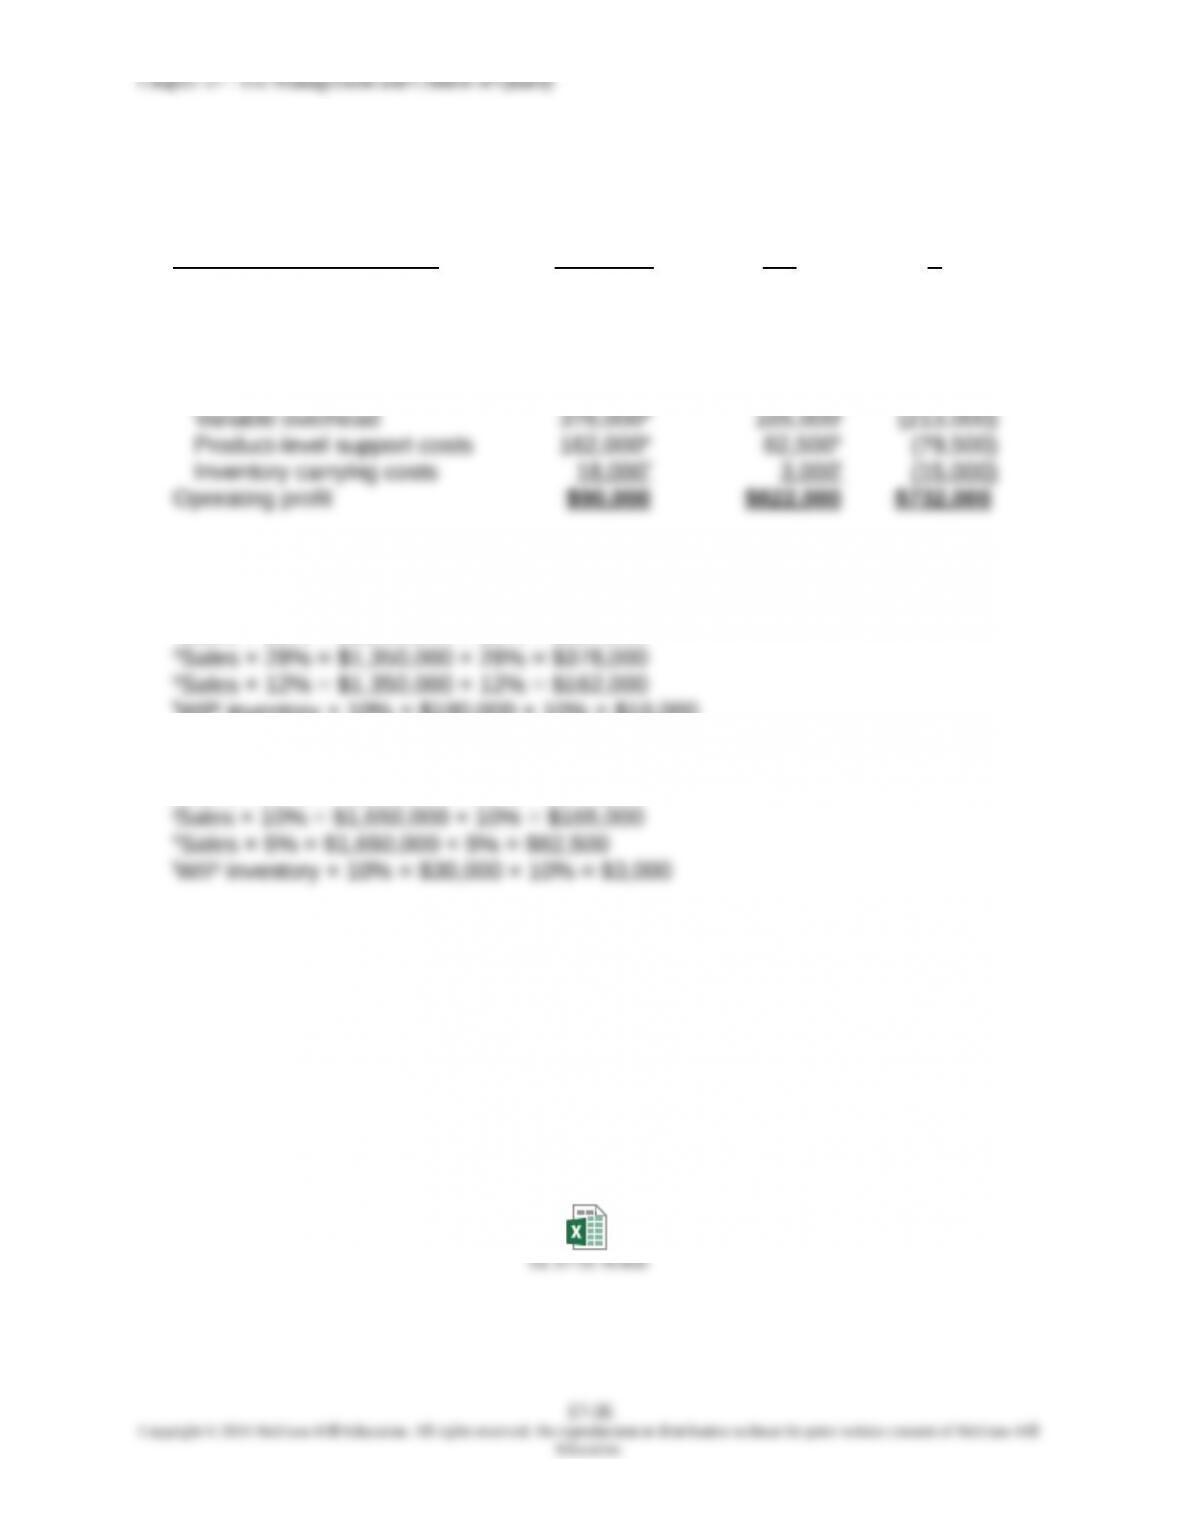
Current After
Income Statement Items Situation JIT
Sales $1,350,000a$1,650,000g$300,000
Less: Costs
Direct materials 405,000b330,000h(75,000)
Direct labor 297,000c247,500i(49,500)
Notes:
aGiven
bSales × 30% = $1,350,000 × 30% = $405,000
cSales × 22% = $1,350,000 × 22% = $297,000
gGiven
hSales × 20% = $1,650,000 × 20% = $330,000
iSales × 15% = $1,650,000 × 15% = $247,500
Note to Instructor: An Excel spreadsheet solution file for this exercise is embedded
in this document. You can open the spreadsheet “object” that follows by doing the
following:
1. Right click anywhere in the worksheet area below.
2. Select “worksheet object” and then select “Open.”
3. To return to the Word document, select “File” and then “Close and return
to…” while you are in the spreadsheet mode. The screen should then return
you to the Word document.
Ex. 17-51 7e.xlsx
17-36
Copyright © 2016 McGraw-Hill Education. All rights reserved. No reproduction or distribution without the prior written consent of McGraw-Hill
Education.
Chapter 17 – The Management and Control of Quality
17-52 Relevant Cost Analysis: Decision Making (30 Minutes)
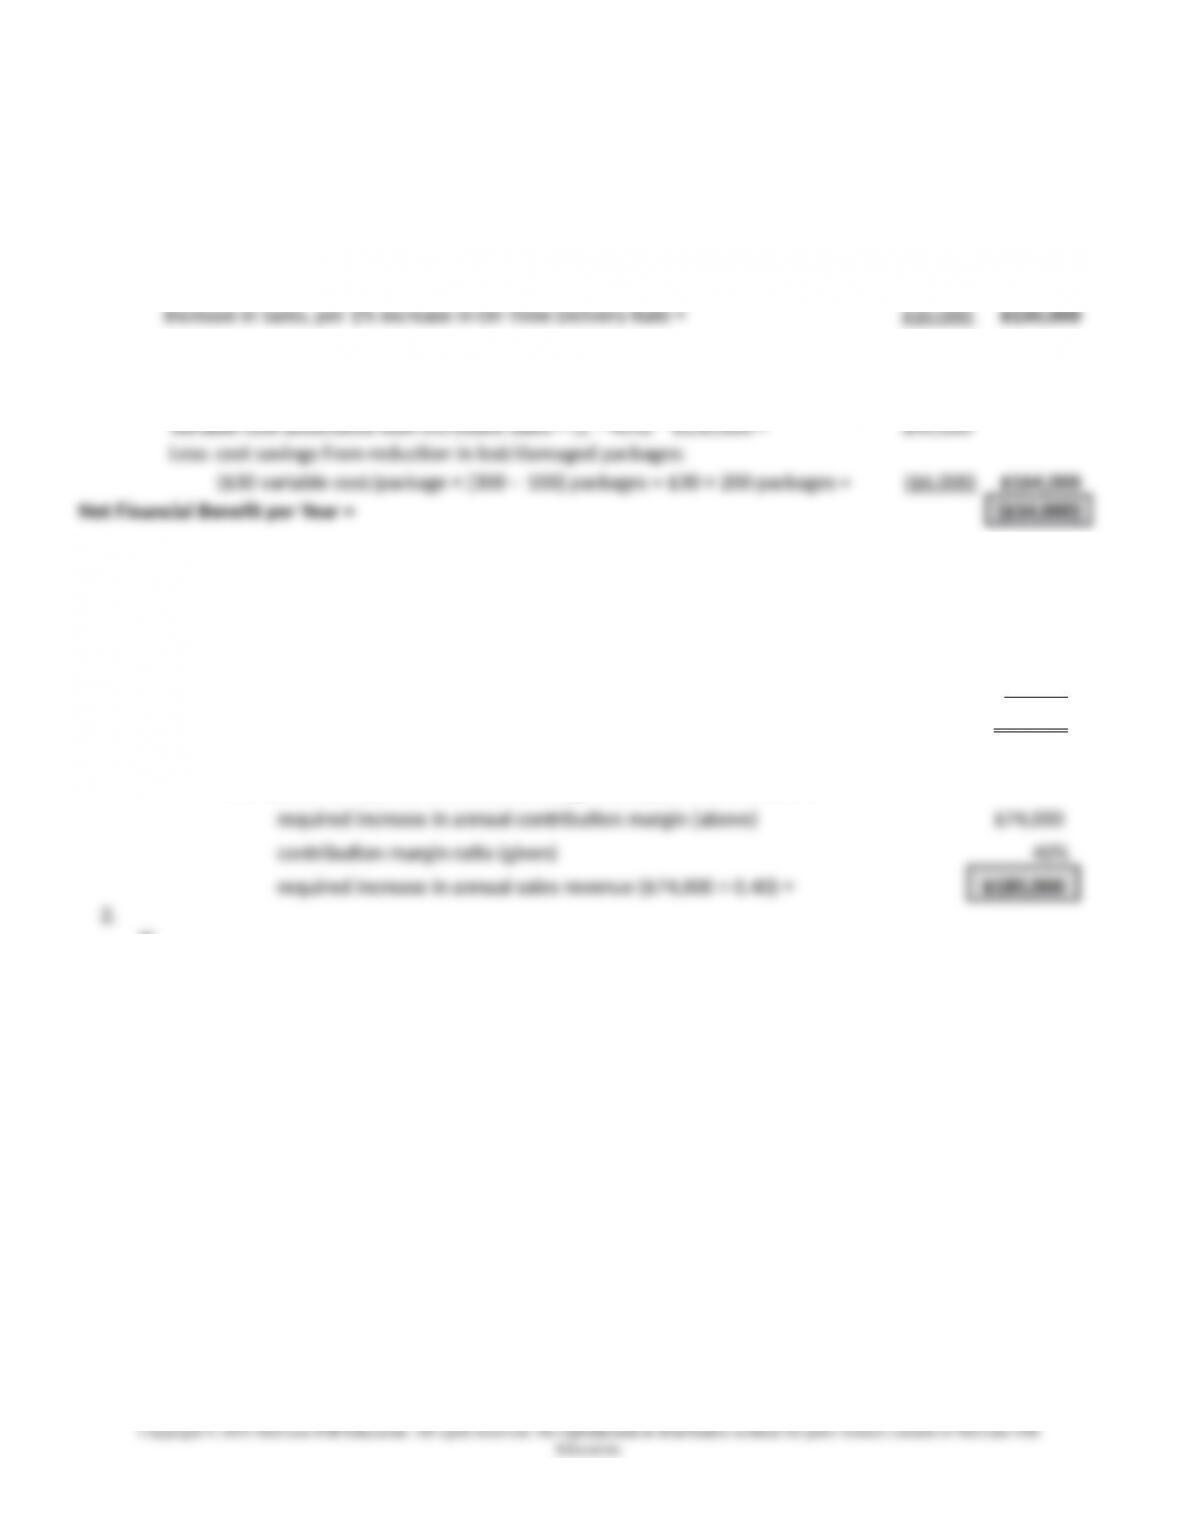
1. Net Annual Financial Beneit of Implemening the New Technology
Incremental Revenue from Improvement in On-Time Delivery Rate:
Improvement in On-Time Delivery Rate = 95% − 80% = 15%
Incremental Costs:
Annual cost of new technology $80,000
Therefore, based on assumed changes the proposed investment in the new technology is not jusiied.
Minimum Increase in Sales to Jusify Investment in New Technology
Annual cost of new technology (given) = $80,000
Minus: decrease in variable costs because of reducion in lost/damaged packages = $6,000
Required increase in annual contribuion margin to jusify new technology = $74,000
Conversion of required contribuion margin to required sales dollars:
X
17-37
Chapter 17 – The Management and Control of Quality
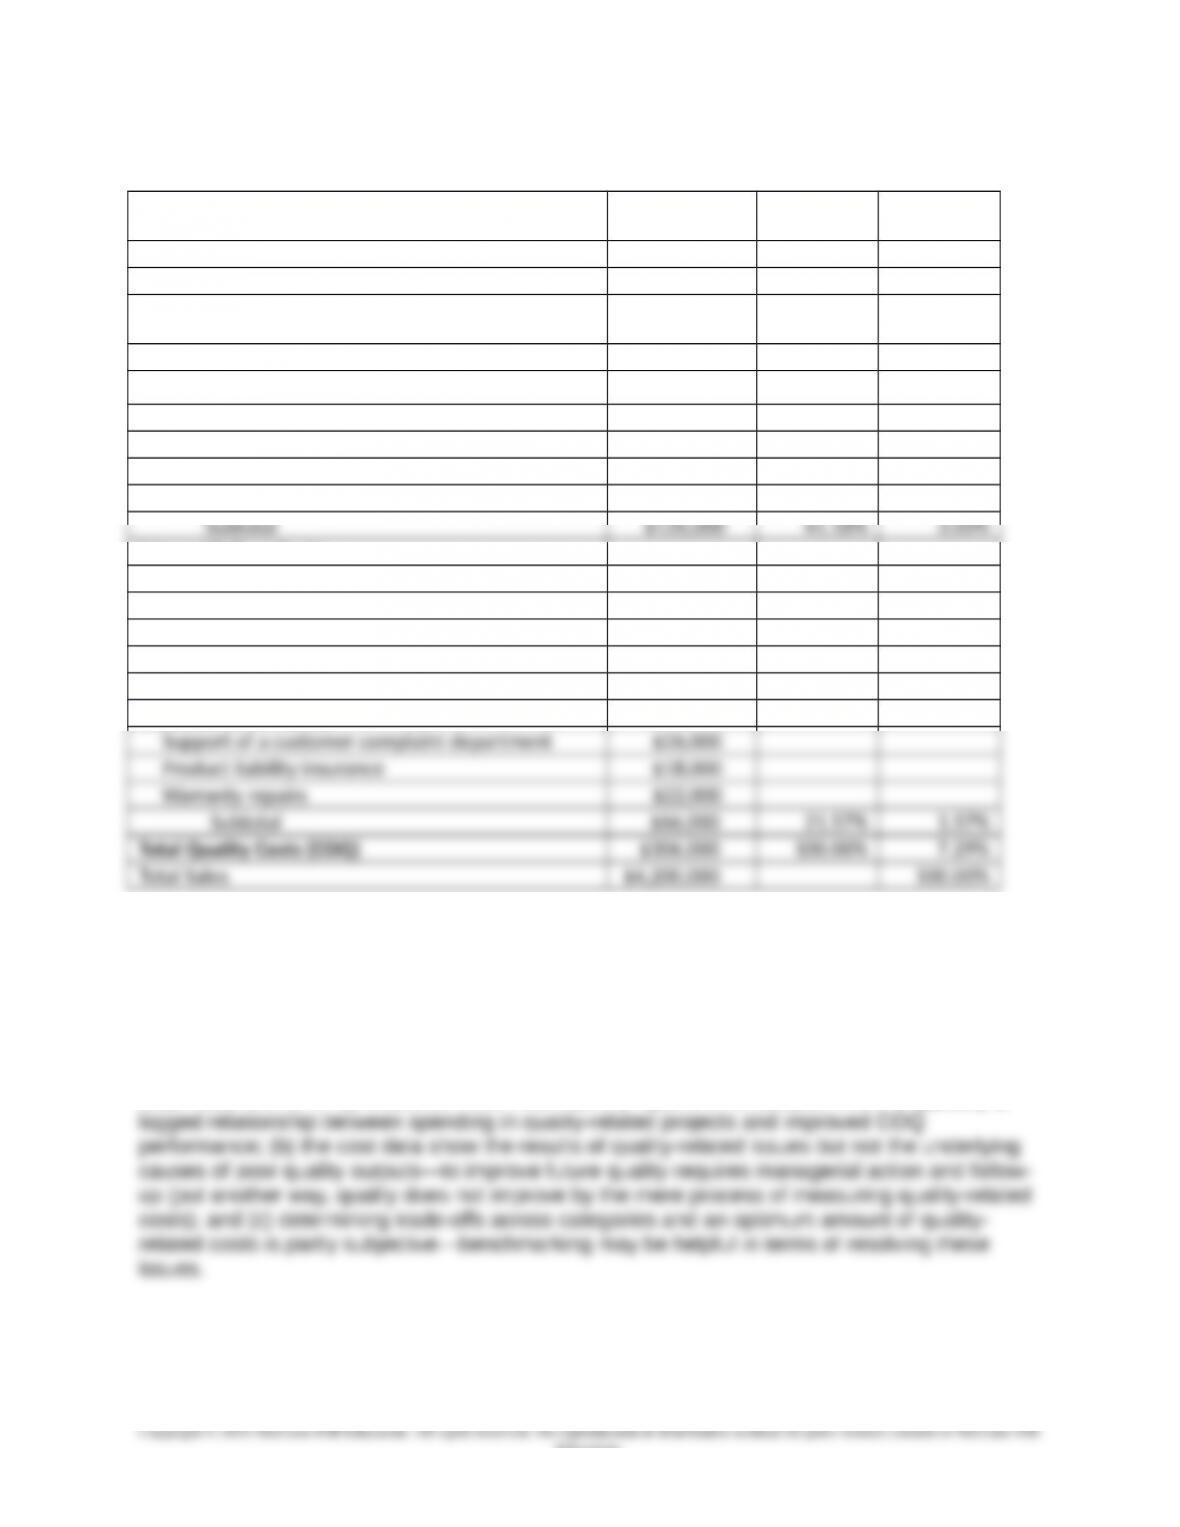
17-53 Cost of Quality (COQ) Reporting (40 minutes)
1.
$ Amount % of Total % of Sales
Prevenion Costs:
Quality training $12,000
New vendor veriicaion and faciliies inspecion $25,000
Technical support provided to vendors $ 4,000
Subtotal $41,000 13.40% 0.98%
Appraisal Costs:
Field test of new computer $74,000
Equipment inspecion $20,000
Test and inspecion of purchased parts $32,000
Internal Failure Costs:
Spoiled work-in-process inventory disposal $28,000
Downime, due to quality problems $24,000
Re-inspecion $13,000
Rework (labor and overhead) $8,000
Subtotal $73,000 23.86% 1.74%
External Failure Costs:
2. The mix between conformance costs (Prevention and Appraisal) versus nonconformance
costs (Internal Failure and External Failure) seems reasonable. As well, the total COQ as a
percentage of sales seems reasonable, or at least not significantly out of line. Benchmarking the
results of this company to a relevant standard would be desirable.
3. There are at least three primary limitations to the COQ report illustrated in the present
exercise: (a) the COQ report provides data for only a single period; time-series data (multiple
observations over time) would be more informative (in part this is because there is typically a
17-38
Education.
Chapter 17 – The Management and Control of Quality
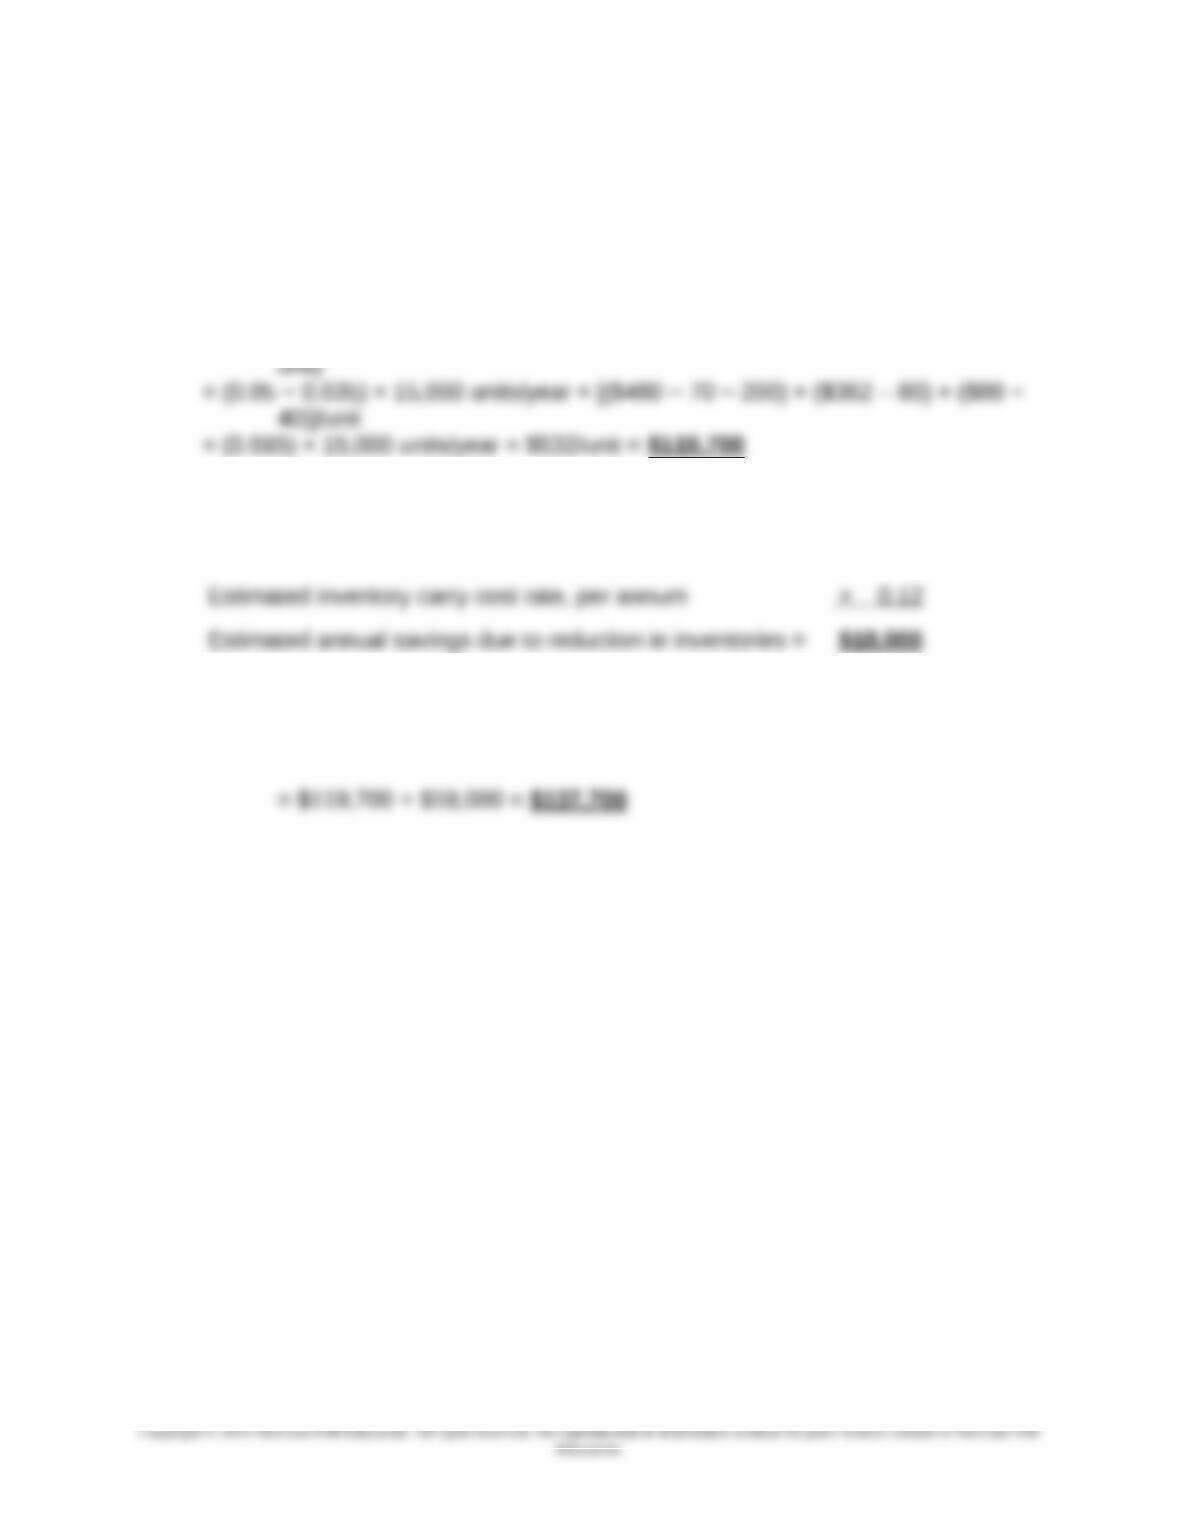
17-54 Relevant Cost Analysis—Quality Improvements (25 Minutes)
Estimated cost savings resulting from the recently enacted quality program come
from two sources:
1. Manufacturing cost savings associated with the reduction in rework costs:
= (reduction in reject rate) × (annual volume of output) × (total rework cost per
2. Financing cost savings associated with the reduction in inventory holdings:
Reduction in Inventory Holdings = $400,000 − $250,000 = $150,000
3. Total estimated savings due to quality improvement program
= rework cost savings + inventory financing cost savings
17-39
Chapter 17 – The Management and Control of Quality
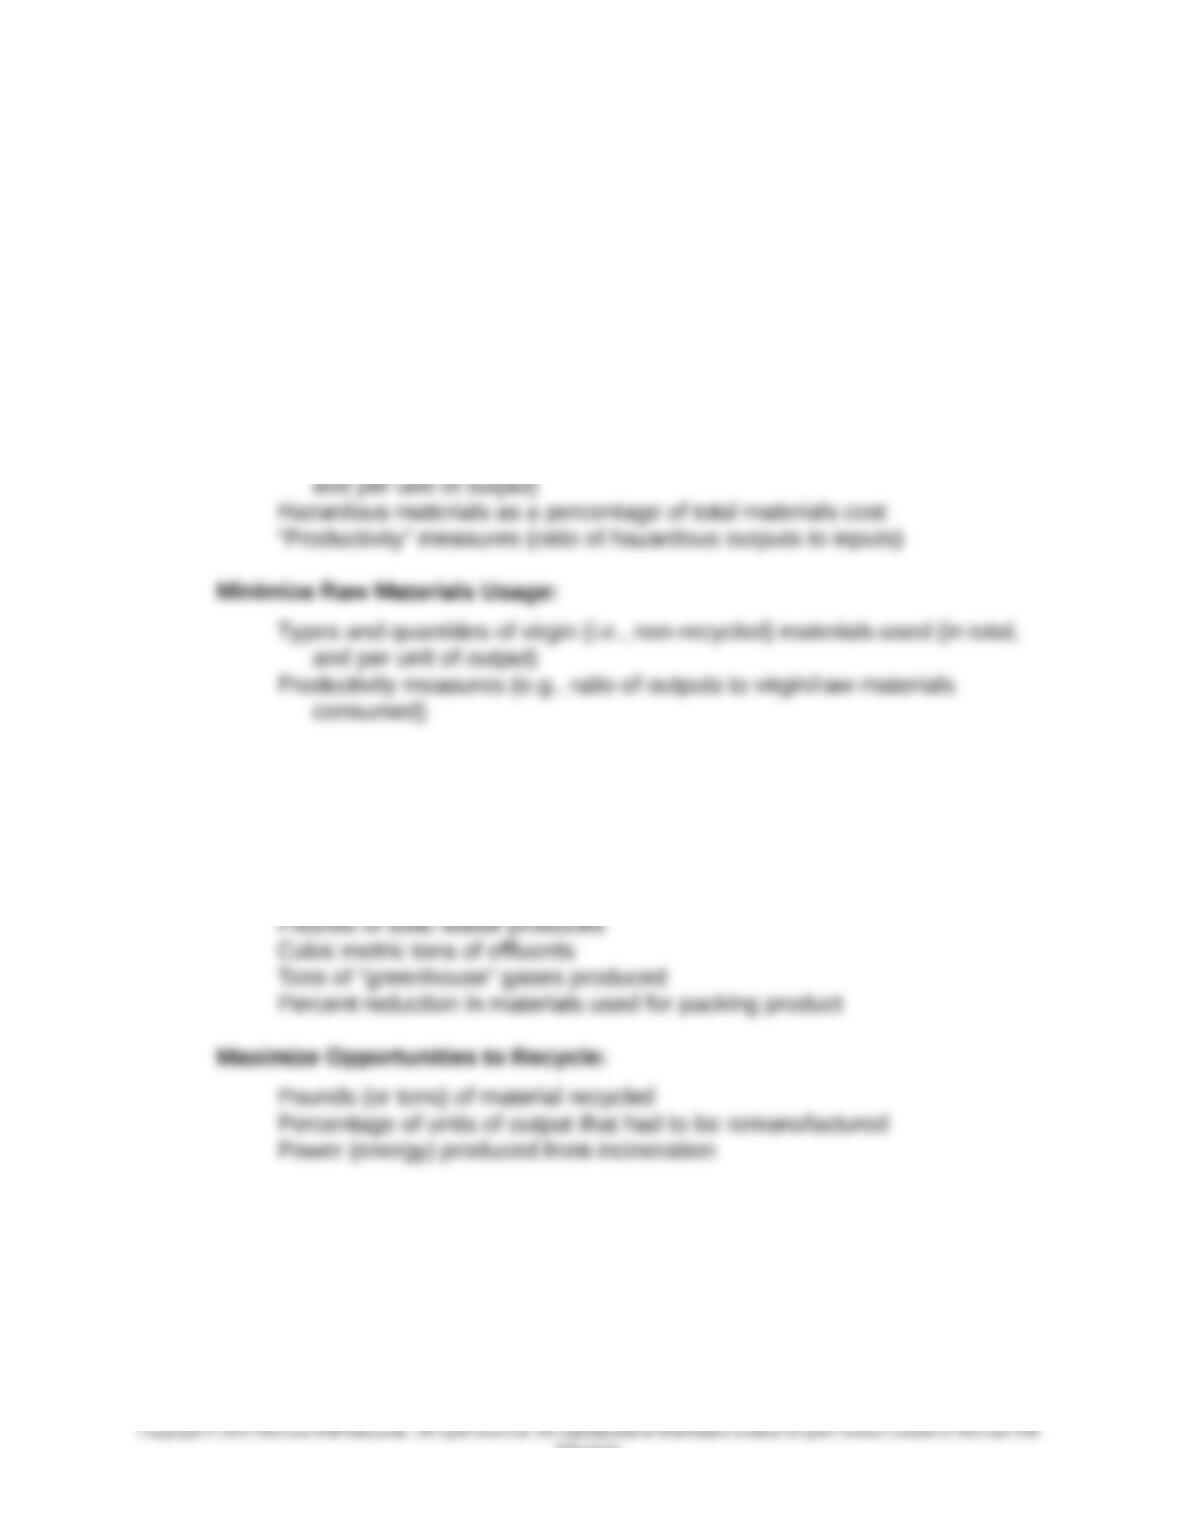
17-55 Nonfinancial (Operational) Control Measures: Environmental Performance (25
Minutes)
The purpose of this exercise is to get students to think about the process of
developing nonfinancial quality indicators, based on specified Environmental
Objectives (five in the present case). The purpose of these indicators is to gauge
progress in accomplishing the specified Environmental Objectives and, as such, to
motivate improved quality in environmental performance. The following answers are
suggestive only:
Minimize Hazardous Materials:
Types and quantities of hazardous materials produced (in total,
Minimize Energy Requirements:
Types and quantities of energy consumed
Productivity measures (energy consumption per unit produced, etc.)
Minimize Release of Residues into the Environment:
17-40
Education.
Chapter 17 – The Management and Control of Quality
17-55 (Continued-1)
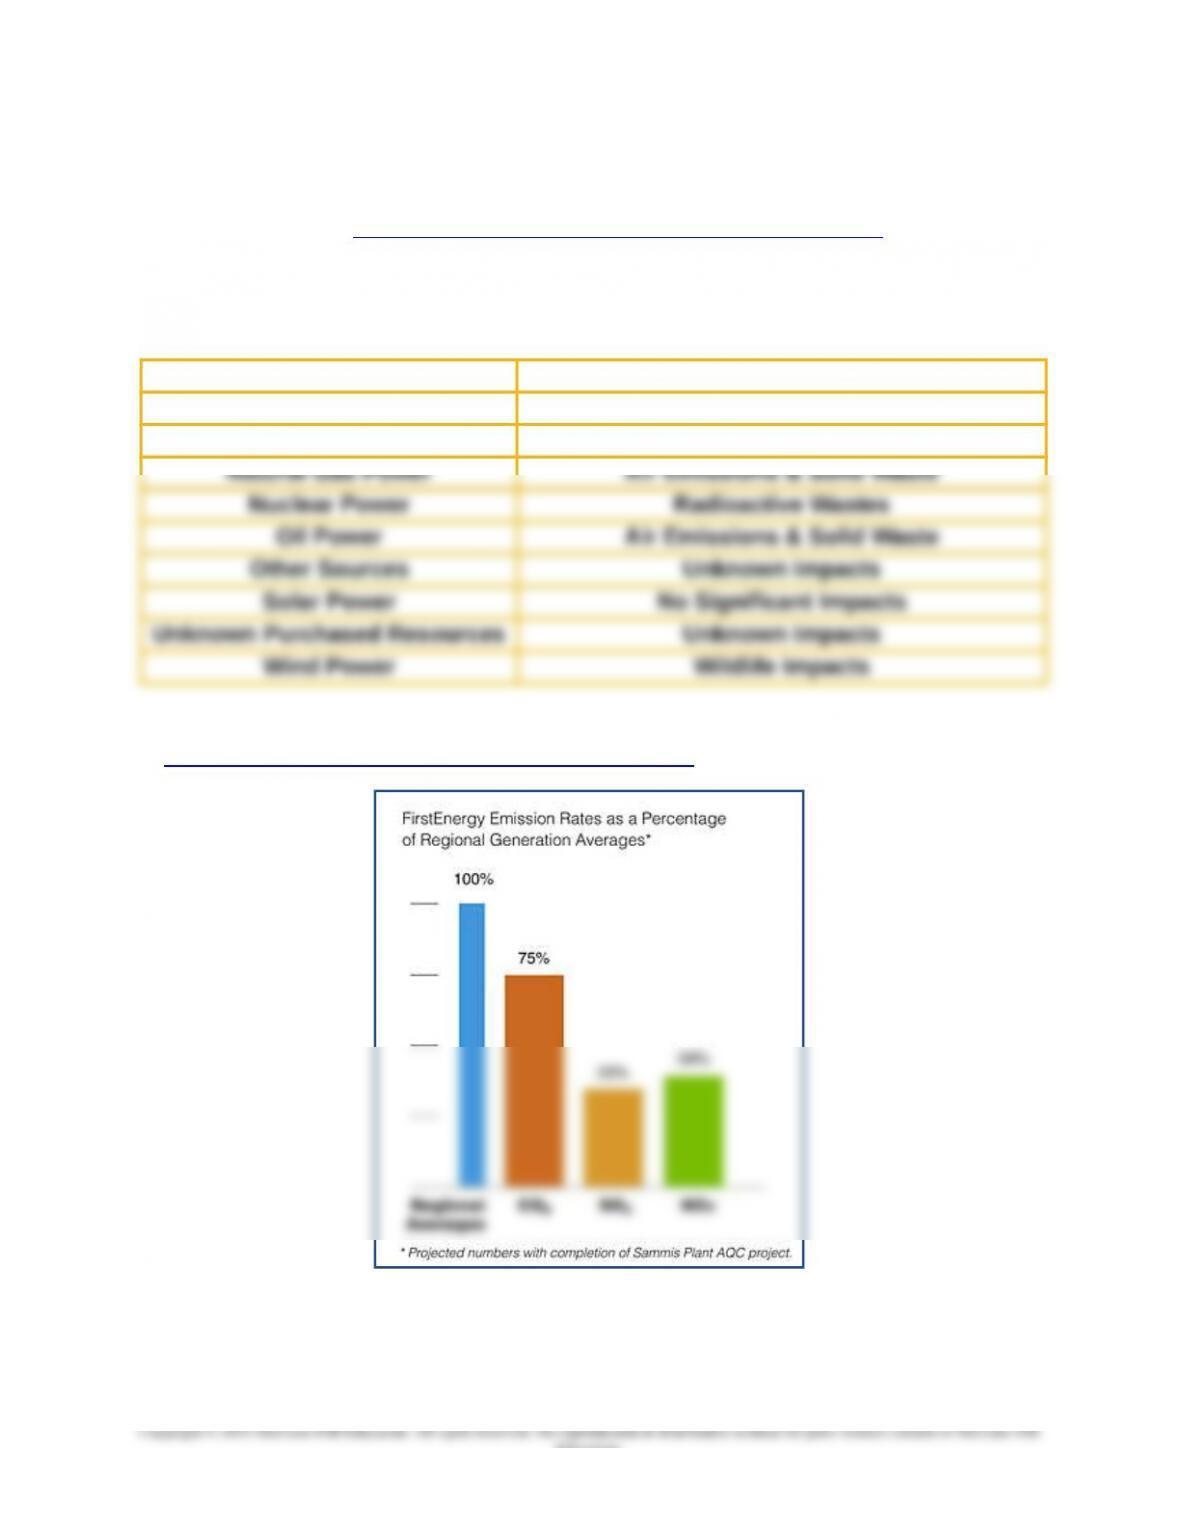
The instructor might want to use some of the following example disclosures from First
Energy Corporation (https://www.firstenergycorp.com/environmental.html) for illustrative
purposes:
Environmental Characteristics Associated with Various
Sources of Power Generation
Biomass Power Air Emissions & Solid Waste
Coal Power Air Emissions & Solid Waste
Hydro Power Wildlife Impacts
Air Emission Disclosure: First Energy Corporation, 2011
(https://www.firstenergycorp.com/environmental.html, accessed 25 November 2011)
Website updated: 08 September 2011
17-41
Education.