Chapter 16 – Operational Performance Measurement: Further Analysis of Productivity and Sales
16-57 Comparative Income Statements and Sales Performance
Variances; Current to Prior Year (25 min)
1.
16-58
Chapter 16 – Operational Performance Measurement: Further Analysis of Productivity and Sales
16-57 (continued -1)
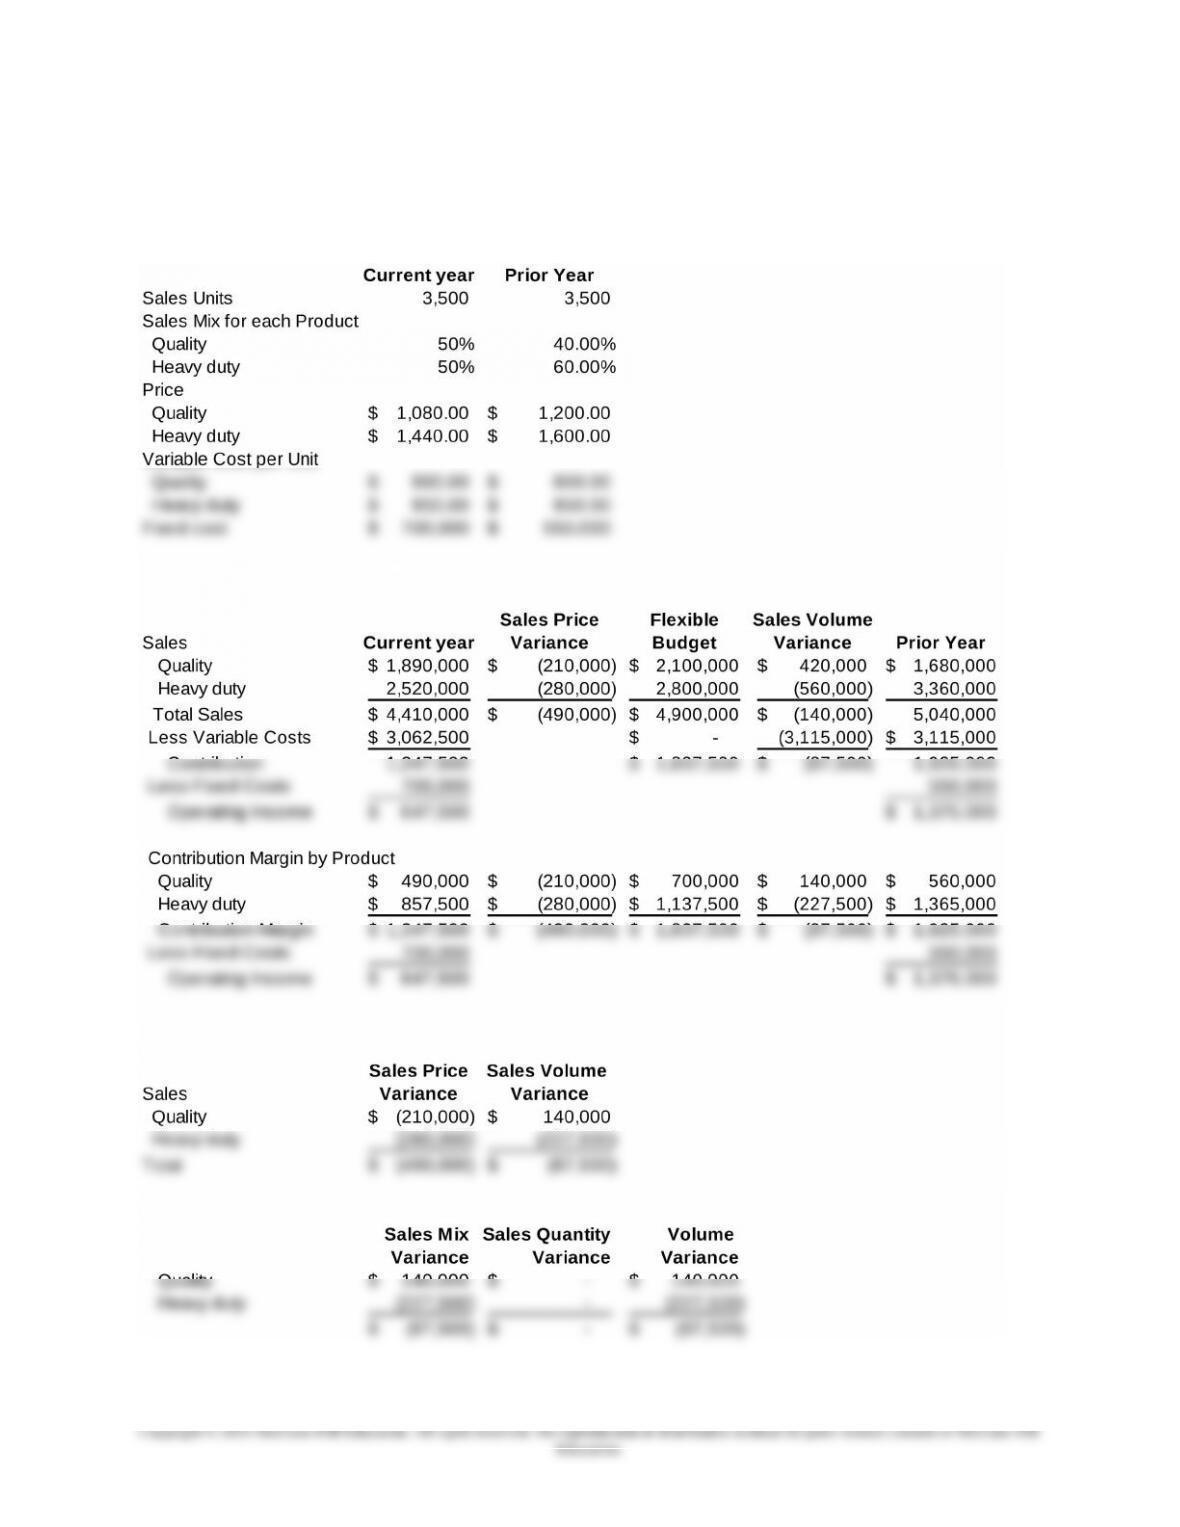
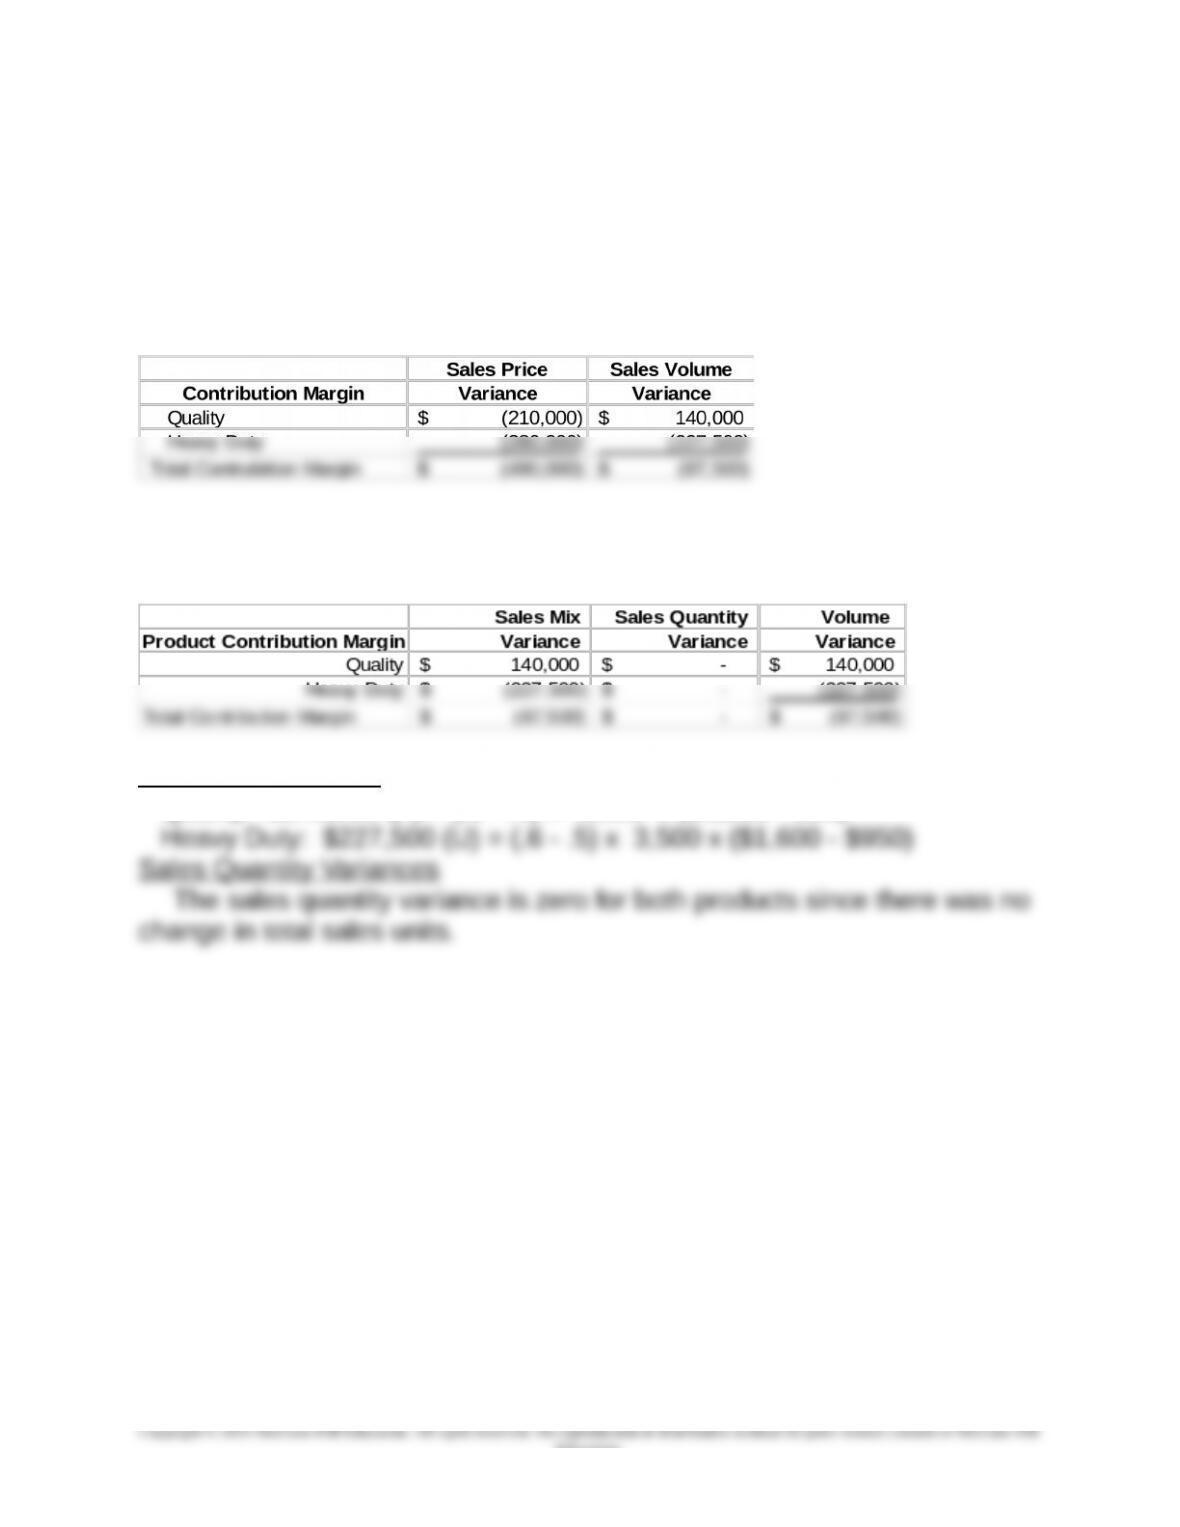
The selling price variances and volume variances based on
contribution are summarized as follows:
2. Sales mix and quantity variances
Sales Mix Variances
Quality: $140,000 (F) = (.5 – .4) x 3,500 x ($1,200 – 800)
16-59
Education.
Chapter 16 – Operational Performance Measurement: Further Analysis of Productivity and Sales
16-57 (continued -2)
3.
As expected, there were significant losses reflected in the large selling
price variances, a total unfavorable variance of $490,000. There was a
large unfavorable volume variance as well, an unfavorable variance of
$87,500, which is due entirely to the change in product mix, since there
was no change in sales quantity. Note that the volume variance is a
combination of the mix and quantity variances. There was a favorable mix
variance for the Quality product of $140,000 due to its increase from 40%
to 50% of total sales. However, there was also an unfavorable mix
16-60
Education.
Chapter 16 – Operational Performance Measurement: Further Analysis of Productivity and Sales
16-57 (continued -3)
4.
The decrease in operating income from $1,375,000 to $647,500 from the
prior to the current year is a major concern. As indicated in the problem,
the firm is starting to study ways to reduce variable costs for the coming
year. A useful way to start this planning is to use target costing and
continuous improvement, as explained in chapter 13. Target costing looks
at ways to redesign the product or manufacturing process to reduce
Another approach would be to use the productivity analyses introduced in
this chapter to determine financial and operational partial productivity
measures for the key manufacturing cost factors, and to monitor these
measures to seek improvement.
Another approach a student might suggest is to use ABC costing to better
($550,000/3,500 = $157.14 per unit).
Finally, standard costing and the flexible budget as explained in chapter 14
would be an approach to consider. Standard costing sets standard usage
and prices for the key manufacturing inputs, and determines variances from
these inputs. The six variable cost variances are usage and price for
materials, usage and rate for labor, and usage and spending variances for
variable overhead.
16-61
Education.
Chapter 16 – Operational Performance Measurement: Further Analysis of Productivity and Sales
16-58 Sales and Variable Cost Variances; Current to Prior Year; Review
of Chapter 14 (30 min)
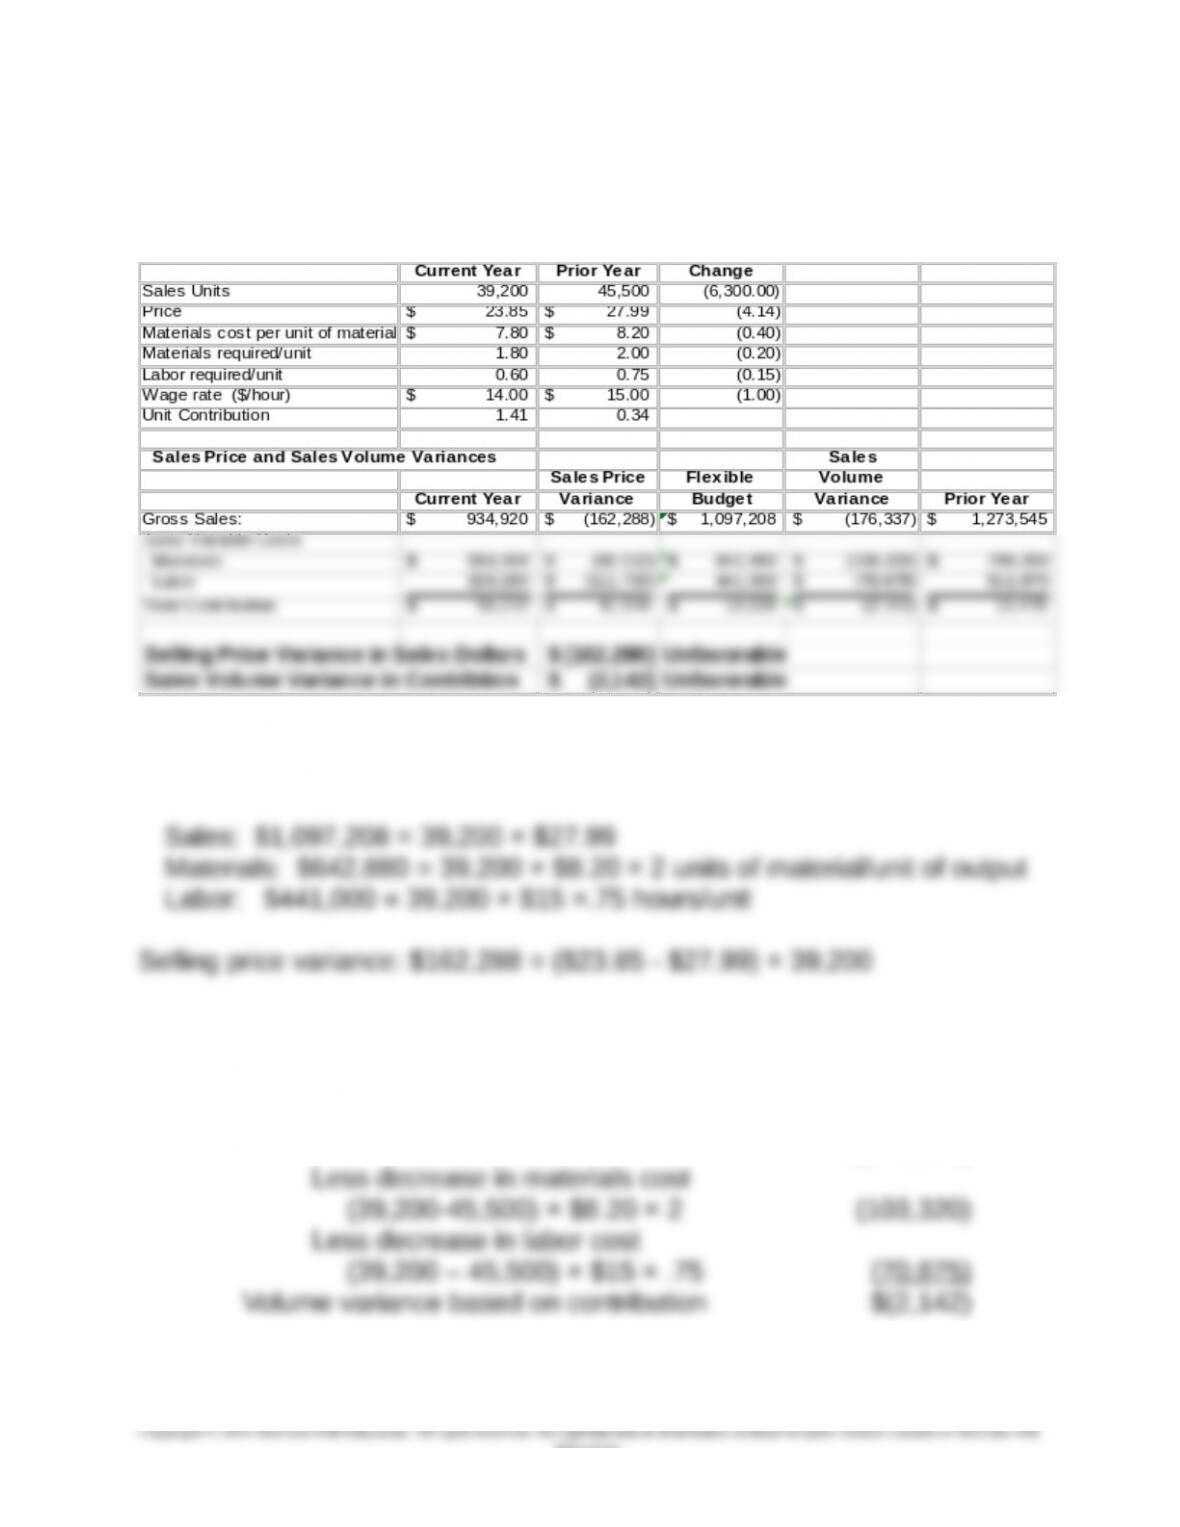
1.
The flexible budget, the center column, is determined as follows:
Current sales at prior year prices and unit variable costs
Volume Variance
Based on sales dollars: ($176,337) = (39,200-45,500) × $27.99
Based on contribution:
= $(176,337)
16-58 (continued -1)
16-62
Education.
Chapter 16 – Operational Performance Measurement: Further Analysis of Productivity and Sales
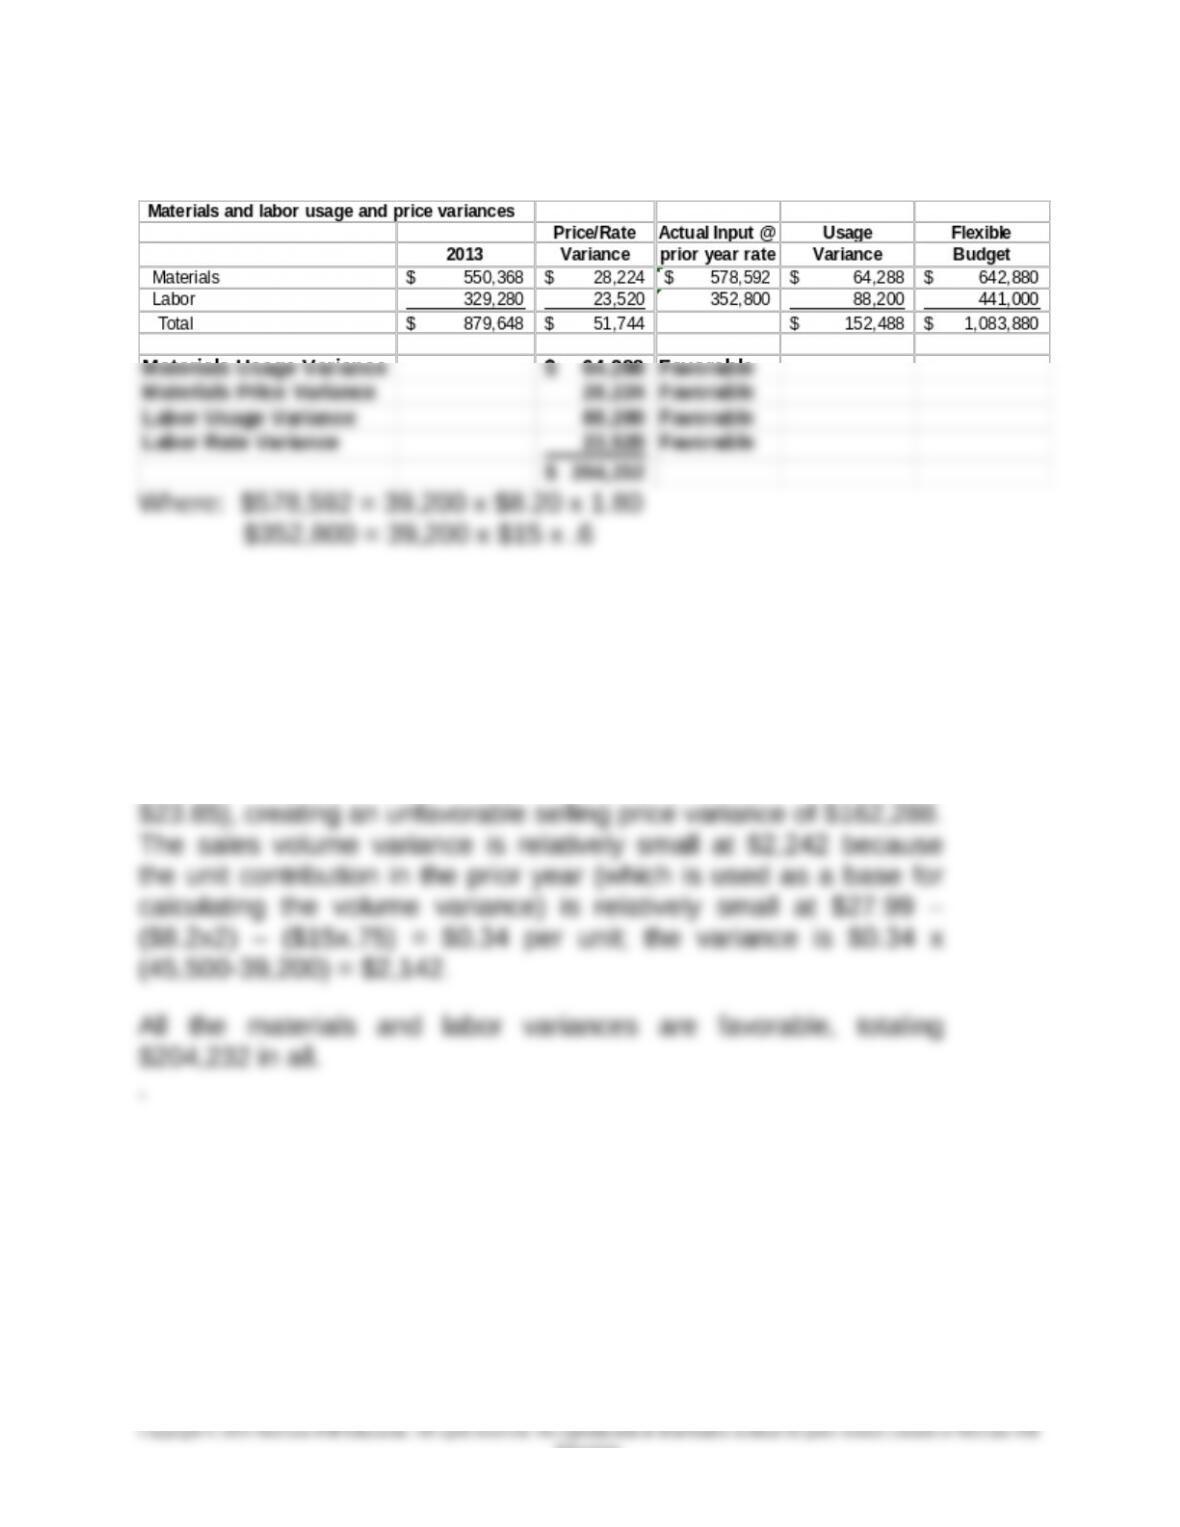
2.
3.
The analysis above shows that RJM has succeeded in returning to
profitability, despite the falling sales and sales prices. RJM has
accomplished this through reductions in materials price and usage
and reductions in labor rate and usage. The single strongest effect
on the company was the $4.14 drop in price (from $27.99 to
16-63
Education.