Chapter 16 – Operational Performance Measurement: Further Analysis of Productivity and Sales
16-45 Partial Operational and Financial Productivity; Total
Productivity (30 min)
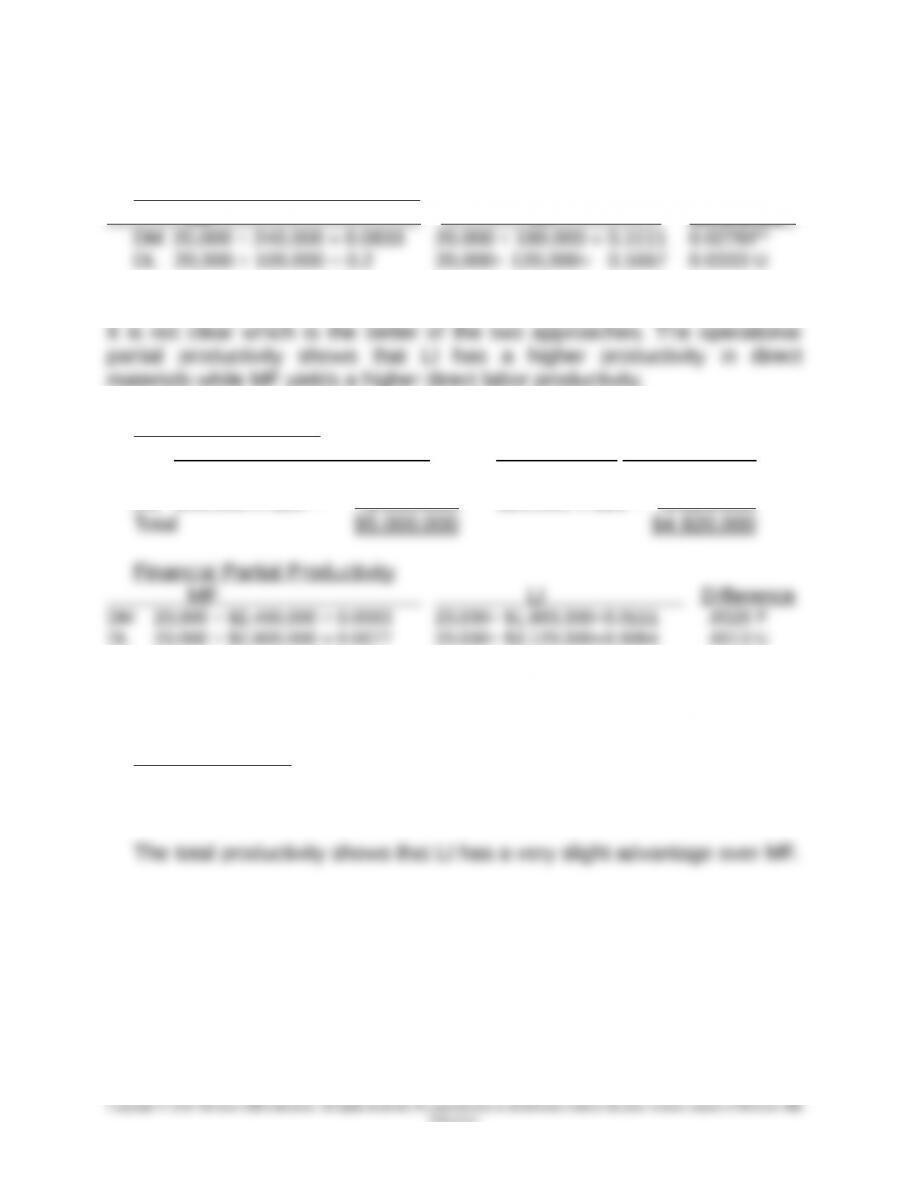
1. Operational Partial Productivity
MF LI Difference
* The direction of variances denotes the advantage of LI over MF.
materials while MF yields a higher direct labor productivity.
2. Manufacturing Cost
MF LI
DM 240,000 x $ 10 = $2,400,000 180,000 x $10 = $1,800,000
DL 100,000 x $26 = 2,600,000 120,000 x $26 = 3,120,000
The financial partial productivity also shows mixed results. There is not a
clear advantage of one manufacturing alternative over the other.
3. Total Productivity
MF: 20,000 /$5,000,000 = 0.0040
LI: 20,000 /$4,920,000 = 0.0041
16-31
Education.
Chapter 16 – Operational Performance Measurement: Further Analysis of Productivity and Sales
16-46 Direct Labor Variances, Productivity Measures, and Standard
Costs (30 min)
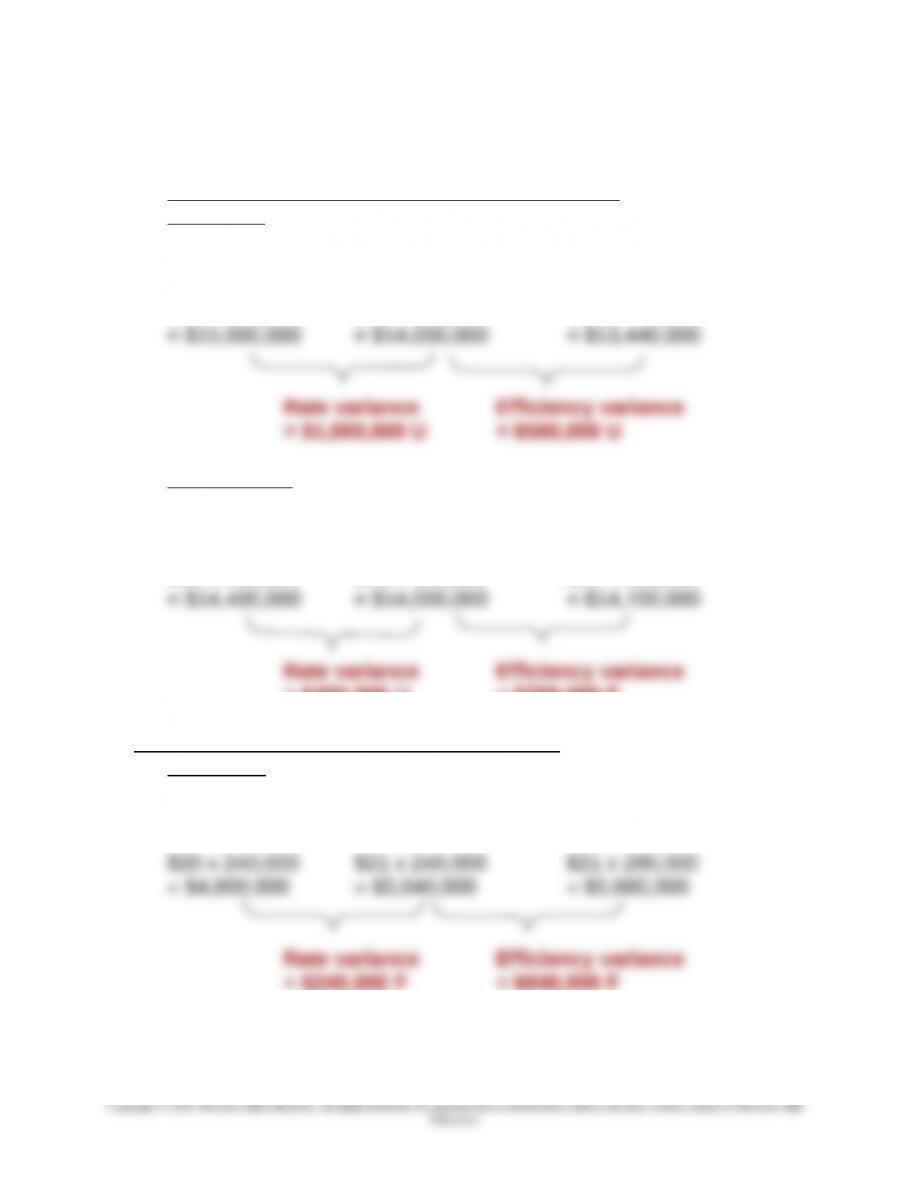
1. Assembly Department Direct Labor Variances
Prior year:
Total actual direct labor hours: 25 x 20,000 = 500,000
Total standard direct labor hours: 24 x 20,000 = 480,000
$30 x 500,000 $28 x 500,000 $28 x 480,000
Current Year:
Total actual direct labor hours: 20 x 20,000 = 400,000
Total standard direct labor hours: 21 x 20,000 = 420,000
$36 x 400,000 $35 x 400,000 $35 x 420,000
= $400,000 U = $700,000 F
Testing Department Direct Labor Variances
Prior Year:
Total actual direct labor hours: 12 x 20,000 = 240,000
Total standard direct labor hours: 14 x 20,000 = 280,000
16-32
Chapter 16 – Operational Performance Measurement: Further Analysis of Productivity and Sales
16-46 (continued -1)
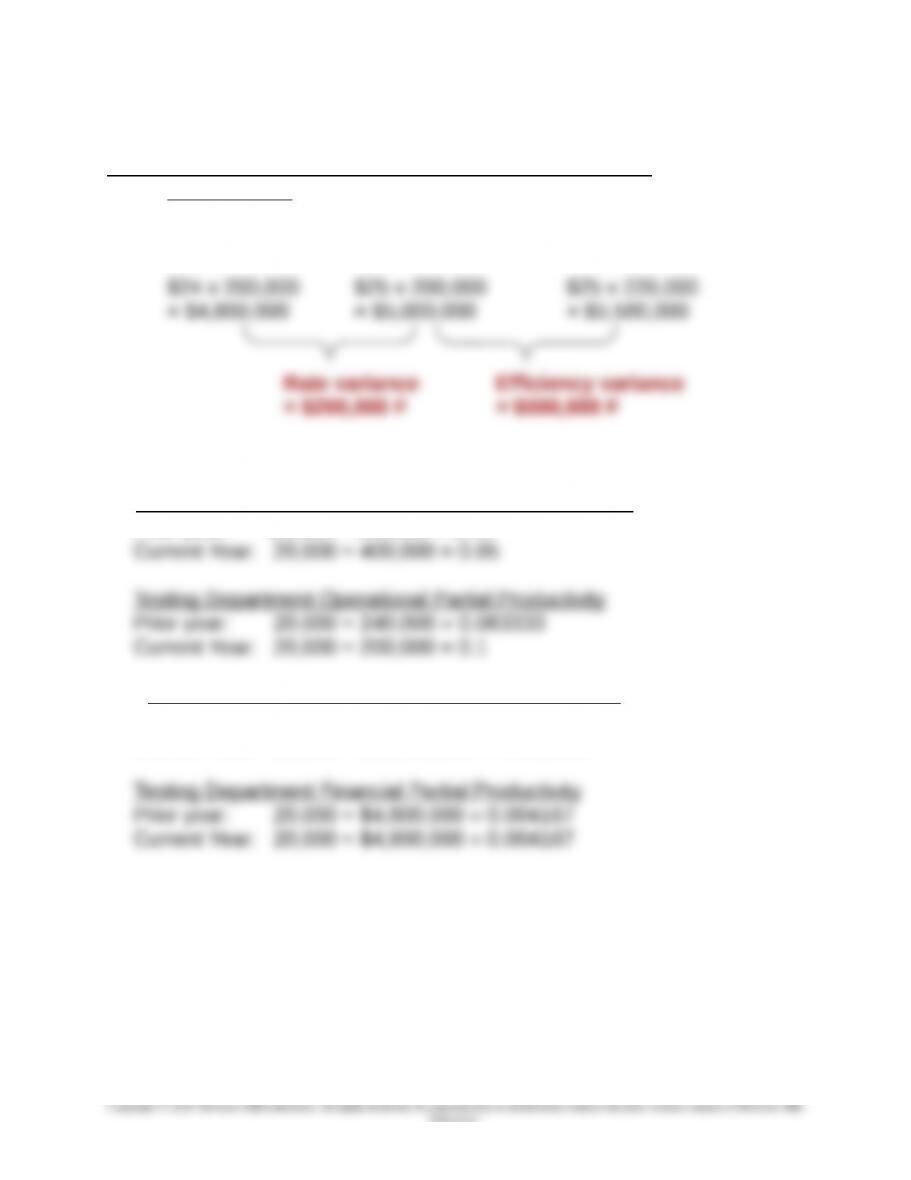
Testing Department Direct Labor Variances (continued)
Current Year:
Total actual direct labor hours: 10 x 20,000 = 200,000
Total standard direct labor hours: 11 x 20,000 = 220,000
2. Assembly Department Operational Partial Productivity
Prior year: 20,000 ÷ 500,000 = 0.04
3. Assembly Department Financial Partial Productivity
Prior year: 20,000 ÷ $15,000,000 = 0.001333
Current Year: 20,000 ÷ $14,400,000 = 0.001389
16-33
Education.
Chapter 16 – Operational Performance Measurement: Further Analysis of Productivity and Sales
16-46 (continued -2)
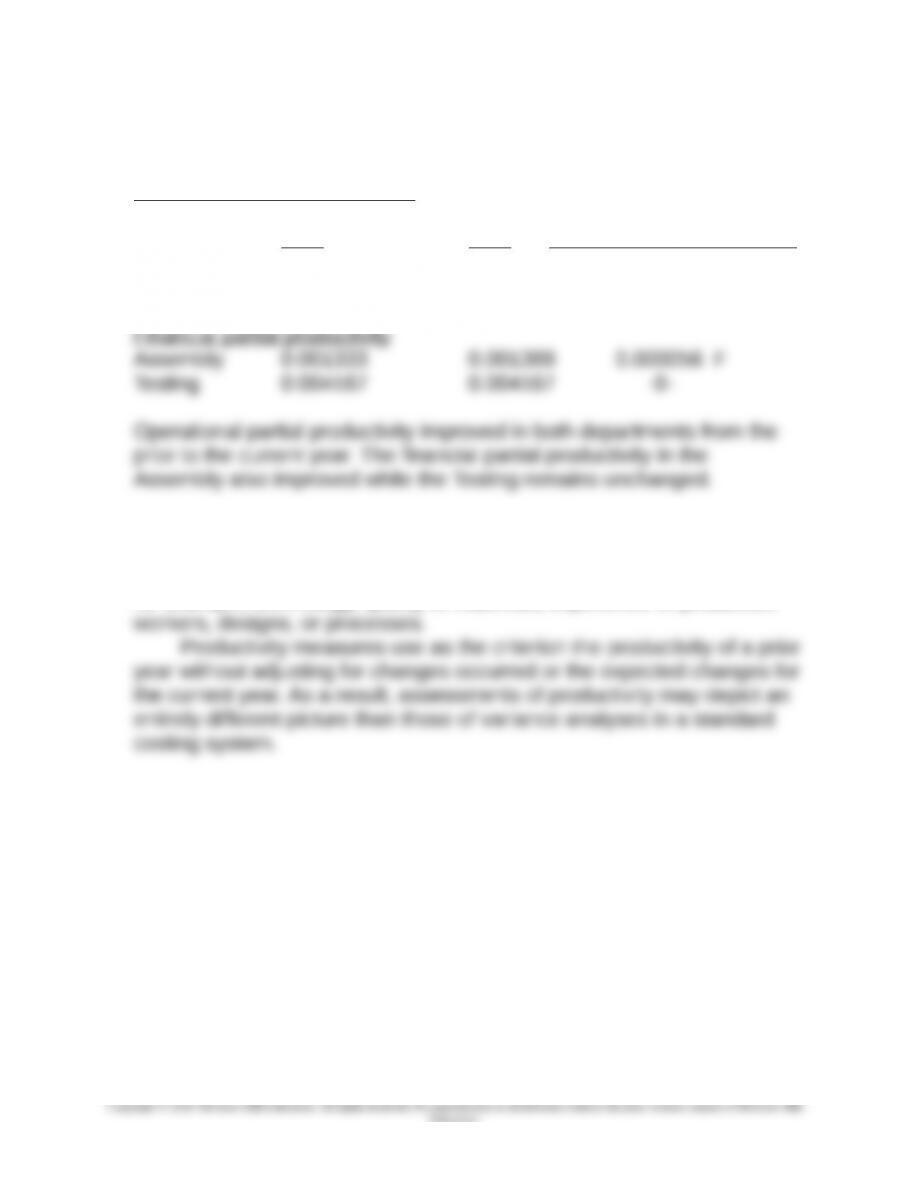
4. Recap:
Operational partial productivity
Prior Current
Year Year Change
Assembly 0.04 0.05 0.01 F
Testing 0.083333 0.1 0.016667 F
5. The standards in a standard costing system often are determined
independently and incorporate changes in operating factors. The
standard for the operation of a year may change because of changes in,
for example, technology, quality of materials, experience of production
16-34
Education.
Chapter 16 – Operational Performance Measurement: Further Analysis of Productivity and Sales
16-47 Productivity and Market Share in the Auto Industry; Internet
Exercise (20 min)
1.
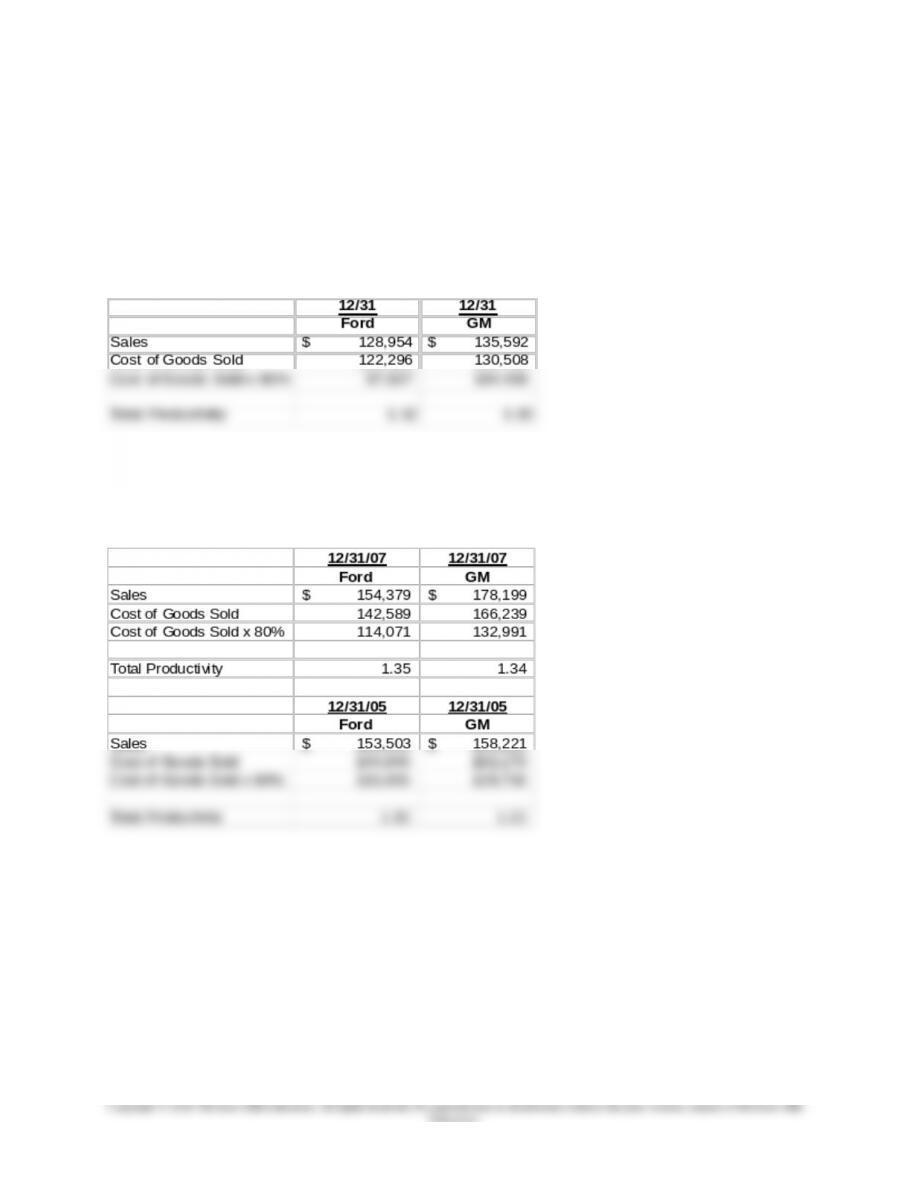
The total productivity for the auto makers is shown below for the given
data. Also, while not required, the results for 2007 and 2005 are also
shown for comparison.
For contrast, the productivity calculations for the two companies in 2007
and 2005 are as follows:
The objective of this question is to make the students aware that total
productivity can be at least approximated for a company the student is
interested in by obtaining basic financial data from the firm’s annual report.
16-35
Education.
Chapter 16 – Operational Performance Measurement: Further Analysis of Productivity and Sales
16-47 (continued -1)
Note there are no significant differences between the auto makers or
between the productivity measures for the three years. Note that this is in
contrast to the Harbour Report data on auto firm productivity in 2008, cited
in Problem 16-35, which reports an increase in productivity (measured as
labor hours per vehicle) for Ford. The two measures of productivity do not
measure the same thing, so that these differences arise.
While the measures computed here are limited by the amount of
information available, they can provide a starting point for looking at other
measures of performance, and looking for more detailed information about
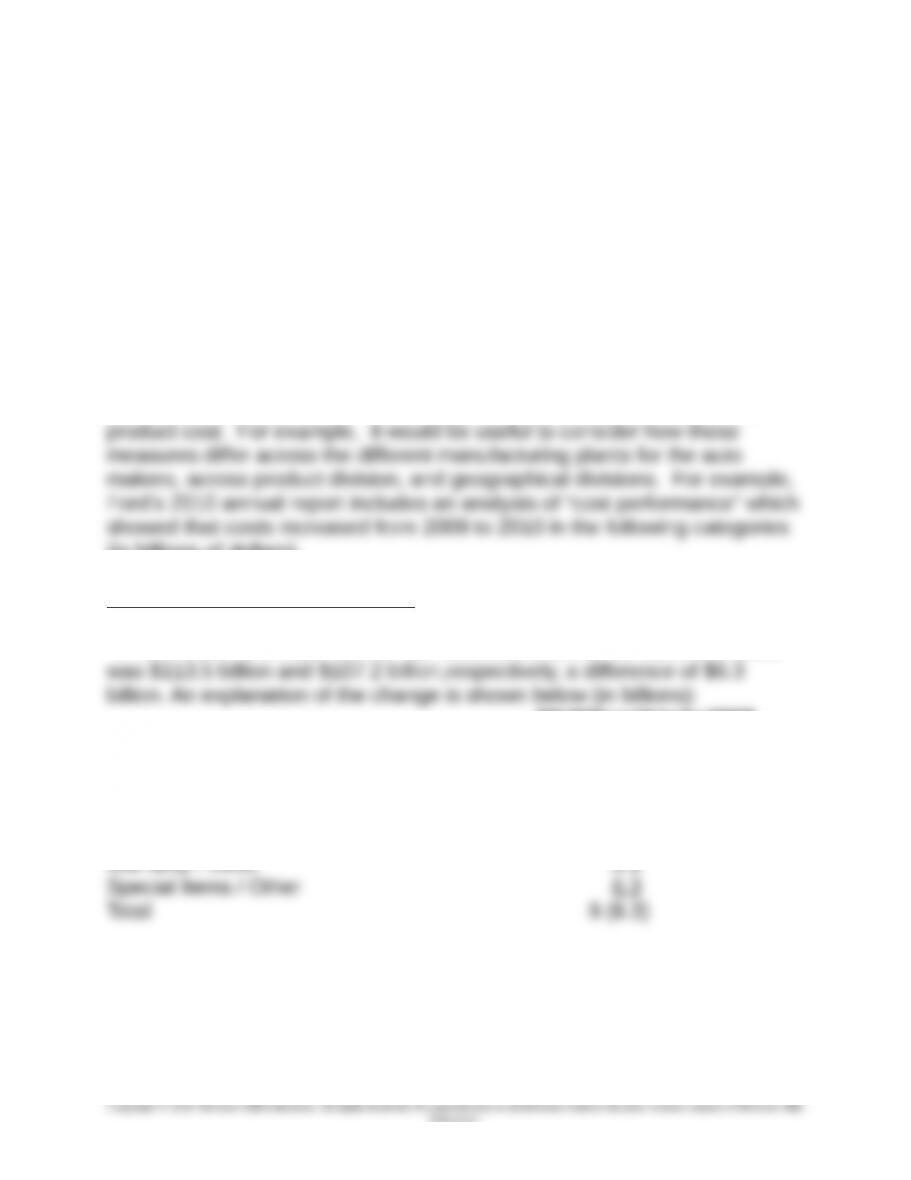
(in billions of dollars).
From Ford’s 2010 Annual Report:
“…Total costs and expenses for our Automotive sector for 2010 and 2009
2010(Over)/Under2009
Explanation of Change:
Volume and Mix, and Exchange (11.6)
Material Costs Excluding Commodity Costs 1.1
Commodity Costs (1.0)
Structural Costs (1.2)
Warranty / Other 0.1
16-36
Education.
Chapter 16 – Operational Performance Measurement: Further Analysis of Productivity and Sales
16-47 (continued -2)
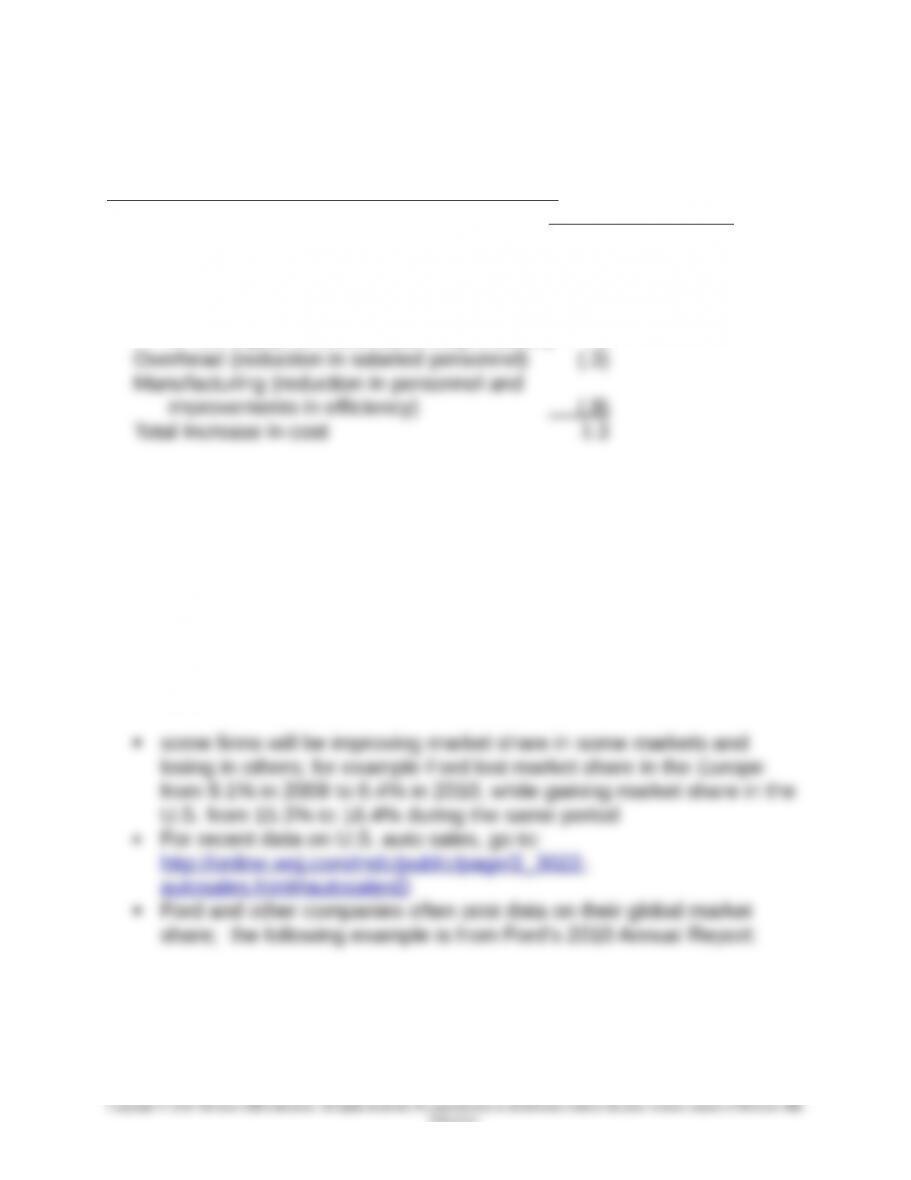
Ford’s 2005 Annual Report has a similar analysis
Increase (decrease)
Supplier related cost $1
Pension and health care .8
Warranty costs .4
Depreciation and amortization (investments
in new equipment and faster depreciation) .3
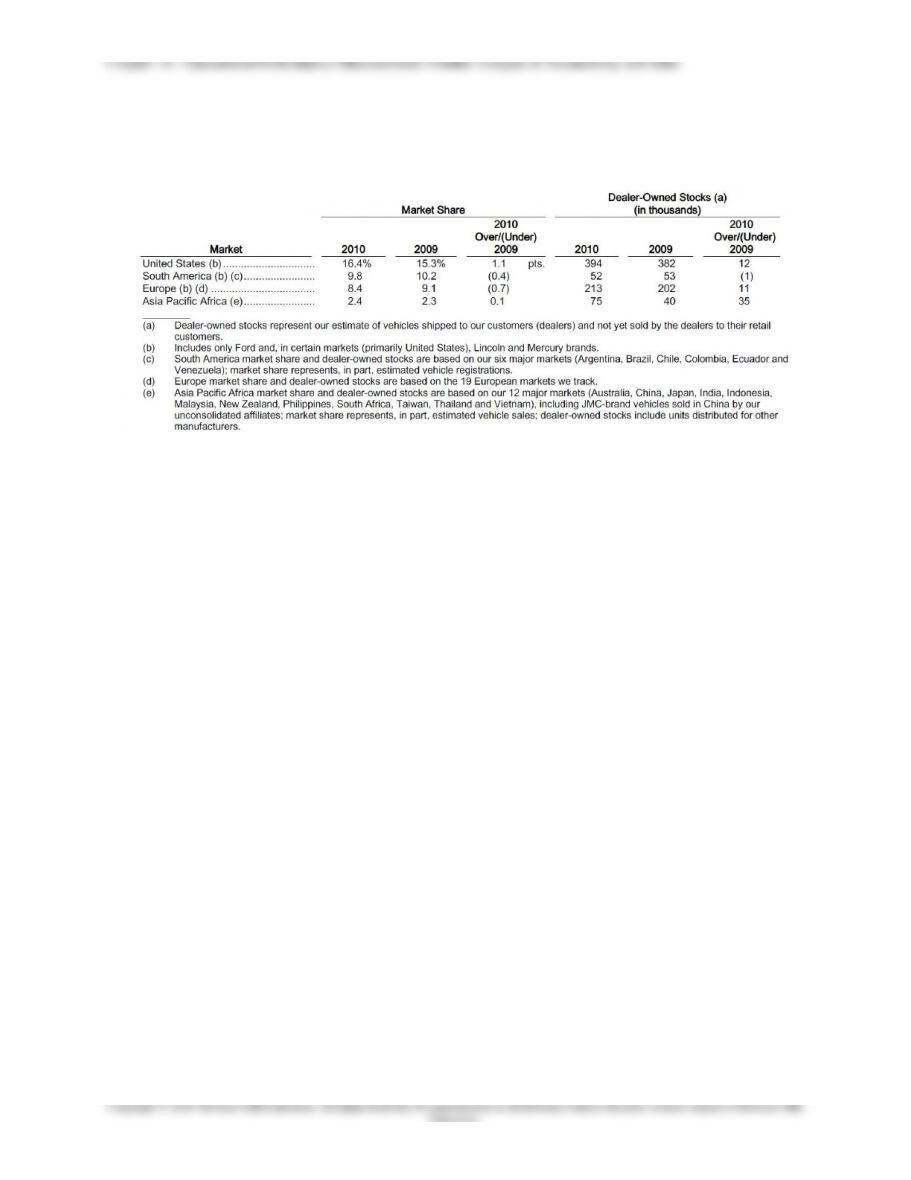
2. This requirement can be assigned for class discussion, and answers will
likely vary, depending on what portion of the financial statement is used
and which year’s annual report is used. The discussion here can focus on
some of the following (all these points are based on the 2010, 2007 and
2005 annual reports of GM and Ford)
Alternatively, the instructor can assign requirement 1 only, and then discuss
some of the observations about requirement 2, as noted below.
16-37
Education.
16-47 (continued -3)
16-38
Education.
Chapter 16 – Operational Performance Measurement: Further Analysis of Productivity and Sales
16-48 Productivity and Ethics (15 min)
1. The operational partial productivity deteriorates slightly from 0.0051 in
the prior year (500÷99,000) to 0.005 in the current year (560÷112,000).
2. Tomas should not follow the order without following a consistent
accounting method. If the firm believes that certain cost items should be
16-39
Education.
Chapter 16 – Operational Performance Measurement: Further Analysis of Productivity and Sales
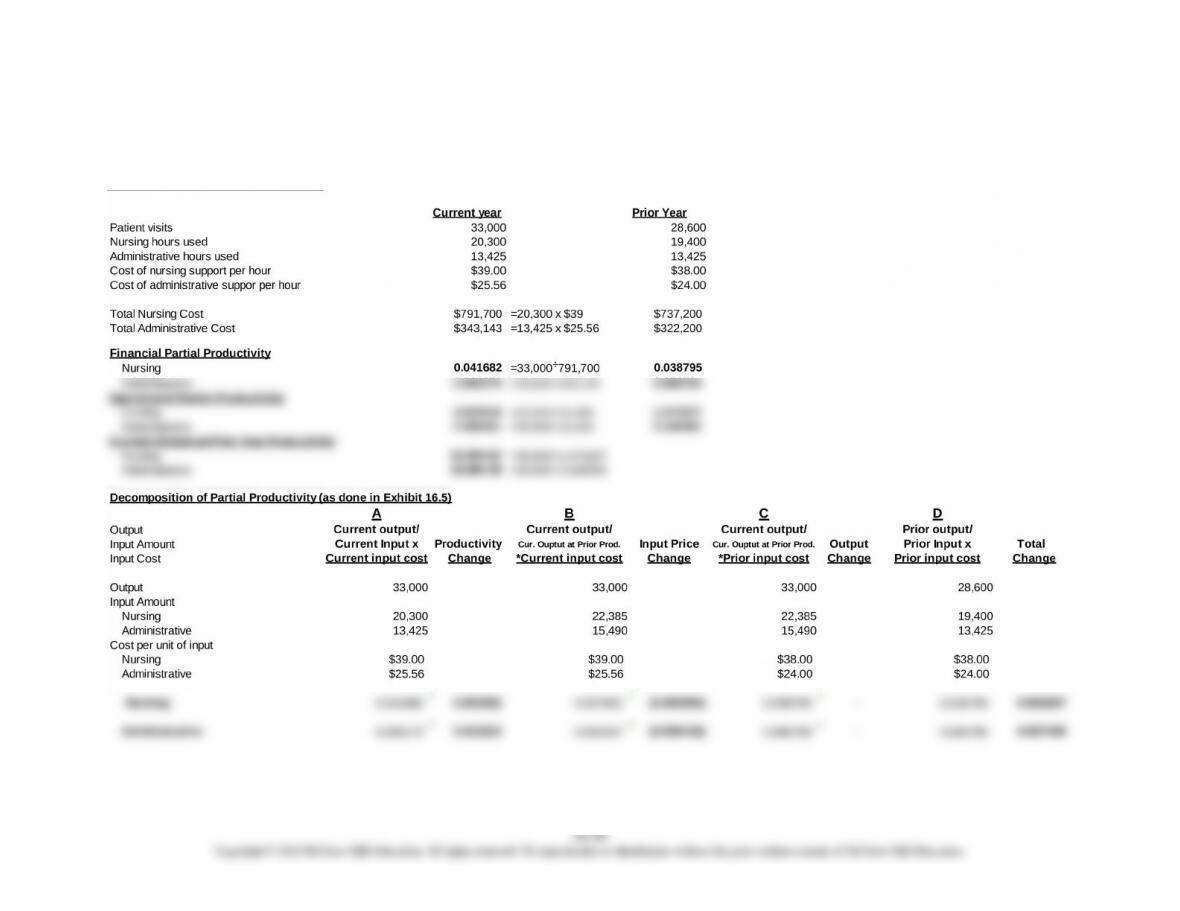
16-49 Partial Operational and Financial Productivity; Medical Practice (45 min)
1.,2. Partial operational and financial productivity and separation of partial financial productivity: