Chapter 16 – Operational Performance Measurement: Further Analysis of Productivity and Sales
CHAPTER 16:
OPERATIONAL PERFORMANCE MEASUREMENT: FURTHER
ANALYSIS OF PRODUCTIVITY AND SALES
QUESTIONS
16-1 Productivity is the ratio of output to input. It is a measure of the amount of output
16-2 To be a successful low cost provider in its industry a firm needs to be able to
manufacture the product using fewer resources – materials, labors, or other
16-3 Two of the most often used criteria for assessing productivity and their
advantages and disadvantages are:
1. Prior year’s productivity
Advantages:
Disadvantages:
Difficult to assess adequacy of productivity improvements
2. Best performance of the industry or practice
Advantages:
Uses of the best practice in the industry or anywhere as the benchmark. A
Disadvantages:
The standard might be too high and can be frustrating to workers.
16-4 Operational productivity is the conversion ratio of an input resource to the output.
16-1
Education.
16-5 Partial productivity is a productivity measure that focuses only on the relationship
between the amount of one input and the output attained. Both the input
(denominator) and the output (numerator) can be either in unit or in dollar
16-6 Financial productivity contains more information only in the sense that it
facilitates comparisons of different resources.
A financial productivity, however, can be confusing or less useful to production
departments because it includes the cost of resources in computing productivity.
16-7 To say that a total productivity measure encompasses all partial productivity
measures is a misnomer. A total productivity measure may not examine the same
partial productivity measures for the same operation.
16-8 The primary purpose of calculating productivity is to improve the operation.
Improvements on high-value-added activities decrease costs of the activities
16-9 Manufacturing personnel often prefer operational productivity measures to
financial productivity measures because data for computing operational
productivity measures are either results of activities of the operating department
of manufacturing functions.
16-10 Measurements of productivity help managers to improve operations of both JIT
and non-JIT firms. However, a JIT firm is more likely to have less low-value-
16-11 (b). (a) is false because a higher productivity would be reflected by a higher, not
lower, partial productivity ratio. (c) is false because an operational partial
16-2
Education.
Chapter 16 – Operational Performance Measurement: Further Analysis of Productivity and Sales
16-12 Measures for assessing marketing effectiveness include market share, market
16-13 The components of sales variance include selling price and sales volume
variances. A sales volume variance is the total of sales quantity and sales mix
16-14 A selling price variance measures the effects of deviations in actual selling prices
from the budgeted selling prices on operating results, including effects on
contribution margins and operating income. A sales volume variance measures
from the budgeted units of the product in the master budget of the period.
16-15 A sales volume variance is the difference between the flexible budget for the
units sold during a period and the budgeted units in the master budget of the
period. For a firm with multiple products the sales volume variance can be the
result of both sales mix and sales quantity variances. The sales volume variance
also is the sales quantity variance for a firm with only a single product.
16-16 This statement is not always true. A multi-product firm can still have an
unfavorable sales volume variance even if it sold more units than the budgeted
amount. The firm can have an unfavorable sales volume variance if it sells more
16-17 Selling price and sales volume variances are the two major components that
account for the difference between the total sales of a period and the total sales
16-18 A market size variance measures the effect of changes in the size of a product’s
total market on a firm’s total contribution margin or operating income. A market
16-3
Education.
Chapter 16 – Operational Performance Measurement: Further Analysis of Productivity and Sales
16-19 A firm benefits from a favorable sales quantity variance only if there are no
adverse changes in selling prices or sales mix variances. A favorable sales
quantity variance may not be beneficial to the firm if the firm lowered its selling
prices or sold more of low-priced, low-margin and less of high-priced, high-
margin products.
An increase in the total market size often leads to a favorable sales
quantity variance. Strategically, the favorable sales quantity variance may not be
favorable to the firm if the firm has an unfavorable market share variance.
However, a firm can have a favorable market size variance and an
Relationships between a market share variance and a sales quantity
variance can be in either direction. A firm can have a favorable sales quantity
variance and an unfavorable market share variance when the increase in the
share variance when the decrease in the total number of units was less than the
decrease in the total market.
16-20 A sales volume variance can be divided into sales quantity and sales mix
16-21 A firm can increase its earnings through reducing expenses, even if it sold fewer
16-4
Education.
Chapter 16 – Operational Performance Measurement: Further Analysis of Productivity and Sales
BRIEF EXERCISES
16-22
a.
Operational Partial Productivity = Actual Production ÷ Actual Input
16-23
16-24
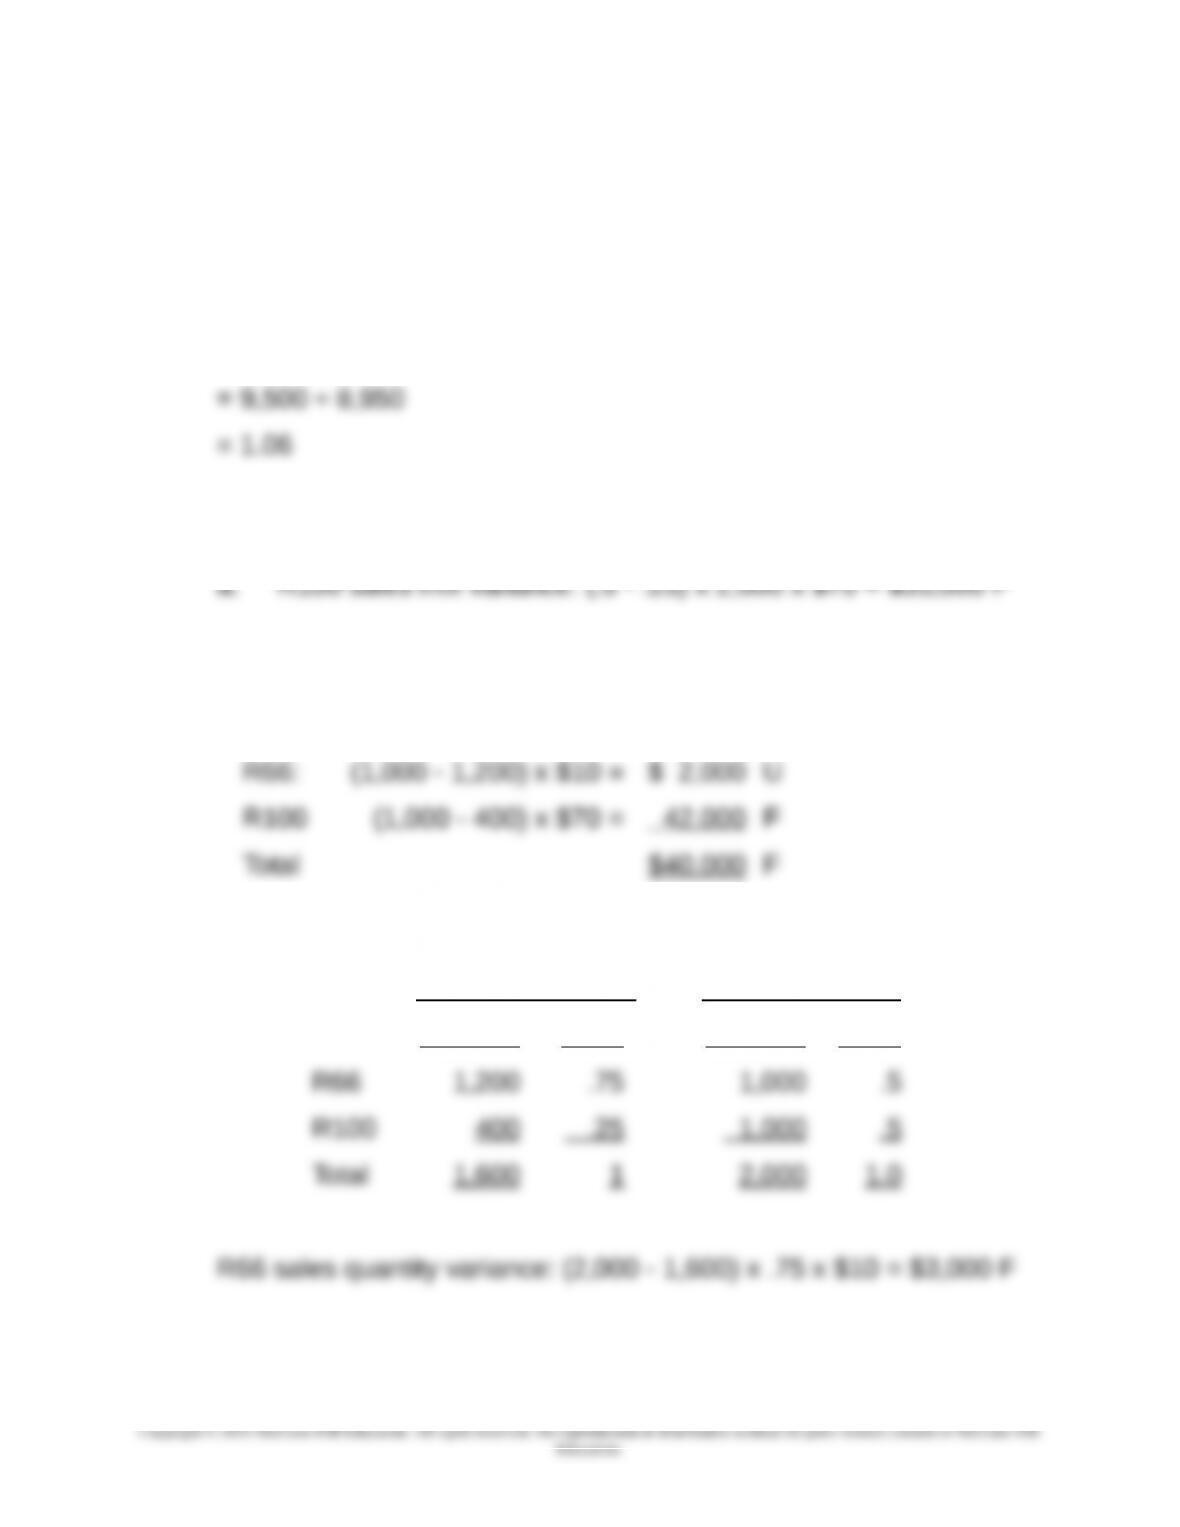
a. Total sales volume variance:
16-25
a. First, calculate the Sales Mix Ratios:
Budget Actual
Quantity Ratio Quantity Ratio
16-5
Chapter 16 – Operational Performance Measurement: Further Analysis of Productivity and Sales
16-26
$85,000 F
16-27
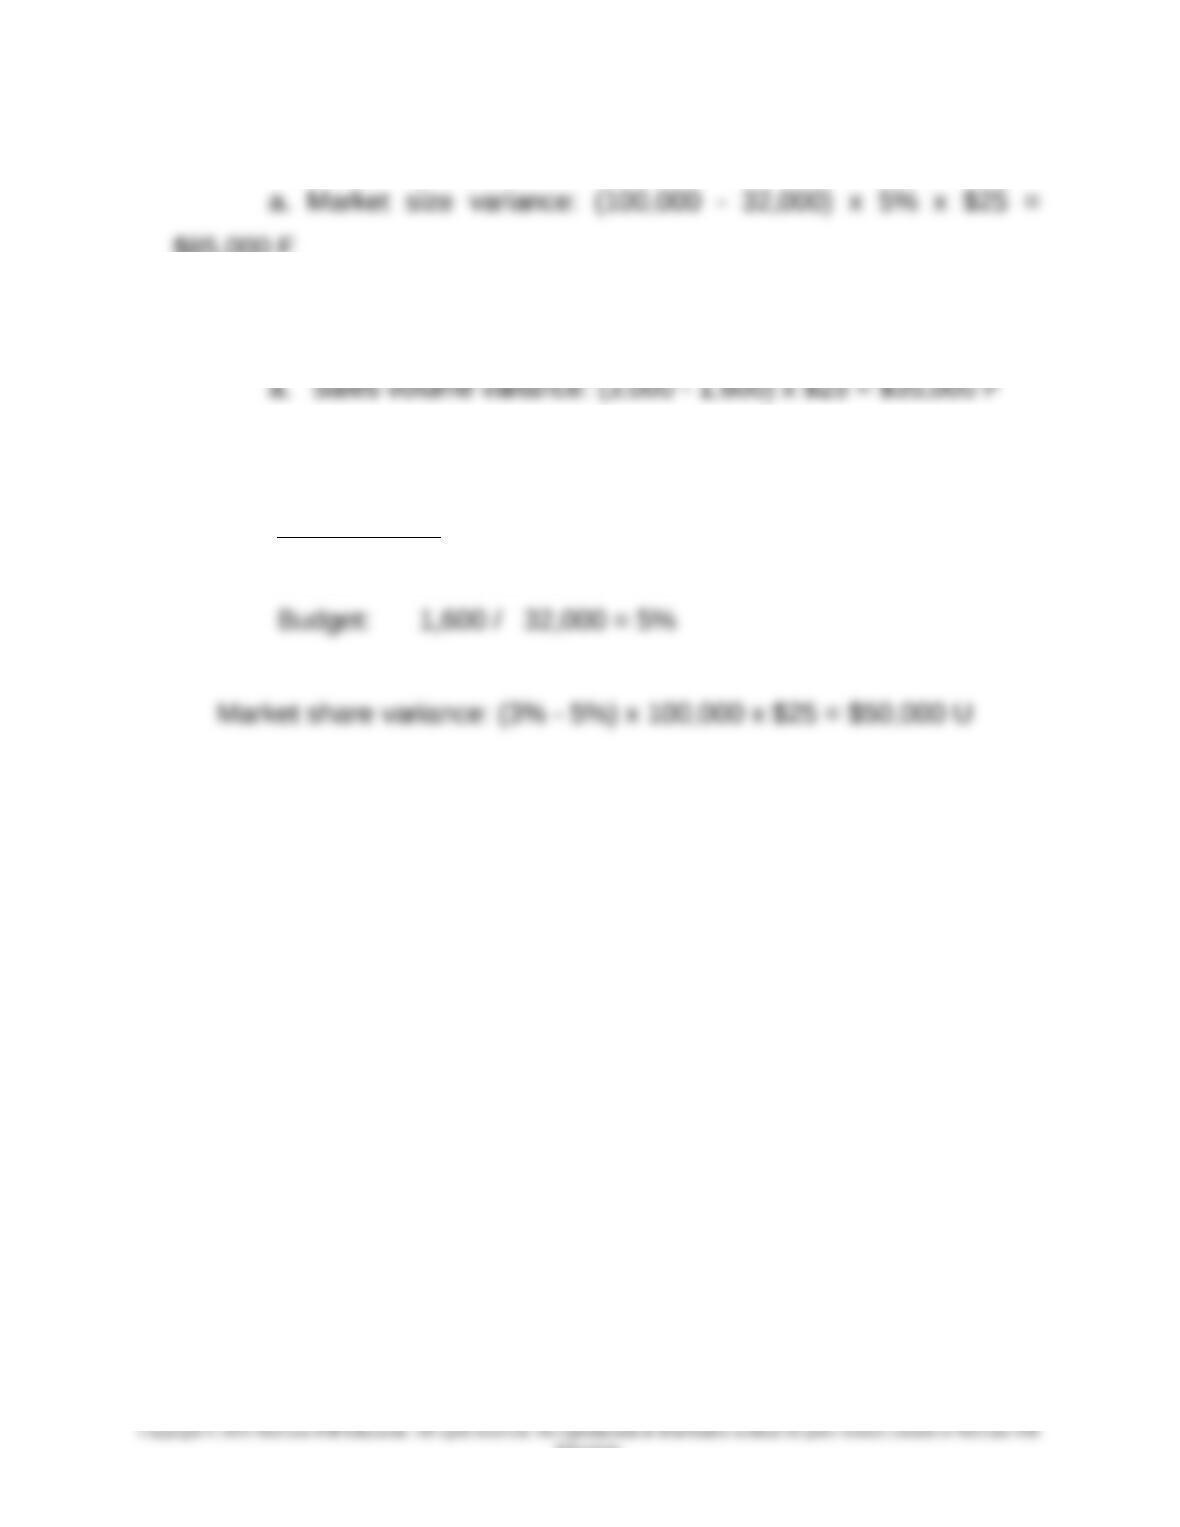
16-28
a.
Market share:
Actual: 3,000 / 100,000 = 3%
16-6
Education.
EXERCISES
16-29 Productivity and Strategy; Manufacturing (15 min)
1. The companies mentioned in the exercise (Harley-Davidson,
General Electric, Texas Instruments, and Coca-Cola) have different
competitive strategies: some are differentiators and others are cost
leaders. In each case, the workforce reductions were intended to
improve profits. The important question is how the workforce
reductions will affect the long-term competitiveness of each of the
companies. For example, Harley-Davidson’s management believes
that it is preparing for a long-term decline in sales, and that the
reduction in capacity is needed to match the future demand. This is
an appropriate response for the projected sales decline. Harley can
highly-experienced workforce will be hard to replace in a short
amount of time.
The same strategic issues face General Electric (GE) and
Texas Instruments (TI). For both companies, it is critical to project
long-term demand accurately. General Electric, like Harley, has
product lines that require highly-skilled labor, such as the GE unit that
manufactures aircraft engines. In contrast, the highly automated
manufacturing plants at Texas Instruments means that workforce
16-7
Education.
16-29 (continued -1)
2. The companies’ main focus is to maintain and improve profits,
through workforce reductions. These reductions are likely to improve
productivity, at least in the short run, as the cuts in labor costs must
be larger than the decline in output in order to improve profits.
Whether or not the productivity gains can be maintained depends on
Source: Kate Lindebaugh, “Lean Companies Ready to Cut,” The Wall
Street Journal, October 24, 2011, p. B1; Scott Thurm and Joe Light,
“Propelling the Profit Comeback,” The Wall Street Journal, October 3,
2010; Nelson D. Schwartz, ”Industries Find Surging Profits in Deeper
Cuts,” The New York Times, July 25, 2010.
16-8
Education.
Chapter 16 – Operational Performance Measurement: Further Analysis of Productivity and Sales
16-30 Productivity; Sustainability (15 min)
1. UPS succeeds by having on-time delivery of packages worldwide.
On-time performance is essential for competitive success, while cost
control in the delivery process is key to profitability. To achieve cost
control, UPS uses a variety of techniques including GPS software for
drivers to avoid left turns (because they take longer and use more
Overall, this means a more efficient and reliable fleet of trucks.
2. The telematics system not only allows for fuel savings (25 gallons per
truck per year) but it also makes it possible for UPS to promptly
correct any problems with a truck’s emission controls. On balance,
Source: “Squeezing More Green Out of Brown,”
BloombergBusinessweek, September 20, 2010, p. 43.
16-9
Education.
Chapter 16 – Operational Performance Measurement: Further Analysis of Productivity and Sales
16-31 Productivity and Quality Improvement in Retail (15 min)
This exercise introduces the contrast between productivity and quality, the
latter a topic covered in the following chapter, chapter 17. See also 16-35.
The question is intended for class discussion, to prompt some thinking
about the nature of productivity, quality, efficiency and similar terms. How
do productivity and quality differ?
The discussion can take many directions, but some key points should be
pointed out:
1. Productivity as described in this chapter is a measure of output to
input, and thus fits very well a manufacturing context. It can also be
applied to service and retail contexts if the output is properly defined.
For example, a productivity measure for a retailer might be sales per
2. Lean manufacturing, also explained in chapter 17 along with quality
improvement, is another means of reducing waste, improving
efficiency, with the likely effect that productivity improves. If the
3. Toyota and the Toyota Production System (TPS) described at the
beginning of this chapter are often referred to as leaders in lean
manufacturing and quality improvement. While TPS was developed
Source: “The Six Sigma Black Belts are Back,” Business Week,
September 21, 2009, p. 64-65.
16-10
Education.