Chapter 15 – Operational Performance Measurement: Indirect-Cost Variances and Resource-Capacity Management
15-51 Decision-Making under Uncertainty (Appendix) (30-40 minutes)
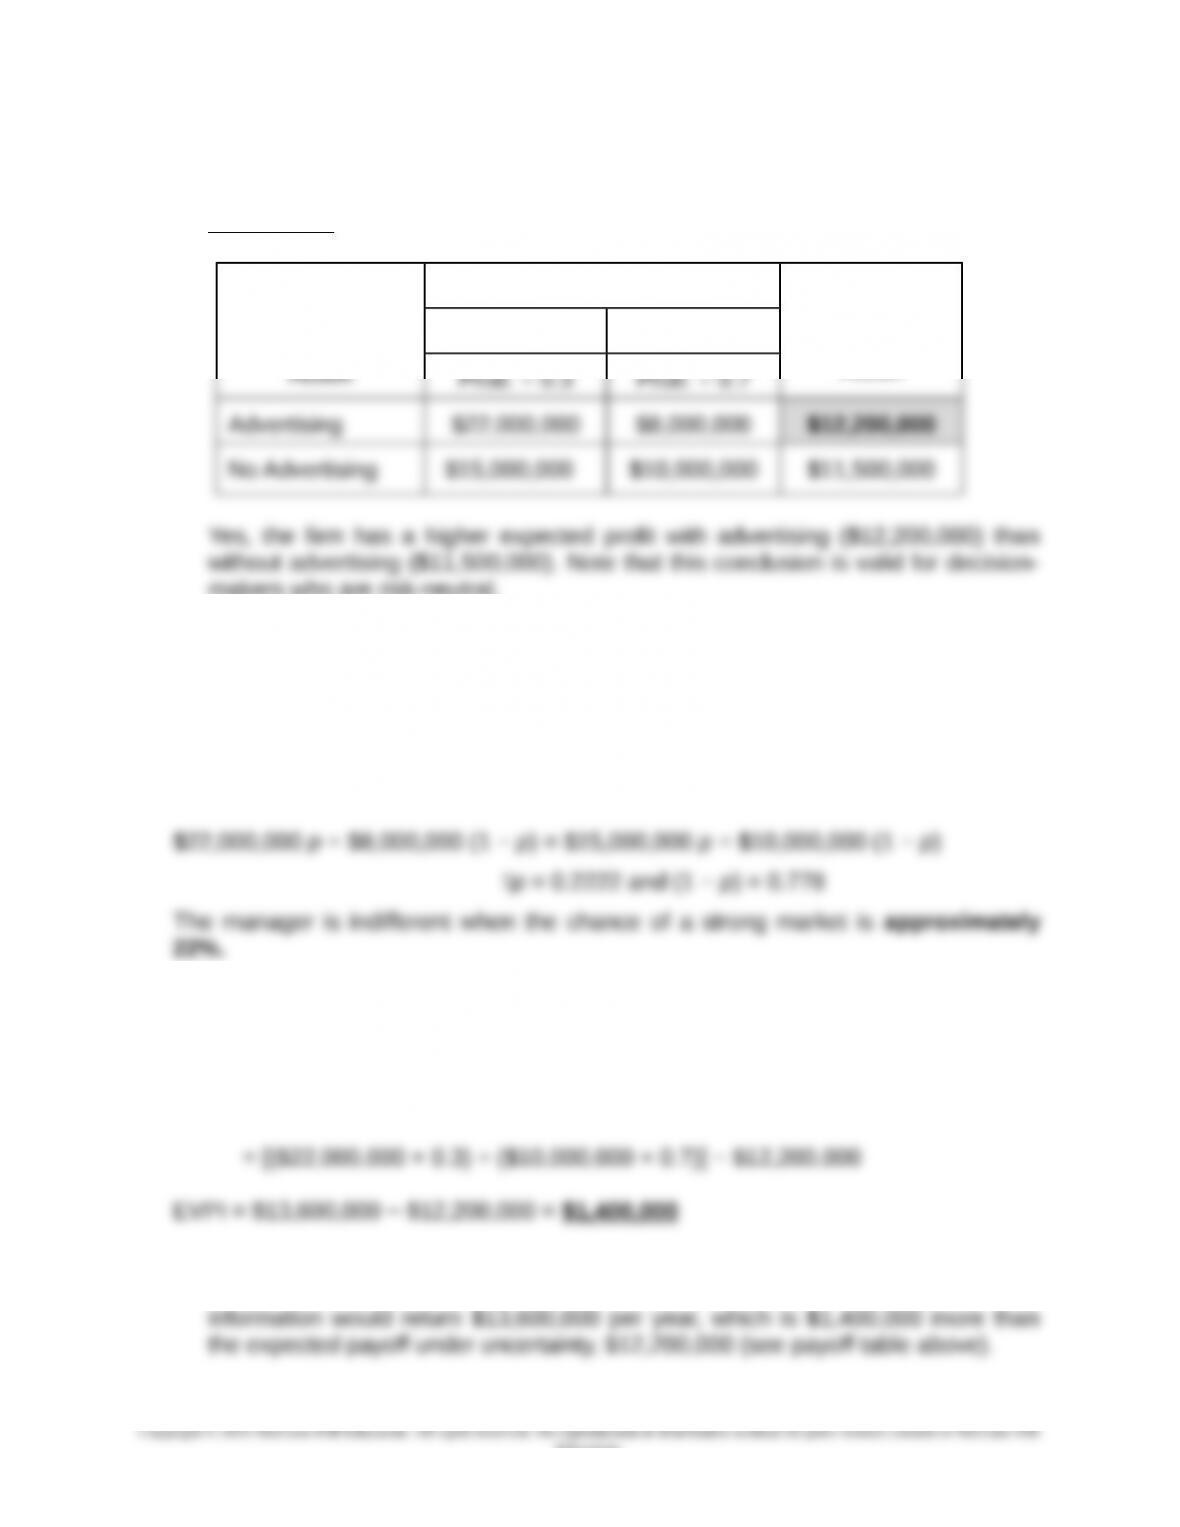
1. Payoff Table
Possible
Courses of
State of the Market
Expected
Value of Each
Action
Strong Weak
makers who are risk-neutral.
2. Let p be the probability that the market is strong; thus, the probability that the market
is weak is 1 − p.
At the indifference point:
E(Advertising) = E(No Advertising)
3. The Expected Value of Perfect Information (EVPI) = maximum value the manager
would pay to have knowledge (i.e., certainty) of the revealed state of nature.
EVPI = Expected (i.e., long-run average) profit with perfect information − expected
(i.e., long-run average) profit without perfect information
The maximum amount, on an expected-value basis, that a rationale decision-
maker would pay for perfect information is $1,400,000. On average, perfect
15-77
Education.
Chapter 15 – Operational Performance Measurement: Indirect-Cost Variances and Resource-Capacity Management
15-52 Variance Investigation under Uncertainty (Appendix) (30-40 minutes)
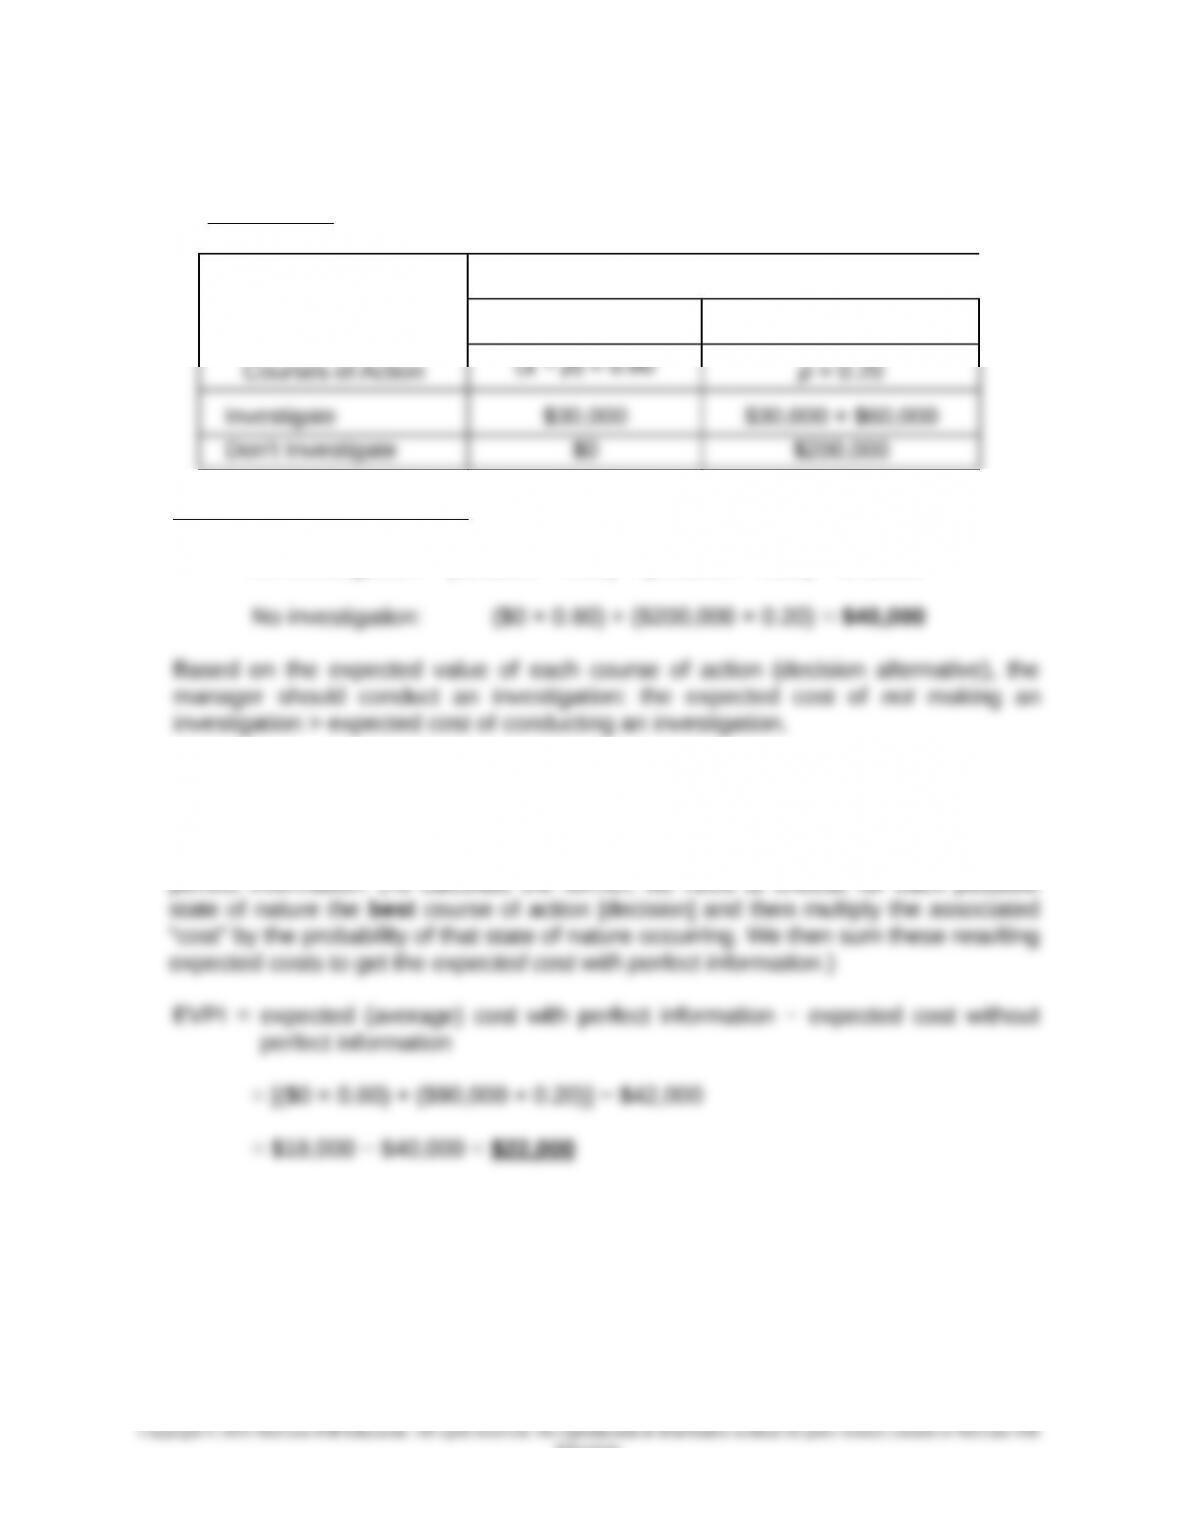
1. Payoff Table
States of Nature
In-Control Out-of-Control
2. Expected cost of conducting:
An investigation: ($30,000 × 0.80) + ($90,000 × 0.20) = $42,000
3. The Expected Value of Perfect Information (EVPI) = maximum value the manager
would pay to have knowledge (i.e., certainty) of whether the process is in control or
out of control. In this decision context, the EVPI can be thought of as the difference
between the expected cost with perfect information and the expected cost without
15-78
Education.

Chapter 15 – Operational Performance Measurement: Indirect-Cost Variances and Resource-Capacity Management
15-79
Check Figures
cost rate = $21.00 per machine hour.
15-25 No check figure.
15-26 No check figure.
15-27 1. Standard fixed factory overhead rate = $1.90/machine hour. 2. 3,750 machine
variance = $3,600U
15-33 1. Fixed overhead application rate = $4.5/machine hour; total overhead rate =
$7.50/machine hour. 2. Total Flexible Budget for Overhead Based on Units
$78,000 (i.e., $12,000 less than determined previously).
15-39 1. Revised fixed overhead application rate per machine hour = $3.60; revised
operating income = ($744,000); change in operating income = $8,856,000.
15-80
Chapter 15 – Operational Performance Measurement: Indirect-Cost Variances and Resource-Capacity Management
$52,263 (Budgeted Capacity).
15-41 No check figures.
15-42 No check figures.
15-43 No check figures.
15-44 1. Direct materials price variance prorated to finished goods ending inventory =
$1,794. 2. Amount of direct materials in ending finished goods inventory after
overhead: $3,000 underapplied.
15-46 No check figure.
15-47 1. Cost-Driver Rates: $75 per customer order; $200 per customer complaint; $240
setup-related overhead efficiency variance = $945U.
15-51 1. E(Advertising) = $12,200,000; E(No Advertising) = $11,500,000. 2. Indifference
15-81
Education.