
Chapter 15 – Operational Performance Measurement: Indirect-Cost Variances and Resource-Capacity Management
Note: An Excel spreadsheet solution file for this assignment is embedded below. You can
open this “object” by doing the following:
1. Right click anywhere in the worksheet area below.
2. Select “worksheet object” and then select “Open.”
3. To return to the Word document, select “File” and then “Close and return to…”
while you are in the spreadsheet mode. The screen should then return you to
this Word document.
Ex. 15-34 7e.xlsx
Chapter 15 – Operational Performance Measurement: Indirect-Cost Variances and Resource-Capacity Management
15-35 Traditional ABC Costing (50 minutes)
Standard MH per unit = 32,000 MH 6,400 units = 5 MH per unit
No. of units manufactured during the period = standard allowed MH standard
MH/unit = 30,000 MH 5 MH/unit = 6,000 units
Budgeted no. of units/setup = 6,400 units 32 set-ups = 200 units/set-up
Standard no. of setups for the units manufactured = 6,000 200 = 30
FB based on Inputs FB based on Outputs
(i.e., based on actual (i.e., based on standard
1. Actual activity units) allowed activity units)
VOH:
Setup 28 × $600 = $ 16,800 30 × $600 = $ 18,000
Total Flexible-Budget Variance
= $48,000U
FB based on Inputs FB Based on Outputs
(i.e., on actual (i.e., based on standard
2. Actual activity units) allowed activity units)
VOH:
Setup 28 × $2,600 = $ 72,800 30 × $2,600 = $ 78,000
MH 35,000 × $5 = 175,000 30,000 × $5 = 150,000
FOH: 200,000 200,000
Total OH $480,000 $447,800 $428,000
15-32
Education.
Chapter 15 – Operational Performance Measurement: Indirect-Cost Variances and Resource-Capacity Management
15-35 (Continued)
3. Standard variable overhead application rate = budgeted variable manufacturing
overhead in the master budget practical capacity (MH)
Setup cost = $64,000 + ($600/setup × 32 setups) = $ 83,200
Applied based on machine hours = 32,000 hours × $5.00/hr. = 160,000
FB based on Inputs FB Based on Outputs
(i.e., on actual (i.e., on standard
Actual activity units) allowed activity units)
VOH: 35,000 × $7.60 = 266,000 30,000 × $7.60 = 228,000
FOH: 200,000 200,000
Total OH $480,000 $466,000 $428,000
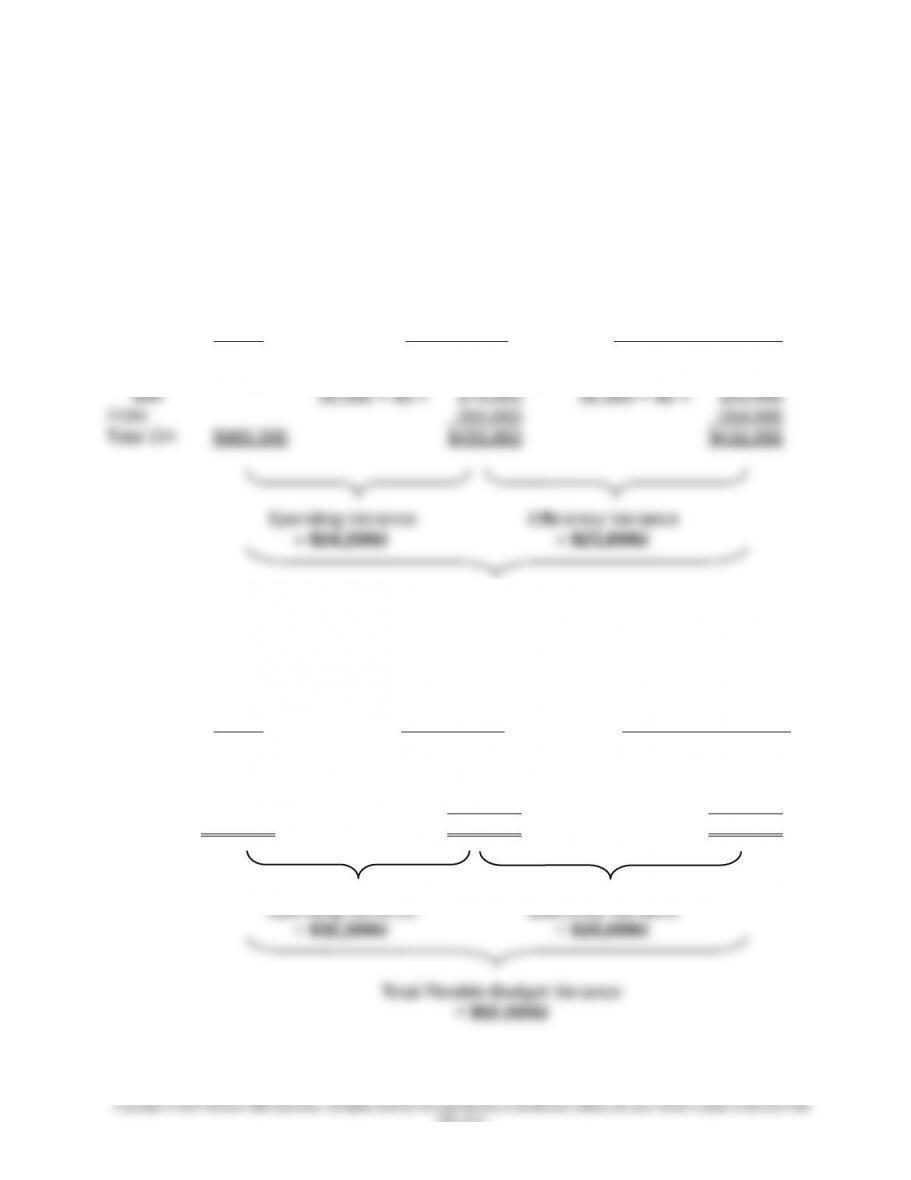
Notice that assumptions made regarding the number and type of activity measures used
to apply standard overhead costs to production can affect both the total flexible-budget
variance and the components of this variance. For this reason, the activities used to
construct flexible-budgets for control purposes should be carefully selected.
15-33
Education.

Chapter 15 – Operational Performance Measurement: Indirect-Cost Variances and Resource-Capacity Management
Chapter 15 – Operational Performance Measurement: Indirect-Cost Variances and Resource-Capacity Management
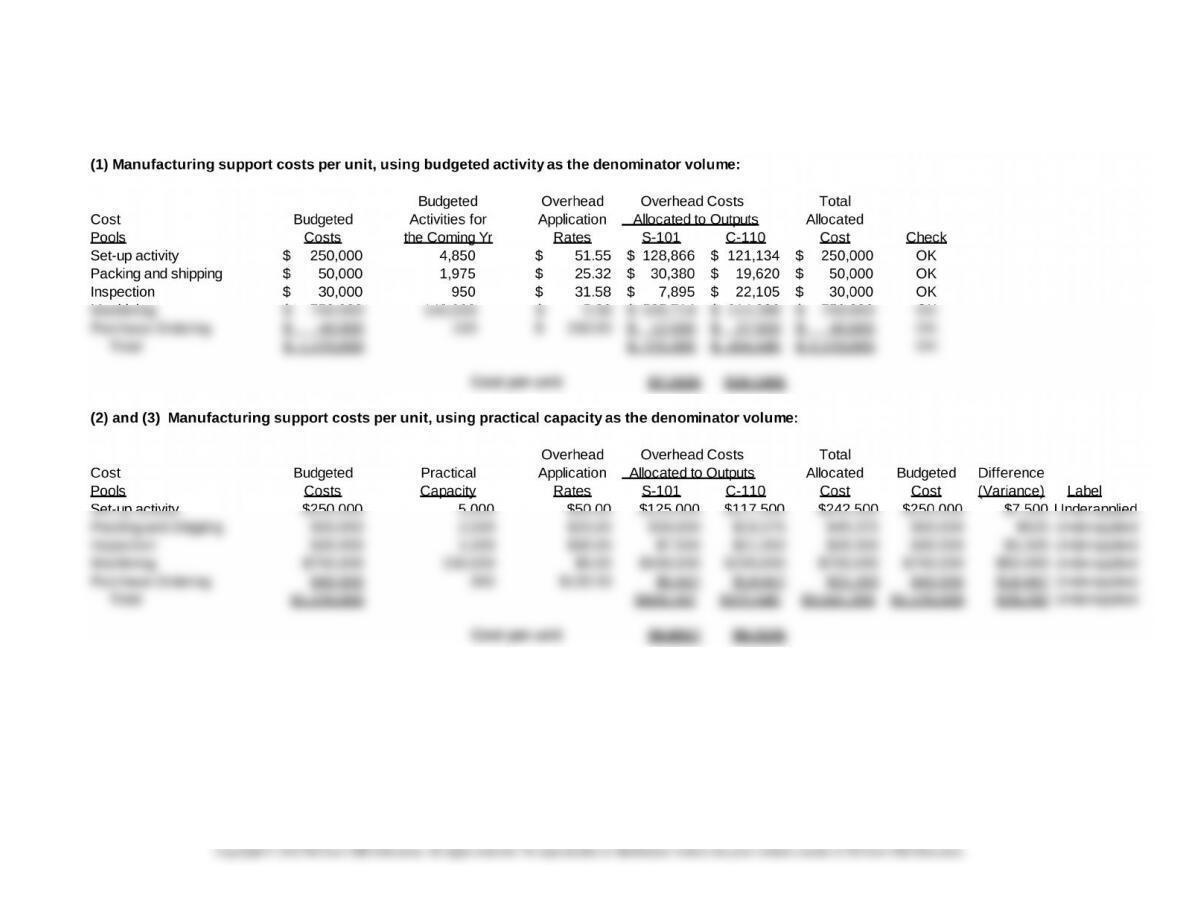
15-36 ABC and Practical Capacity; Spreadsheet Application (50 minutes)
15-35
Chapter 15 – Operational Performance Measurement: Indirect-Cost Variances and Resource-Capacity Management
15-36 (Continued)
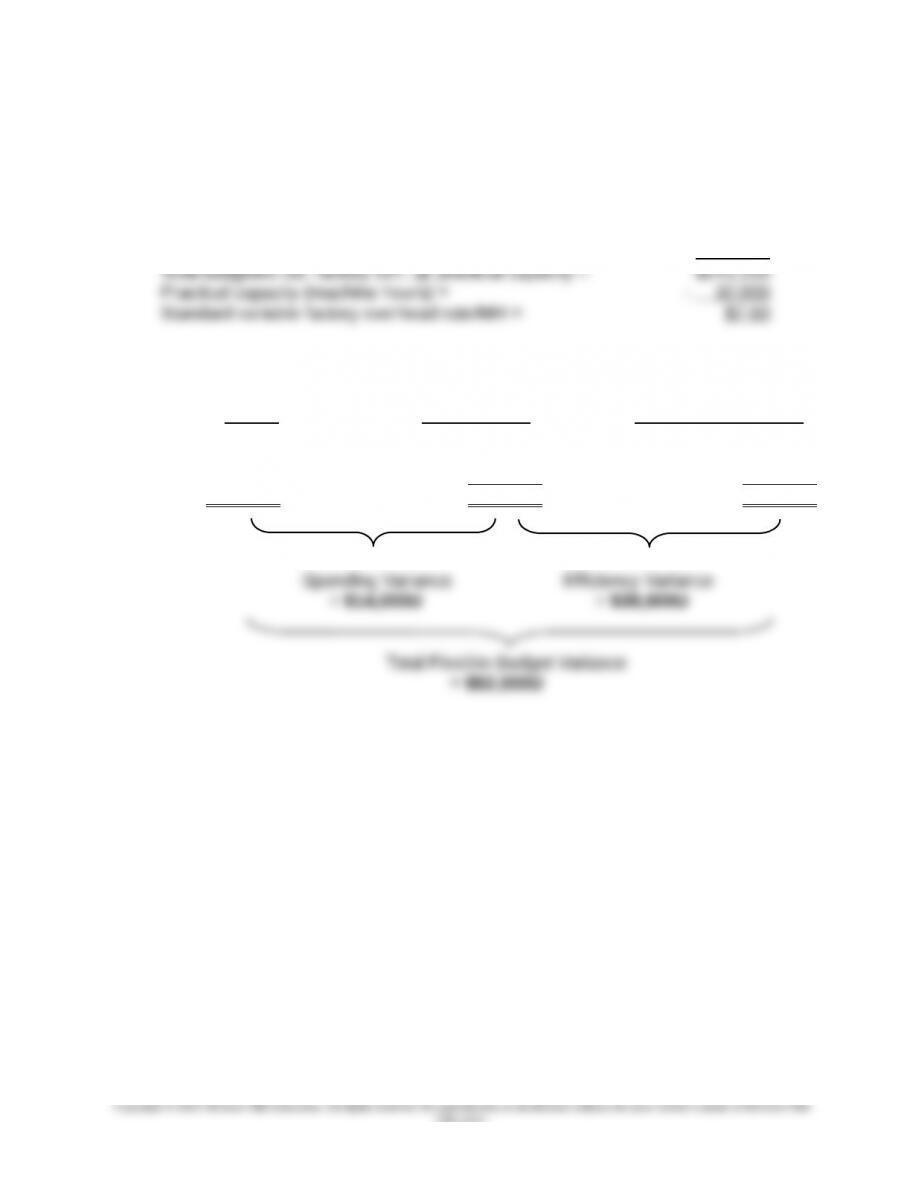
The difference (variances) reported when the denominator activity level is defined as
“practical capacity” can be interpreted as the “cost of unused capacity.” This information
can be reported over time (time-series basis) to management to determine whether
some of the available capacity should be eliminated or whether some alternative uses to
this available capacity can be made. Notice that when practical capacity is used as the
denominator, there is consistency between the numerator and denominator: the
Note: An Excel spreadsheet solution file for this assignment is embedded below. You
can open this “object” by doing the following:
1. Right click anywhere in the worksheet area below.
2. Select “worksheet object” and then select “Open.”
3. To return to the Word document, select “File” and then “Close and return
to…” while you are in the spreadsheet mode. The screen should then return
you to this document.
15-36
Ex. 15-36 7e.xlsx
Chapter 15 – Operational Performance Measurement: Indirect-Cost Variances and Resource-Capacity Management
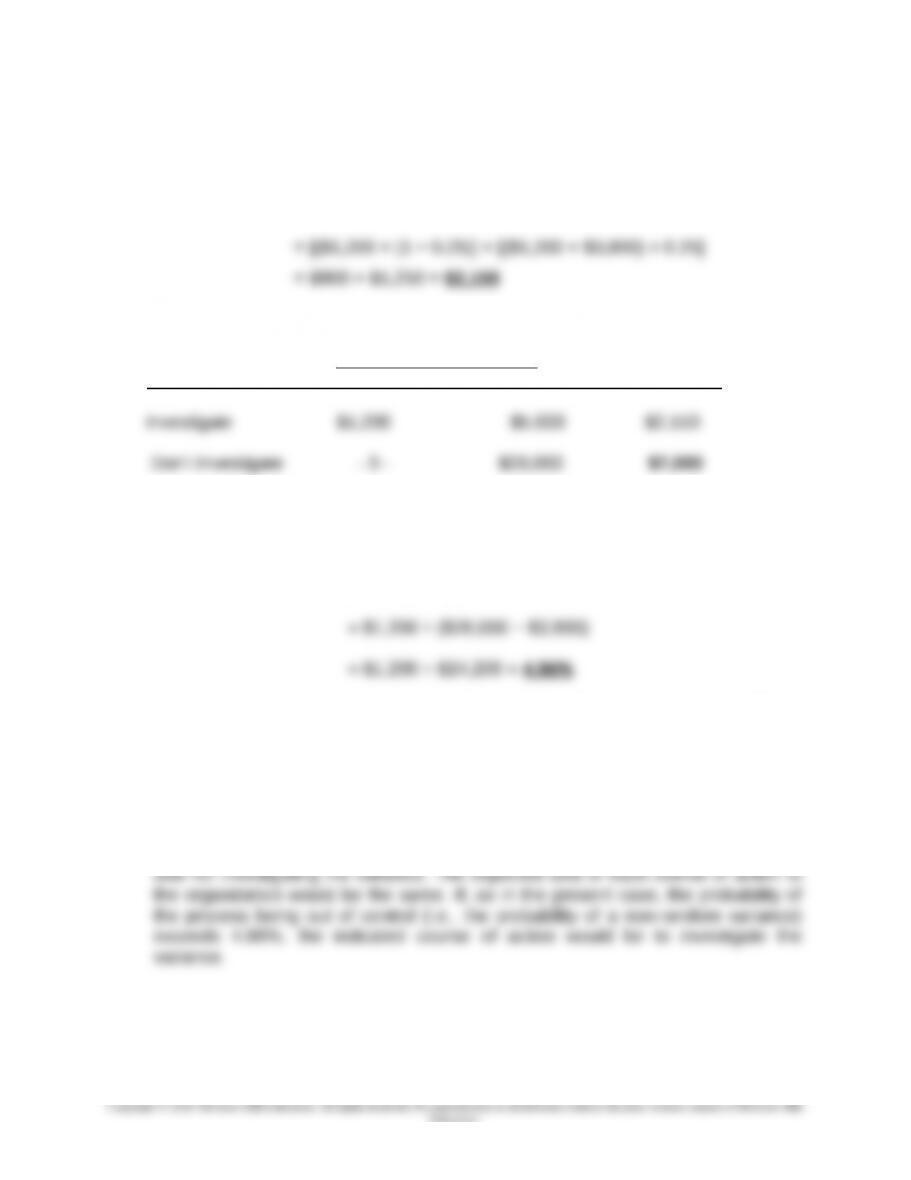
15-37 Use of Payoff Tables (Appendix); Spreadsheet Application (30-45 minutes)
(1) Expected value of the decision to investigate the variance:
E(Investigate) = [(I × (1 −p)] + [(I + C) × p]
(2) Payoff table:
Management States of Nature (prob.) Expected
Action Random (75%) Systematic (25%) Value
(3) Let p = the indifference probability, that is, the probability of for a nonrandom
variance such that management is indifferent between the two courses of action,
investigate or do not investigate:
p = I ÷ (L − C)
where I = the expected cost to conduct an investigation, L = expected loss
associated with leaving an out-of-control process out of control (i.e., the present
value of losses the organization will experience until the next decision point), and
C = the expected cost to correct the process if the variance is found to have a
nonrandom cause.
Thus, if the probability (p) for a nonrandom cause (or causes) is 4.96%,
management would be indifferent, in expected value terms, between investigating
15-37
Education.

15-37 (Continued)
Note: An Excel spreadsheet solution for this exercise is embedded below. You can open
this “object” by doing the following:
1. Right click anywhere in the worksheet area below.
2. Select “worksheet object” and then select “Open.”
3. To return to the Word document, select “File” and then “Close and return to…”
while you are in the spreadsheet mode. The screen should then return you to
this document
15-38
Education.
Ex. 15-37 7e.xlsx
Chapter 15 – Operational Performance Measurement: Indirect-Cost Variances and Resource-Capacity Management
PROBLEMS
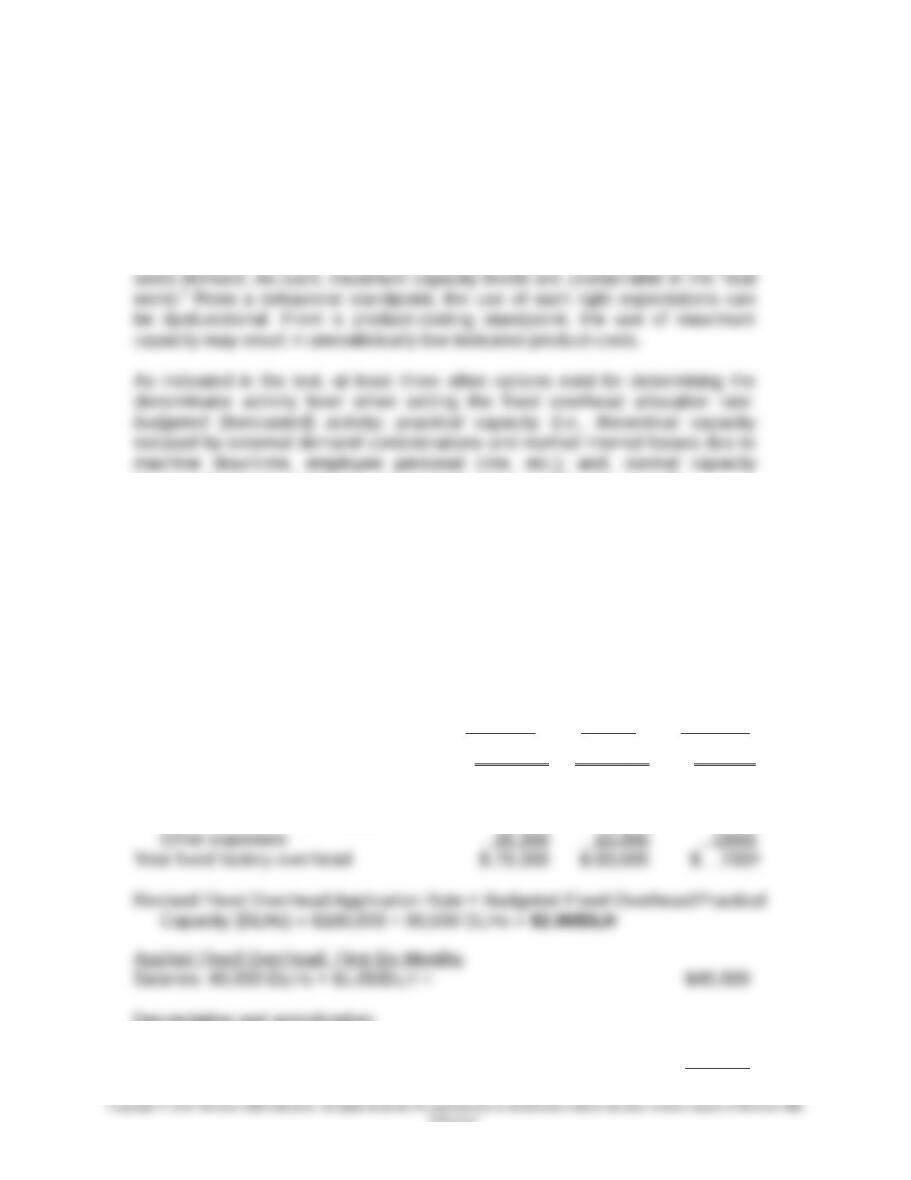
15-38 Capacity Levels and Fixed Overhead Rates (60 minutes)
1. As the name suggests, maximum (theoretical) capacity is the maximum output
level for the plant, one that assumes operating at maximum efficiency. This
level of productivity suggests no “down time” for machine maintenance, no
internal disruptions to the manufacturing process, and no slack in external
(expected sales demand over an upcoming three- to five-year period).
2. A revised variance report for Yuba Machine Company using expected
(budgeted) activity as the basis for applying fixed factory overhead is
presented below.
Yuba Machine Company
Revised Variance Report
for Six Months ended May 31, 2017
Applied
Actual Overhead
Costs Costs Variance
Total variable factory overhead $120,220 $120,000 $ (220 )
Fixed factory overhead:
Salaries $ 39,000 $ 40,000 $ 1,000
Depreciation and amortization 25,000 25,000 –
Depreciation and amortization:
40,000 DLHs × $0.625/DLH = $25,000
Other expenses: 40,000 DLHs × $0.375/DLH = $15,000
15-39
Education.

Chapter 15 – Operational Performance Measurement: Indirect-Cost Variances and Resource-Capacity Management
15-40
Education.