Chapter 13 – Cost Planning for the Product Life Cycle: Target Costing, Theory of Constraints, and Strategic Pricing
13-39 (continued -1)
b. Morrow appears to compete in what Robin Cooper calls the
“confrontation” strategy (When Lean Enterprises Collide, Harvard Business
School Press, 1995) wherein each competitor must simultaneously
compete on the basis of price, quality and functionality. In Morrow’s case,
functionality refers not only to meeting product specifications but also to
“delighting” the customer with meeting delivery times, reducing lead times,
and minimizing billing and shipping errors, as Morrow has done. In a
c. The problem notes that the manufacturing costs are “standard” full costs.
Since the costs are given at standard, this means that there are no
13-21
Chapter 13 – Cost Planning for the Product Life Cycle: Target Costing, Theory of Constraints, and Strategic Pricing
13-40 Target Costing; Health Care (20 min)
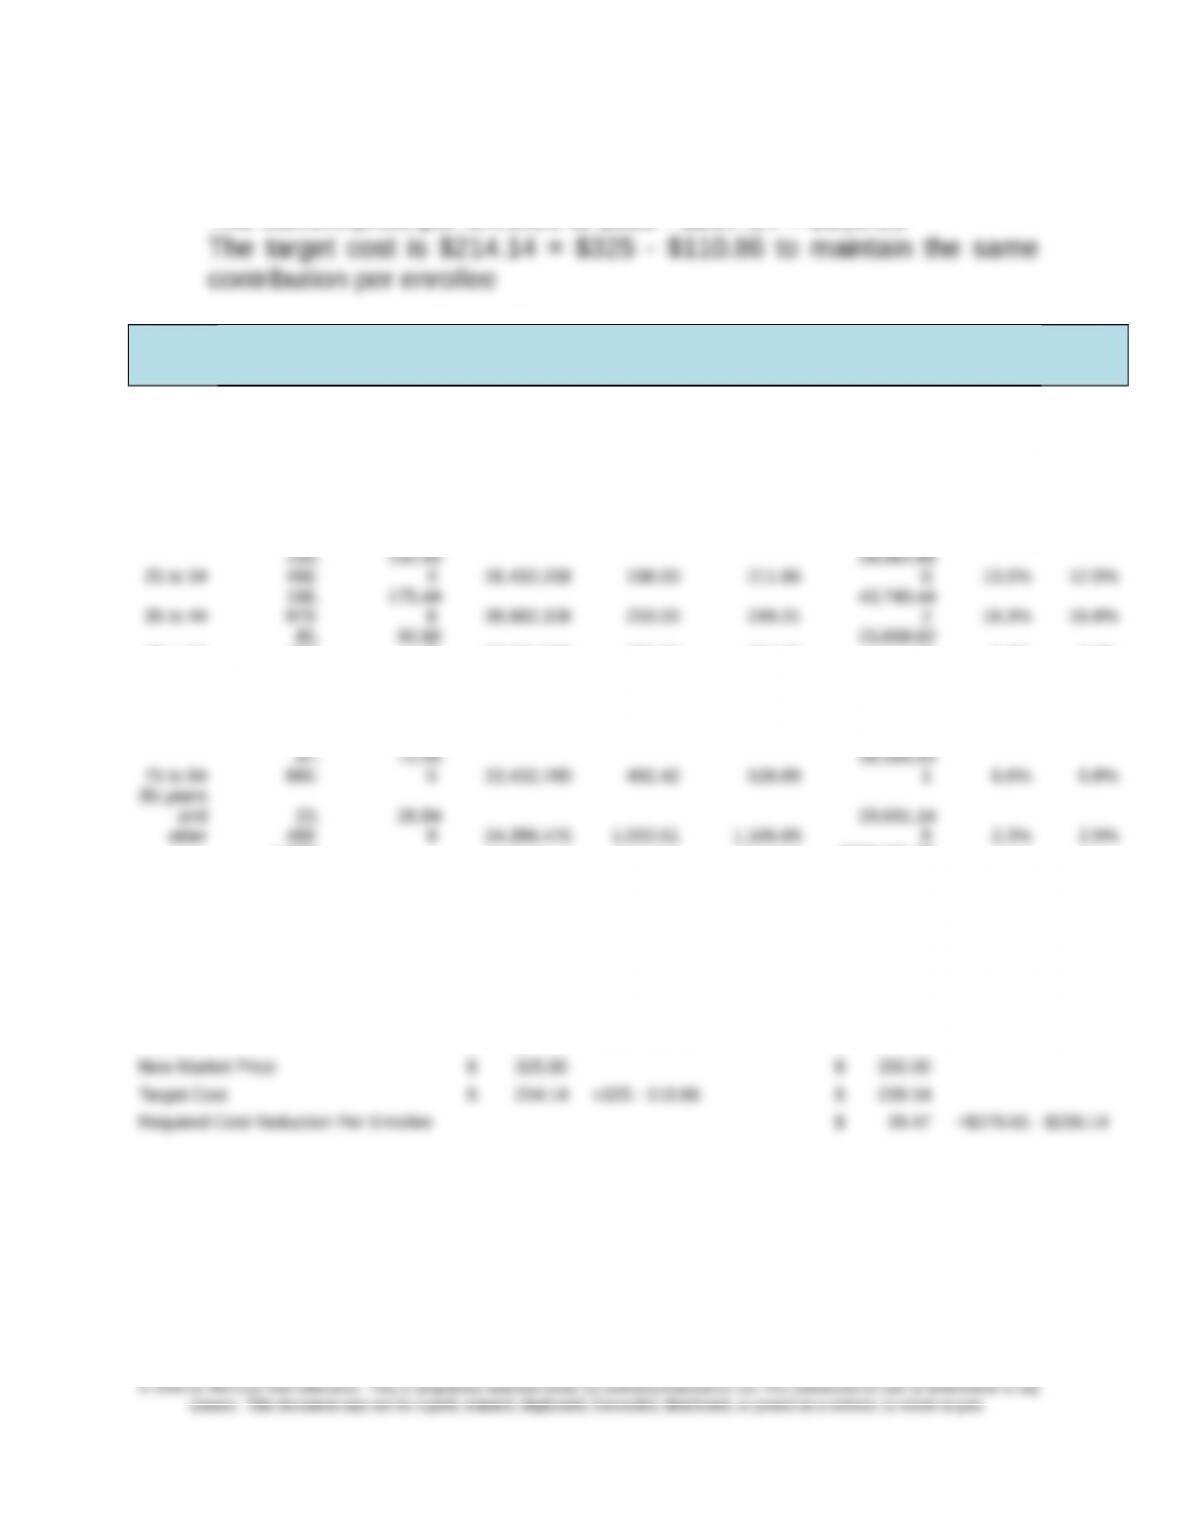
1. The average cost is $257.14 = $263,169,095 ÷1,023,437
The current profit per enrollee is $368 – $257.14 = $110.86
Age
Enrollment
in 2016
Projected
Enrollment
in 2017
Average
Monthly Cost
in 2016
Avg Cost in
2016
Avg Cost in
2017 (+7%)
Projected
Cost in 2017
Age % in
2017
Age %
in 2017
1 to 4
45,
688
48,97
7 $ 11,147,872 244.00 261.08 $ 12,786,915 4.5% 4.6%
5 to 14
82,
456
84,66
3 10,059,632 122.00 130.54
11,051,90
8 8.1% 8.0%
15 to 19
95,
873
95,88
7 8,436,824 88.00 94.16
9,028,72
0 9.4% 9.1%
20 to 24
66,
246
67,88
2 9,539,424 144.00 154.08
10,459,25
9 6.5% 6.4%
133,
132,55
28,082,89
45 to 54
496
9 22,741,936 266.00 284.62
7 8.4% 8.6%
55 to 64
99,
624
101,92
3 28,691,712 288.00 308.16
31,408,59
2 9.7% 9.6%
65 to 74
156,
288
161,55
9 49,518,144 316.84 339.02
54,771,37
7 15.3% 15.3%
67,
72,46
38,180,93
TOTAL
1,023,
437 1,059,094 $263,169,095
$295,071,00
9 100.0% 100.0%
1,023,437
1,059,09
4
Average Cost $ 257.14 $ 278.61
Current Price $ 368.00
Current Profit Per Enrollee (Desired
Profit) $ 110.86 = 368 – 257.14 $ 110.86
13-22
Chapter 13 – Cost Planning for the Product Life Cycle: Target Costing, Theory of Constraints, and Strategic Pricing
13-40 (continued -1)
2. The target cost for 2017 is $239.14 = $350 – $110.86; this calculation
uses the new price and the same profit per enrollee as in 2016. The
required reduction in cost per enrollee is $39.47 as shown in the above
table. Note that the cost per enrollee is determined by taking the
average cost per enrollee for each age group (Col E) in order to
groups, it is important for VIP-MD to study the actual pattern of increase
in cost, across all age groups as the number of enrollees in each group
change.
3. A critical success factor is the relationship with network providers.
Establishing a good working relationship with its providers improves the
likelihood that the clinicians will follow the HMO’s protocols. Customer
satisfaction is essential, so VIP-MD should measure and monitor the
13-23
Chapter 13 – Cost Planning for the Product Life Cycle: Target Costing, Theory of Constraints, and Strategic Pricing
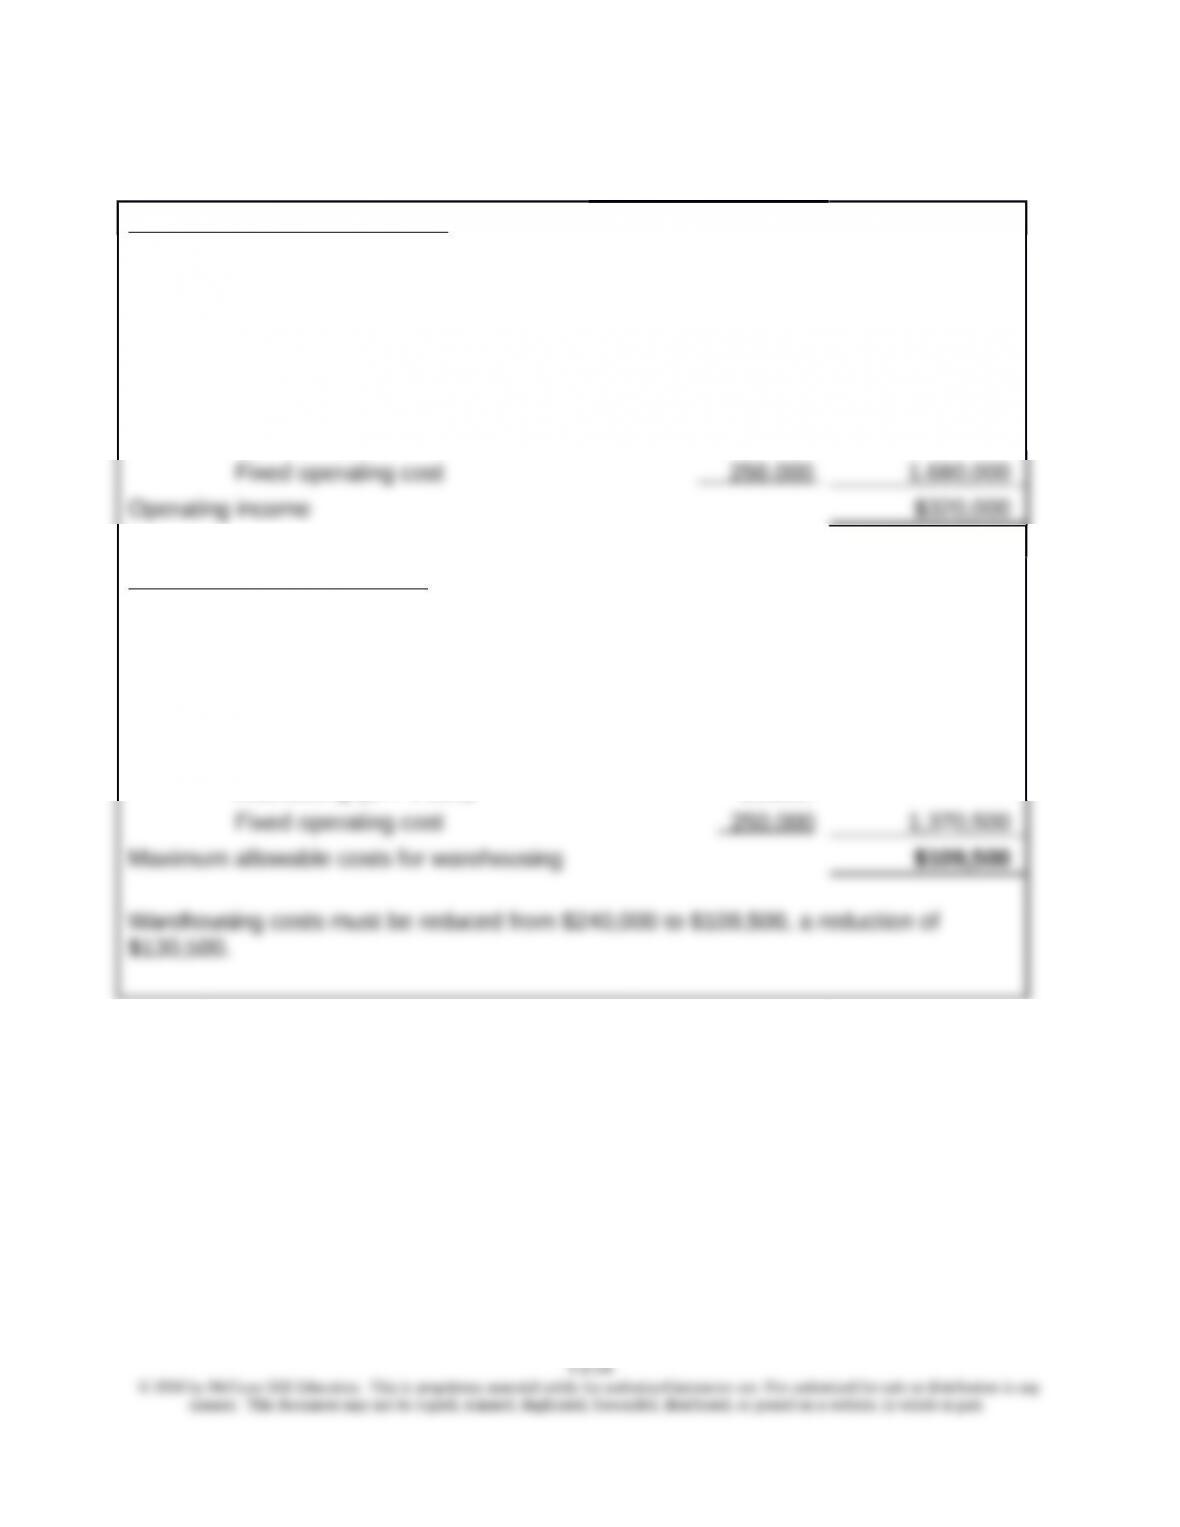
13-41 Target Cost; Warehousing (20 min)
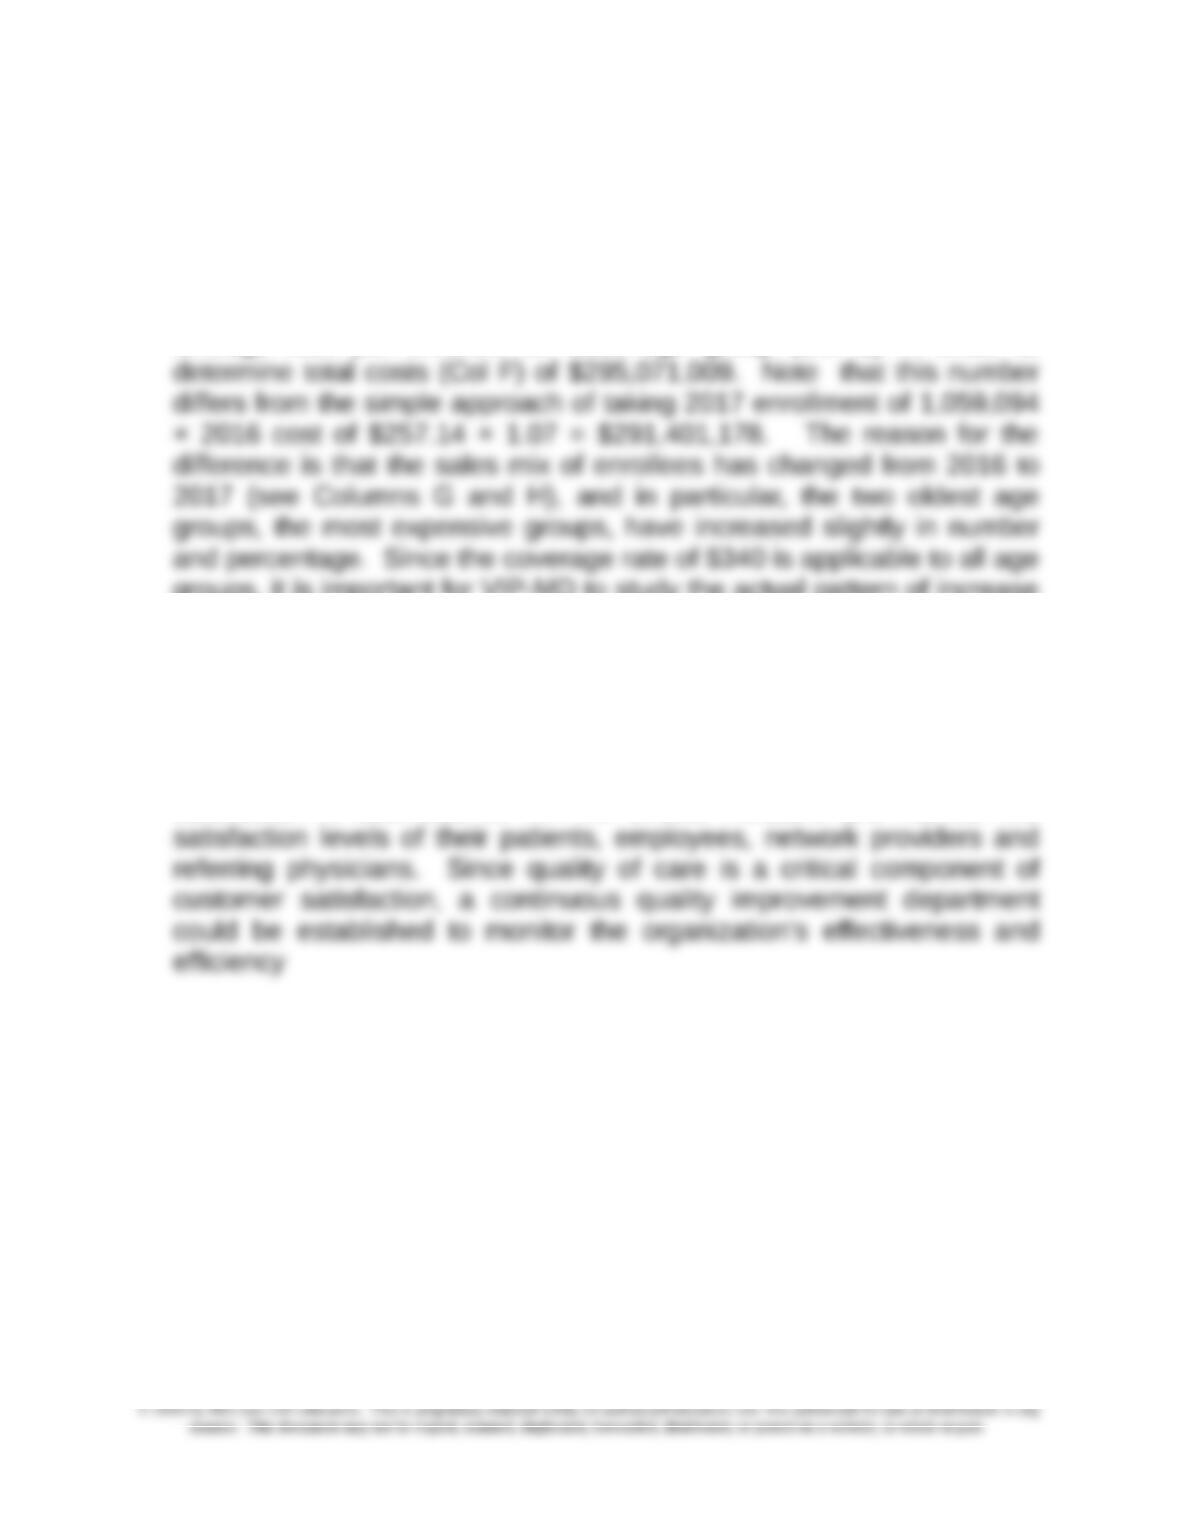
Current Year Operating Income
Sales ($20 x 100,000) = $2,000,000
Costs:
Purchase ($10 x 100,000) $1,000,000
Purchasing order ($150 x 1,000) 150,000
Warehousing ($30 x 8,000) 240,000
Distributing ($80 x 500) 40,000
Determination of Target Cost:
Sales ($20.00 x 100,000 x 0.90) $1,800,000
Desired profit (above) 320,000
Costs:
Purchase (2% discount) $980,000
Purchasing order ($150 x 680) 102,000
Distributing ($77 x 500) 38,500
Chapter 13 – Cost Planning for the Product Life Cycle: Target Costing, Theory of Constraints, and Strategic Pricing
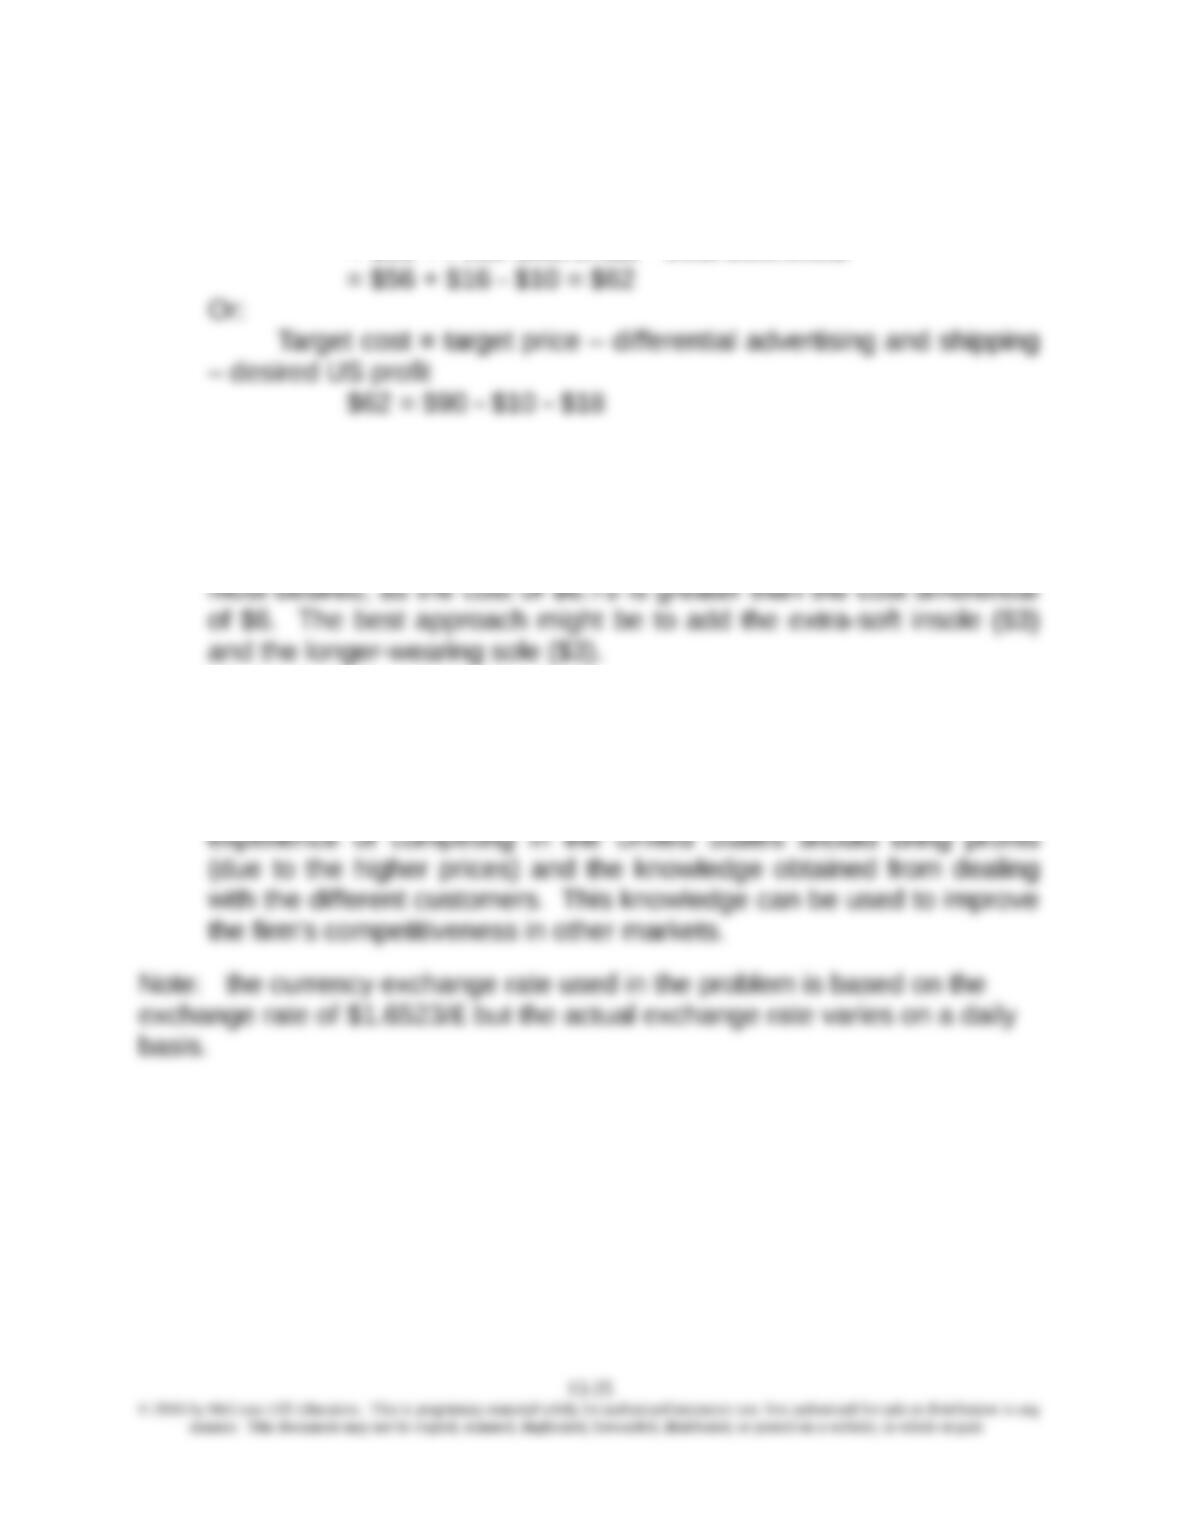
13-42 Target Costing; International (20 min)
1. Target manufacturing cost = Current manufacturing cost + “U.S.
Differential”
= $56 + Price differential – Cost differential
2. The cost differential is $62 – $56 = $6
Harpers cannot add the lighter weight feature, though it is the
3. Strategically, the decision to sell shoes in the United States makes
very good sense. To compete effectively in a competitive global
market such as shoes, a firm has to have an effective presence in all
the key markets, which would include the United States. The
Chapter 13 – Cost Planning for the Product Life Cycle: Target Costing, Theory of Constraints, and Strategic Pricing
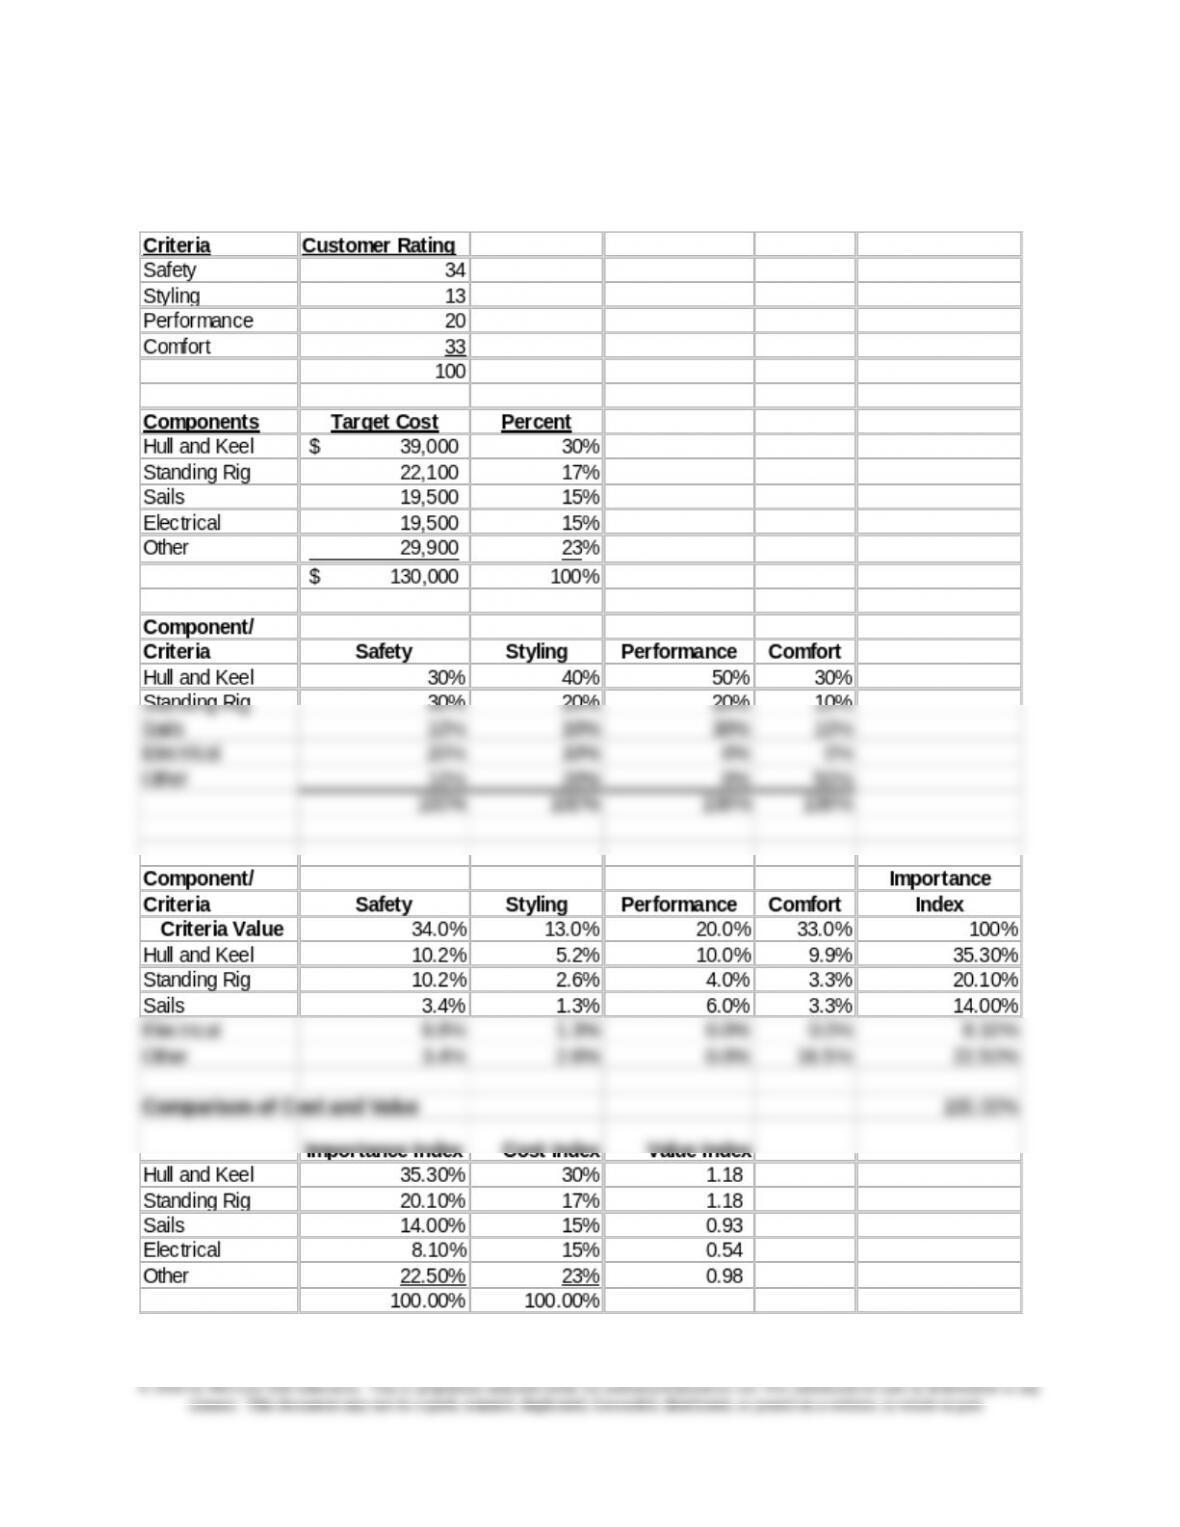
13-43 Target Costing; Quality Function Deployment (QFD) (30 min)
1.
13-26
Chapter 13 – Cost Planning for the Product Life Cycle: Target Costing, Theory of Constraints, and Strategic Pricing
13-43 (continued)
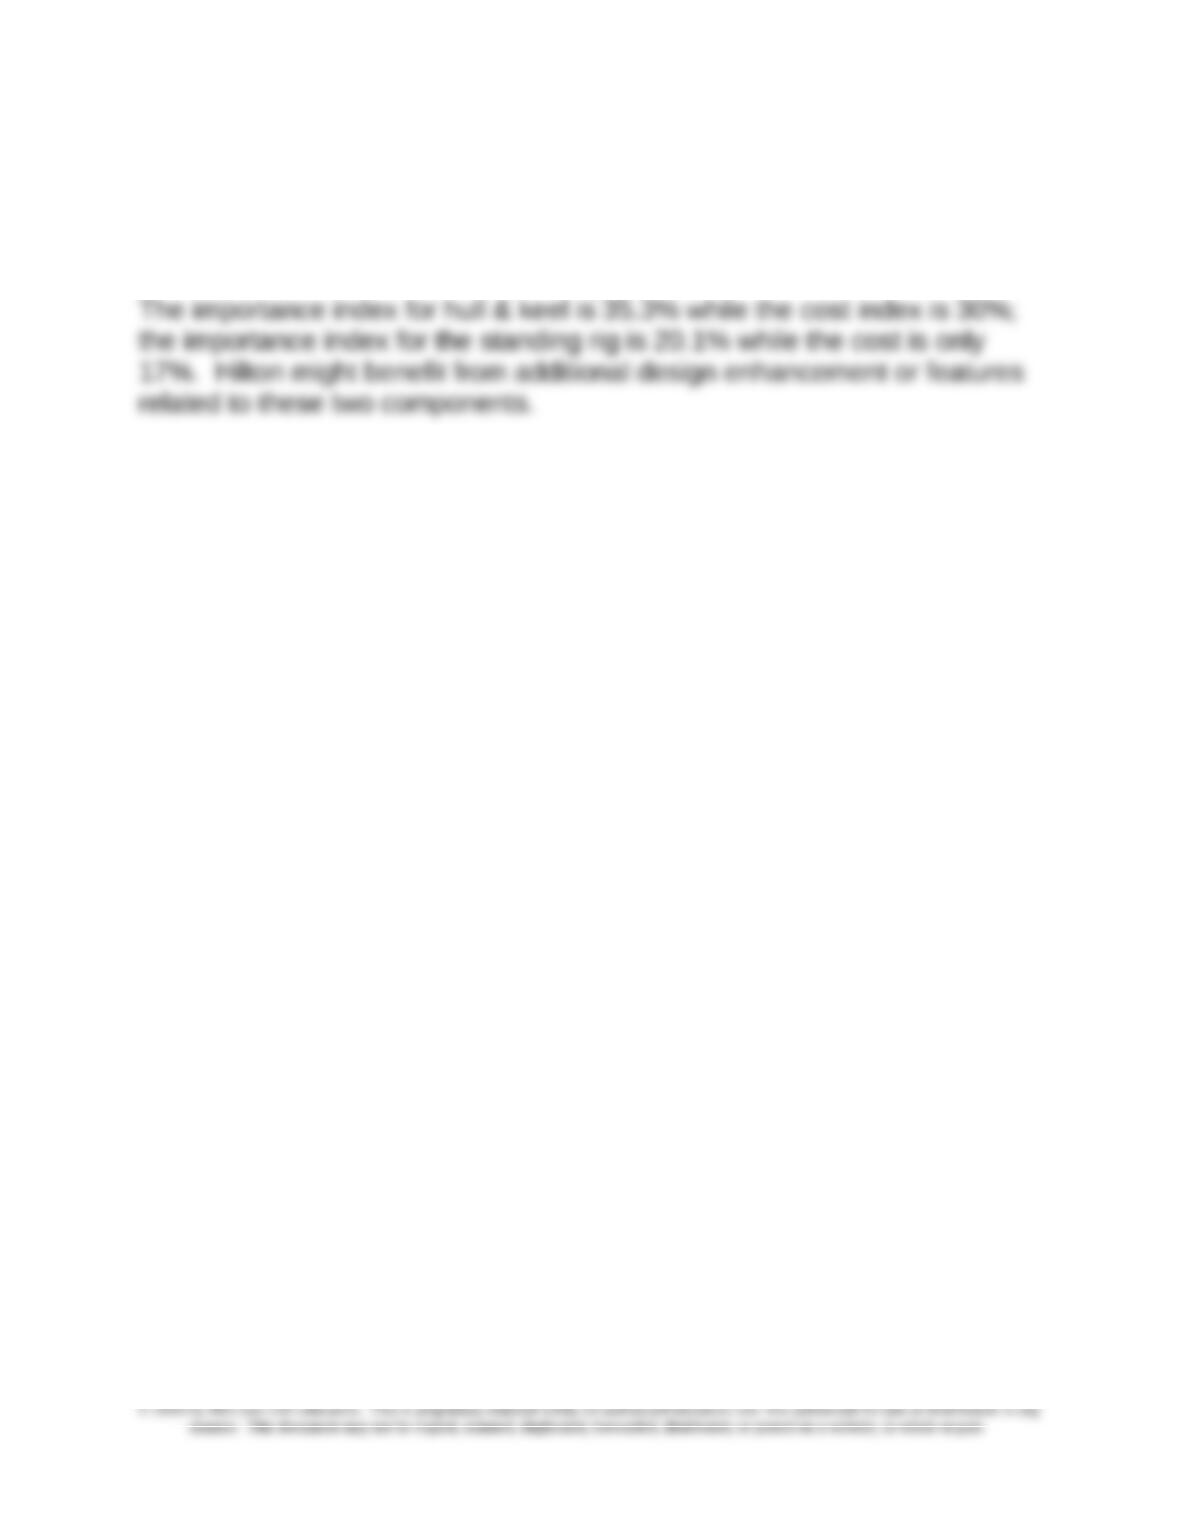
2. When the importance index is compared to the cost index, the
percentage investment in hull & keel and standing rig looks too low – as
seen by the value index value as being greater than 1.
In contrast, the expenditures for electrical equipment are somewhat higher
than would be indicated by customer preferences. Overall, this suggests
that consideration be given to redesign of the boat to bring it more in line
with customer value.
13-27
Chapter 13 – Cost Planning for the Product Life Cycle: Target Costing, Theory of Constraints, and Strategic Pricing
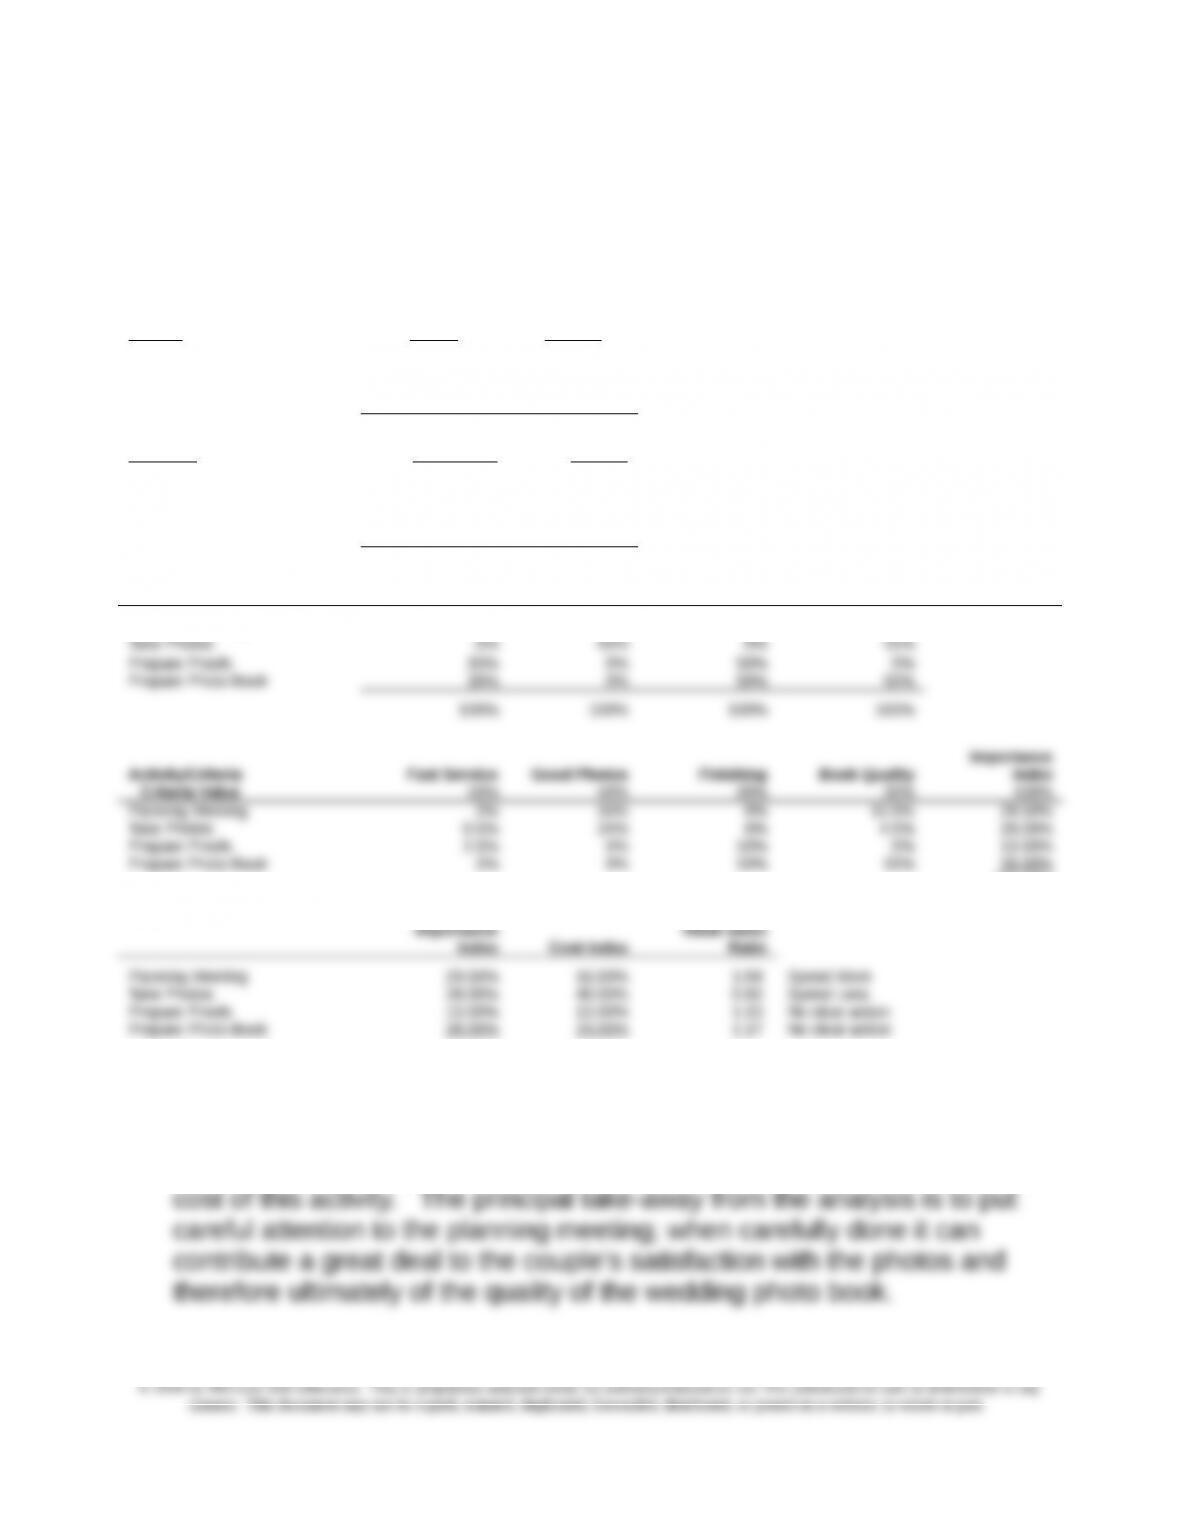
13-44 Target Costing: Quality Function Deployment
The QFD analysis shows that BPI should consider spending more time and
money on the planning meeting and less on the photography done the day
of the wedding, to put their costs more in line with the customer criteria.
Customer
Criteria Rating Percent
Fast Service 30 10.0%
Getting Good Photos 120 40.0%
Quality of Photo Finishing 60 20.0%
Quality of Photo Books 90 30.0%
300 100.0%
Activities Target Cost Percent
Planning Meeting $ 800 16.0%
Take Photos 2,400 48.0%
Prepare Proofs 600 12.0%
Prepare Photo Book 1,200 24.0%
$ 5,000 100.0%
Activity/Criteria Fast Service Good Photos Finishing Book Quality
Planning Meeting 30% 40% 0% 35%
100.00%
Comparison of Cost and Value
100.00% 100.00%
4. A limitation of the above analysis is that there are certain costs of taking
the photos on the day of the wedding (additional lighting, backup
cameras, and equipment, etc.) which may make it difficult to reduce the
13-28
Chapter 13 – Cost Planning for the Product Life Cycle: Target Costing, Theory of Constraints, and Strategic Pricing
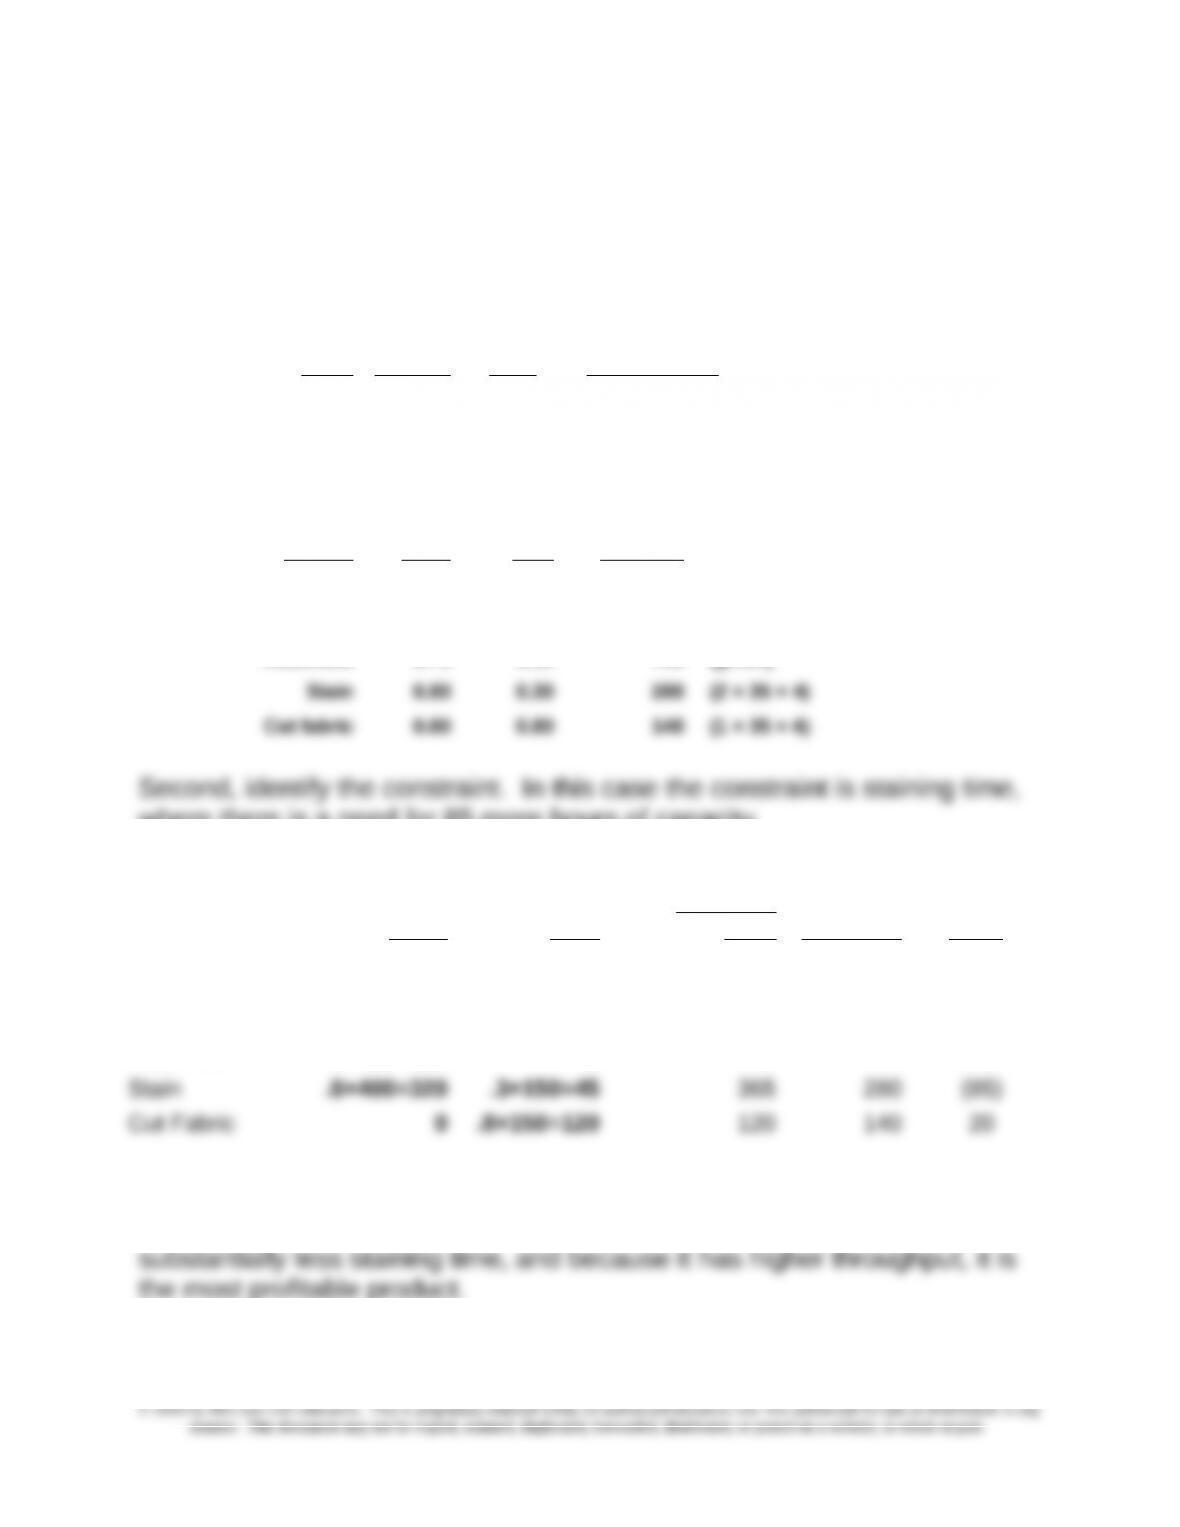
13-45 Theory of Constraints; Strategy (30 min)
First, summarize key information and obtain hours capacity in each
process. The materials cost for the table is $100 of lumber, while the
materials cost for the sofa equals $250 ($75 for lumber and $175 for
fabric).
Product
s
Name Demand Price Materials Cost
First Table 400 $250.00 $100.00
Second Sofa 150 $450.00 $250.00
Time Req’d for
Each Product
Time (hrs.)
Activity Table Sofa Available
Cut lumber 0.50 0.20 280 (2 × 35 × 4)
Sand 0.50 0.50 280 (2 × 35 × 4)
Assemble 0.75 1.50 700 (given)
where there is a need for 85 more hours of capacity.
Step Two, Part 1: Identify the Constraint Total Time Time Slack
Table Sofa
Required
(hrs) Available Time
Cut .5×400=200 .2×150=30 230 280 50
Sand .5×400=200 .5×150=75 275 280 5
Assemble
.
75×400=300
1.5×150=22
5525 700 175
Next, determine the most profitable product, as determined by the
requirements of the staining operation. Since the sofa requires
13-29
Chapter 13 – Cost Planning for the Product Life Cycle: Target Costing, Theory of Constraints, and Strategic Pricing
13-45 (continued)
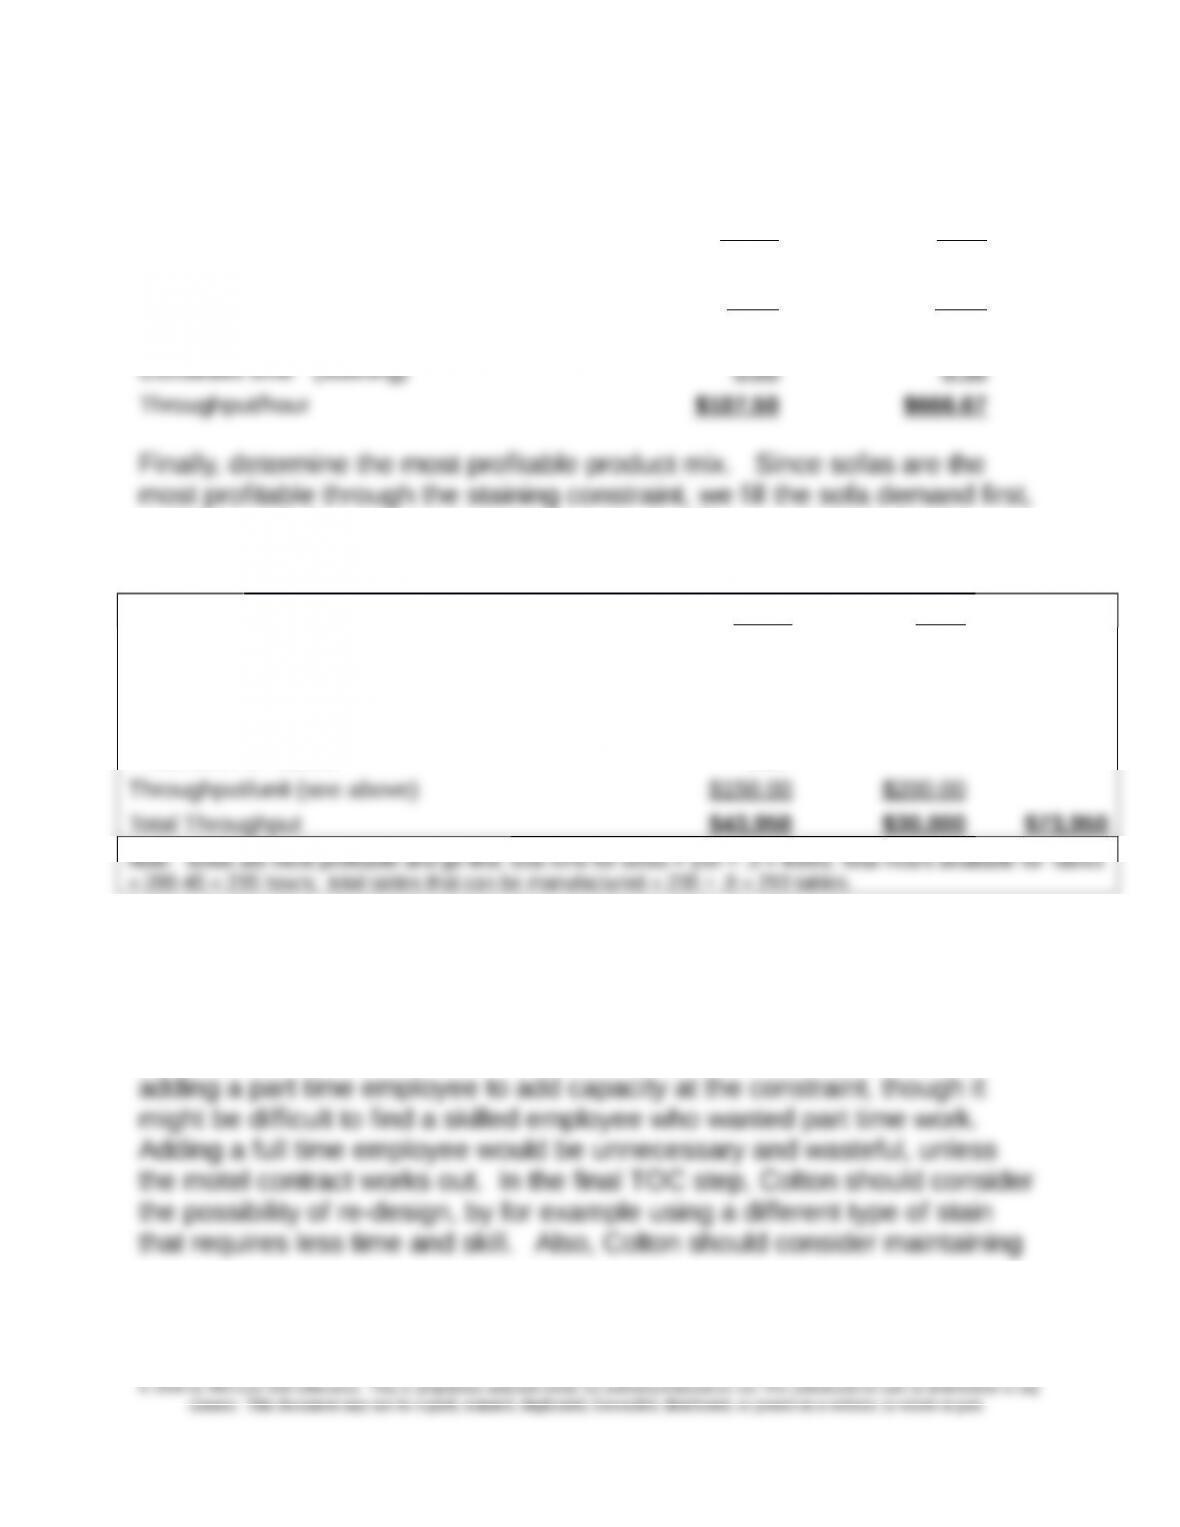
Part Two: Identify Most Profitable Product
Table Sofa
Price $250 $450
Materials Cost $100 $250
Throughput Margin $150 $200
and then with the remaining staining capacity, fill as much of the table
demand as possible. See below for calculations.
Table Sofa
Demand 400 150
Production of Sofas 150
Availability, Usage of Staining hours 235 45 280
Production of Tables 293
2. Part one above solves the first two steps of the TOC, to identify the
constraint and determine the most profitable product mix. The third step, to
maximize flow through the constraint, would require Colton to look for ways
to speed up the staining operation, by simplifying it, by training the
operator, or other means. In the fourth TOC step, Colton could consider
13-30