Chapter 13 – Cost Planning for the Product Life Cycle: Target Costing, Theory of Constraints, and Strategic Pricing
3. The airfare costs are the largest component of cost and this category
could have room for improvement. By further negotiating group discount
rates or searching for lower cost discount carriers, Take-a-Break could try
lowering its cost in this category, possibly by having the package not
include any per bag fees charged by the airline, letting the purchaser bear
the cost.
Room costs also comprise a major portion of total package costs. While
13-11
Chapter 13 – Cost Planning for the Product Life Cycle: Target Costing, Theory of Constraints, and Strategic Pricing
13-31 Target Costing Using QFD (20 min)
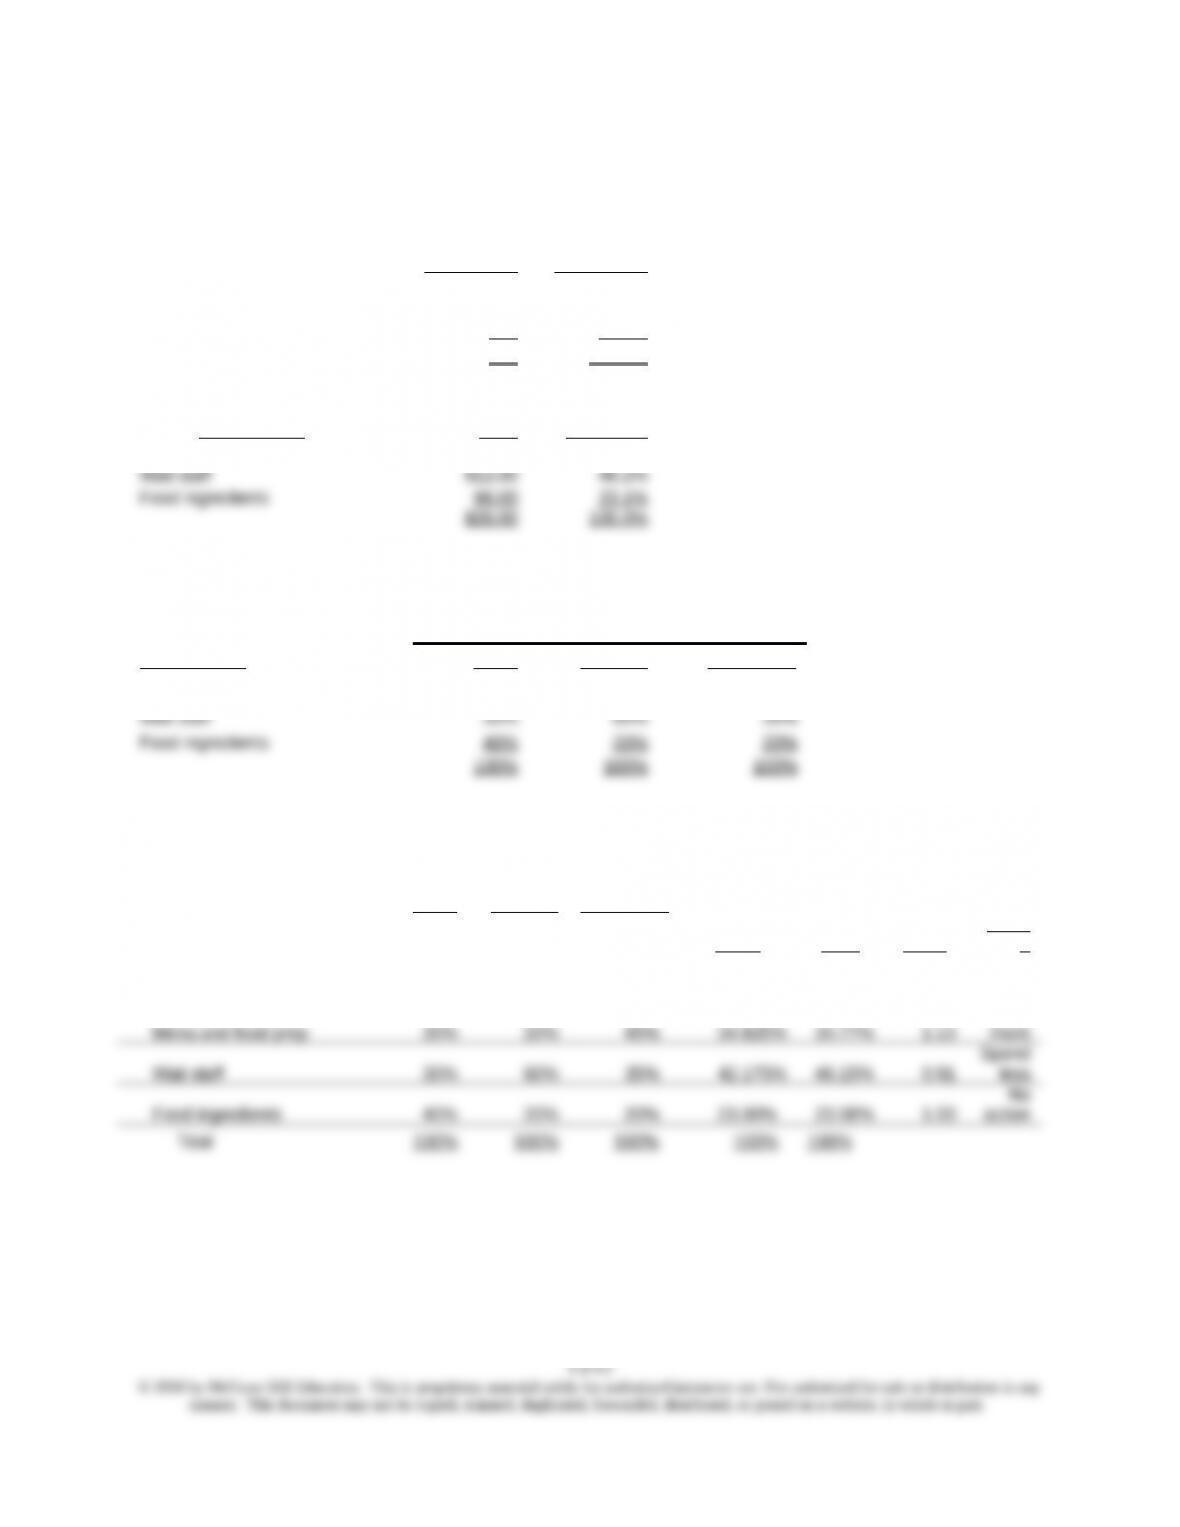
1. The calculations are shown below:
First: Customer Criteria and Ranking
Importance
Relative
Importance
Taste 45 15.0%
Comfort 95 31.7%
Enjoyment 160 53.3%
Total 300 100.0%
Second: Components and Cost
Components Cost % of Total
Menu and food preparation $8.00 30.8%
Third: Determine How Components Contribute to Customer Satisfaction
Customer
Criteria
Components Taste Comfort Enjoyment
Menu and food prep 30% 20% 45%
Fourth& Fifth: Determine Importance Index for Each Component and Compare to Relative Cost
Customer Criteria
Taste Comfort Enjoyment Importance Relative
Relative importance of criteria Index Cost Ratio
Actio
n
The % contribution of each 15.0% 31.7% 53.3%
component to each customer criterion:
Spend
2. The cost index for menu and food preparation is low relative to the
importance index, which indicates that Rick should consider spending more
time and cost on this activity. In contrast, the cost index for wait staff is
13-32 Manufacturing Cycle Efficiency (10 min)
MCE = total processing ime/total cycle ime
= 24 ÷ (24+2+6+3+1+5+2+6+2) = 24 ÷ 51 = 47.1%
Note that new product development time and order taking time are
not considered part of the manufacturing cycle and are excluded from
cycle time.
The level of MCE is best interpreted by reference to the prior MCE
values for the firm or to an industry average. A number closer to one
is better. When comparing to an industry average, management
13-13
Chapter 13 – Cost Planning for the Product Life Cycle: Target Costing, Theory of Constraints, and Strategic Pricing
13-33 Takt Time (10 min)
1. The Takt time for this product is the number of available hours ÷ total
demand.
Total manufacturing time ÷ 8,400
2. The processing line is not properly balanced. Operation 5 exceeds Takt
time by 4 sec. and Operation 2’s time is much less than Takt time. To
balance the line, so that products can be expected to come off the line
3. The strategic role of Takt time is to help operations managers to balance
the operations and to improve the speed of throughput and reduce cycle
time. The management accountant’s role is to provide information on the
13-14
13-34 Life Cycle Costing; Service Department (20 min)
Life cycle costing can be used in the cost management of the IT
department (or other service departments) over the life cycle of the
department’s assets. This is also called the management of the “total cost
of ownership” of the assets. The idea here is that the total cost of the IT
department is represented by many different elements, including assets,
personnel, management, and other costs.
As the strategic goals of the organization change, the focus on different
phases of the IT life cycle can change. For example, when the
organization experiences significant growth, the acquisition of new assets
in phases one and two is accelerated. At other times, the need for
increased focus on user support is important, as the firm faces challenges
13-15
Chapter 13 – Cost Planning for the Product Life Cycle: Target Costing, Theory of Constraints, and Strategic Pricing
13-35 Pricing (25 min)
The price, contribution, and profit information is as follows.
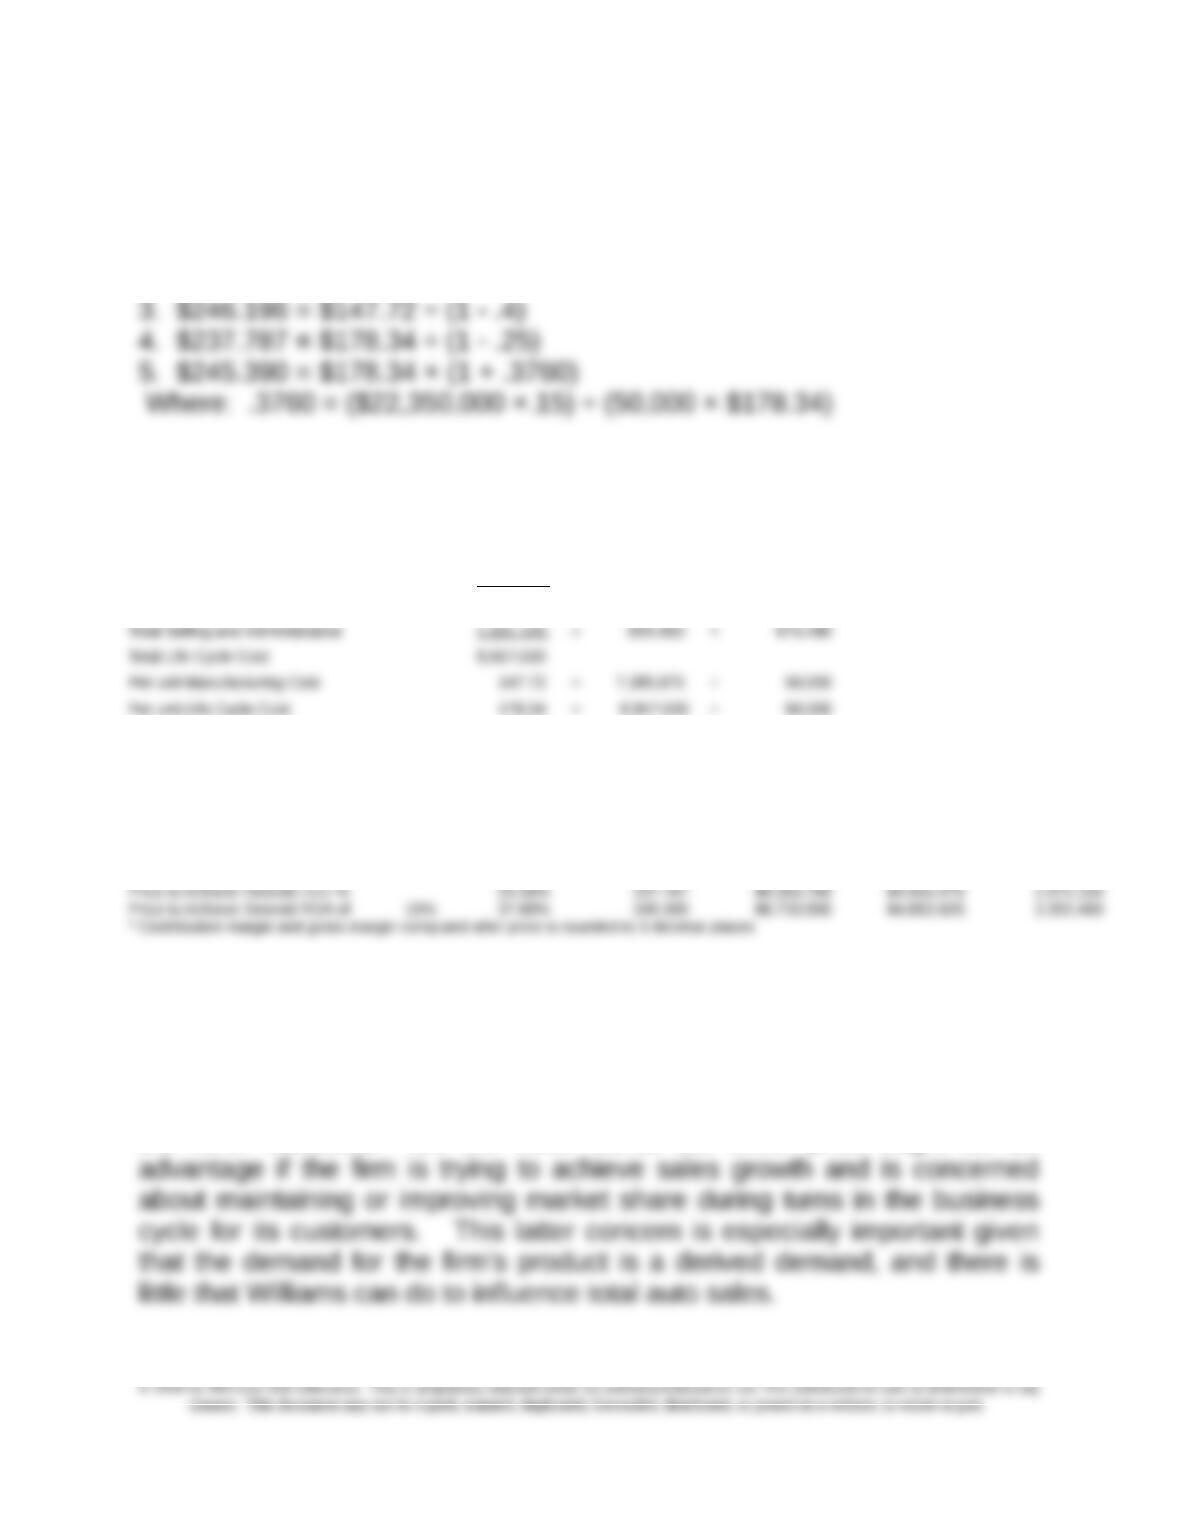
1. $214.190 = ($7,385,875 × 1.45) ÷ 50,000
2. $222.926 = ($8,917,020 × 1.25) ÷ 50,000
Total Investment in Product Line 22,350,000
Expected Sales (units) 50,000
Total Variable Costs $ 5,535,650 = $4,680,000 + 855,650
Total Fixed Costs 3,381,370 = 2,345,875 + 675,495 + 360,000
Total Manufacturing Cost 7,385,875 = $4,680,000 + 2,345,875 + 360,000
Desired
Rate Contribution Gross Operating
Method: for Markup Price Margin* Margin* Profit
Markup on full manufacturing cost 45% $ 214.190 $5,173,850 $3,323,625 1,792,480
Markup on life cycle costs 25% 222.926 $5,610,600 $3,760,375 2,229,230
Price to Achieve Desired GM % 40.00% 246.196 $6,774,150 $4,923,925 3,392,780
6. The contribution margin, gross margin, and operating profit are shown in
the right-hand portion of the table above.
The pricing methods yield prices from $214.190 to $246.196. The
next highest price, $245.390, has the advantage that it provides the desired
return on investment, a more precise statement of the firm’s goal than in
the other methods. On the other hand, the lower price might be an
13-16
Chapter 13 – Cost Planning for the Product Life Cycle: Target Costing, Theory of Constraints, and Strategic Pricing
13-36 Pricing Military Contracts (10 min)
This is a complex issue which Pentagon officers and congressional leaders
continue to squabble over. In this particular case, Senator McCain argued
that the contract should be re-written to reduce the fixed fee from 10% to
incentive fee).
As for whether the performance fee is too low or too high is a matter of
perspective. While Congress might think the old 5% incentive was too low,
contractors might think the new 12% incentive fee is too big a proportion of
the overall potential fee.
Source: “The Right Stuff for the GIs of the Future,” BusinessWeek, August
15, 2005, pp. 74-75.
13-17
Chapter 13 – Cost Planning for the Product Life Cycle: Target Costing, Theory of Constraints, and Strategic Pricing
13-37 Life-Cycle Pricing (20 min)
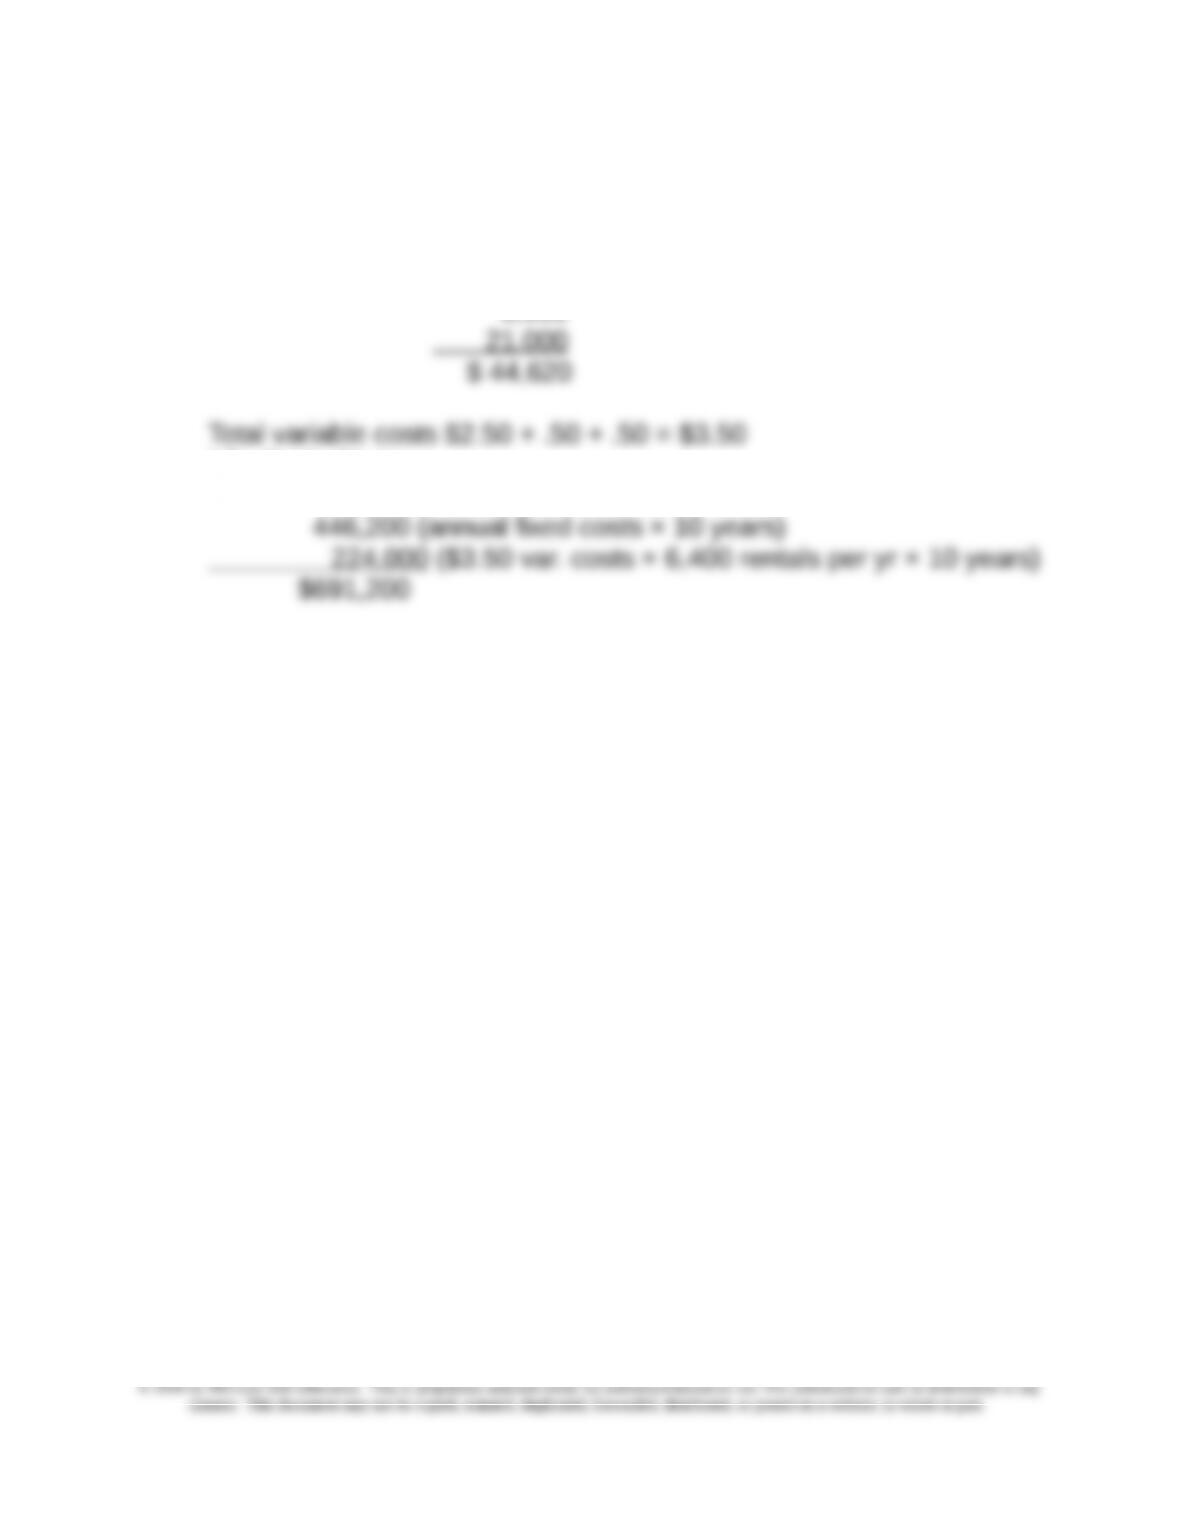
Total Fixed Costs $ 2,300
3,000
5,400
6,920
6,000
Life-Cycle Costs =
$ 21,000 for fleet of canoes
Life-Cycle Revenues needed for 20% return on life-cycle costs =
$691,200 × 1.2 = 829,440
Price per Rental for 20% return on life-cycle costs = $829,440 ÷
64,000 rentals in ten years = $12.96
13-18
Chapter 13 – Cost Planning for the Product Life Cycle: Target Costing, Theory of Constraints, and Strategic Pricing
PROBLEMS
13-38 Target Costing in a Service Firm (20 min)
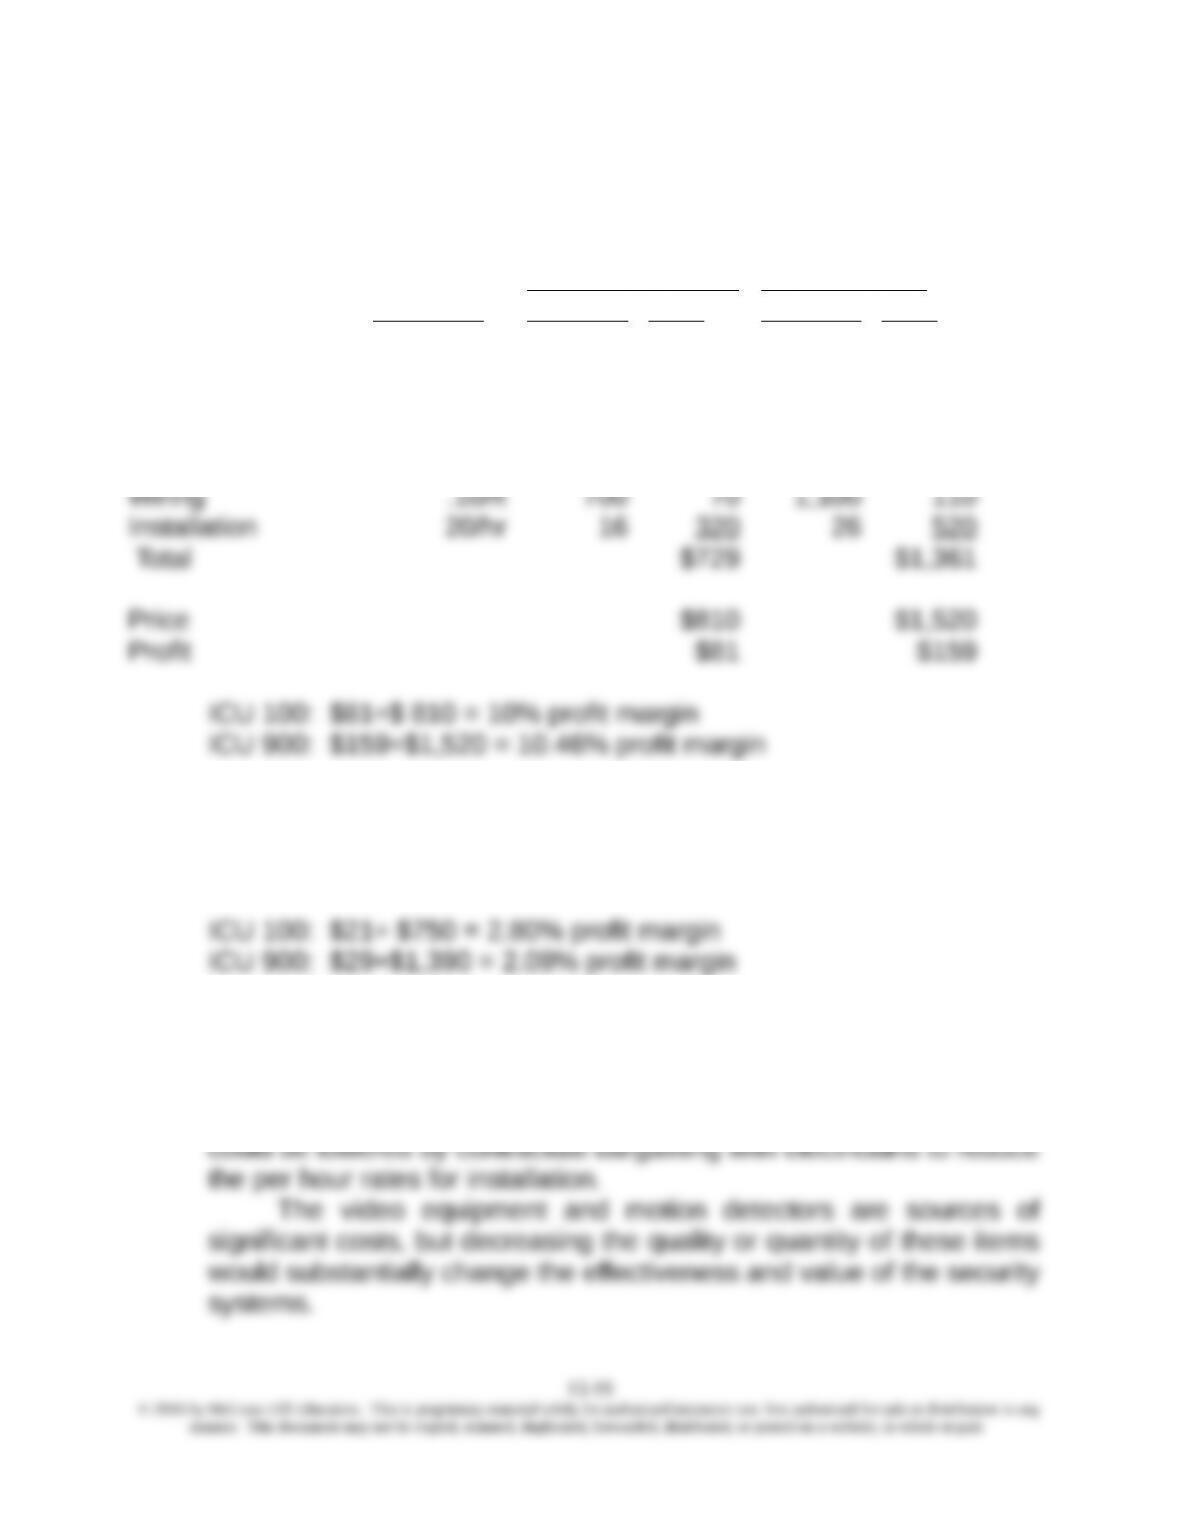
1.
ICU 100 ICU 900
Unit Cost Quantity Cost Quantity Cost
Video camera $ 150 1 $150 3 $450
Video monitor 75 1 75 1 75
Motion detector 15 5 75 8 120
Floodlight 8 3 24 7 56
Alarm 15 1 15 2 30
2.
Price $750 $1,390
Profit $21 $29
3. The installation costs are the largest component of cost and this
category could have room for improvement. By redesigning the
layout of the systems or finding components that integrate more
readily, the installation times could then be reduced. Also, costs
Chapter 13 – Cost Planning for the Product Life Cycle: Target Costing, Theory of Constraints, and Strategic Pricing
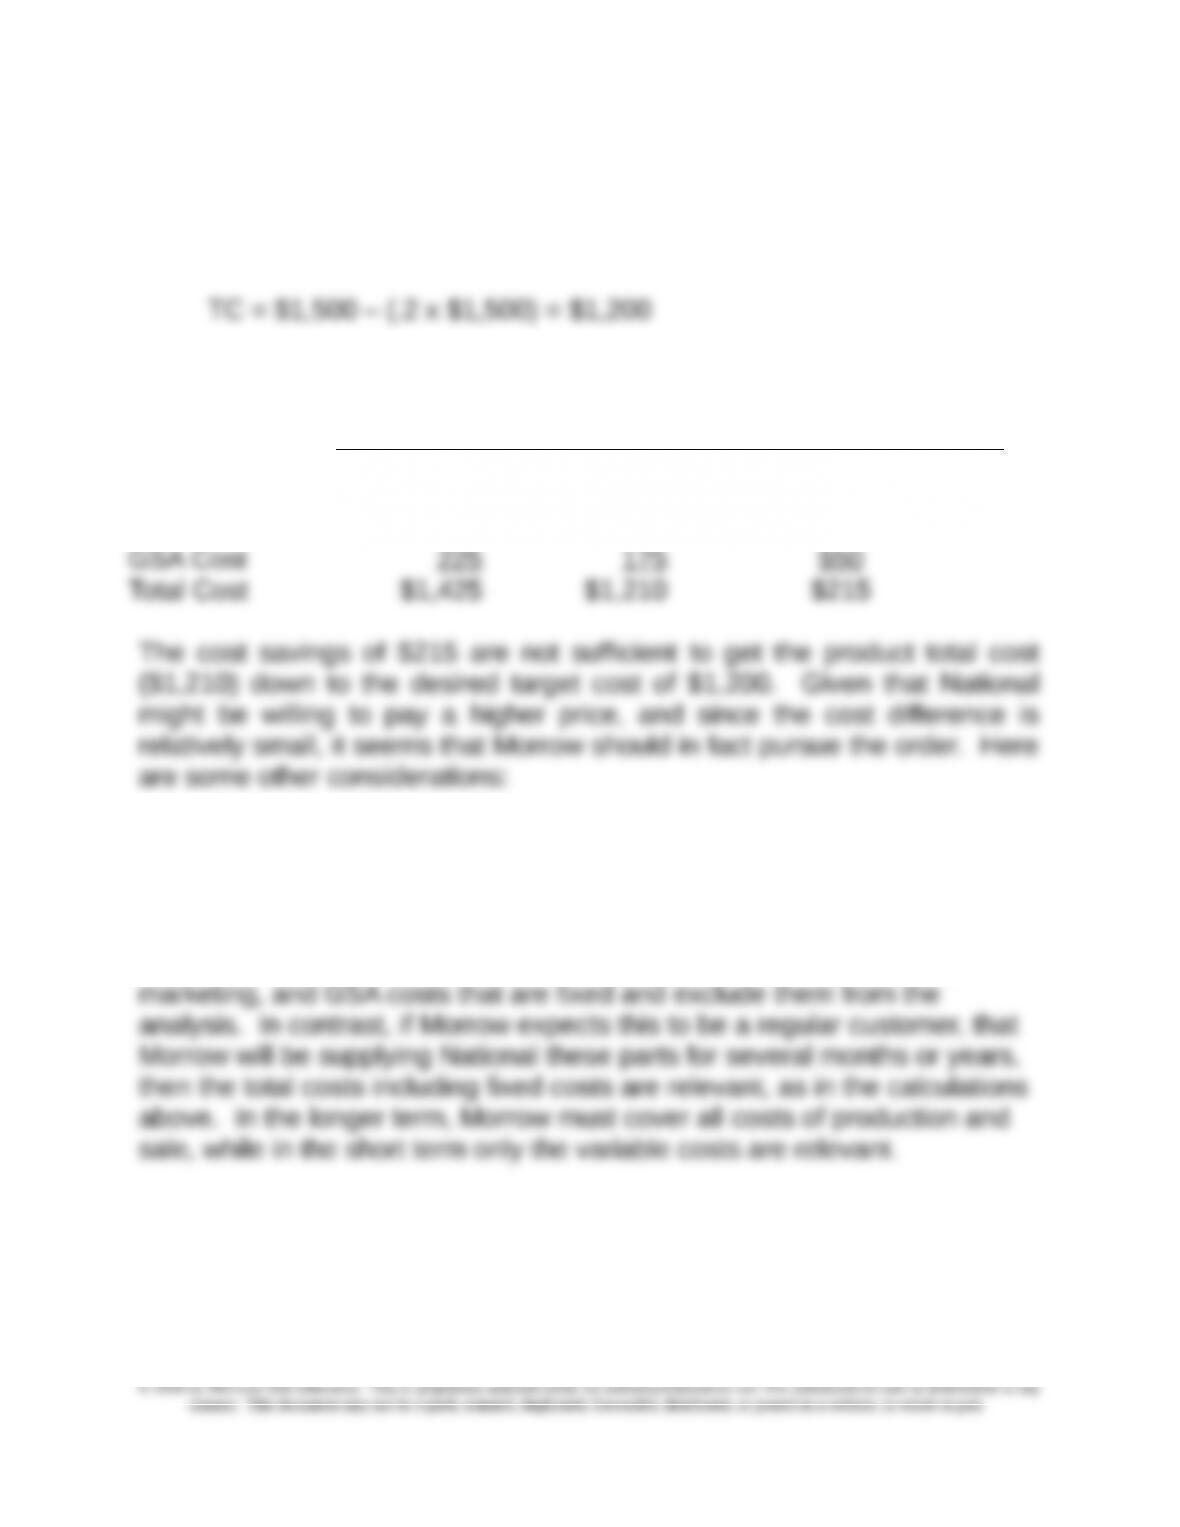
13-39 Target Costing; Review of Chapter 11 (20 min)
1. The target cost, at the price of $1,500 and the desired margin of 20%
would be
2.
Currently With Cost
Reductions
Savings
Manufacturing
Cost
$1,000 $835 ($85-$25)+$105= $165
Marketing Cost 200 200
a. Morrow should consider the short versus the long term issues of taking
on the order. In the short term, as noted in chapter 3, the fixed costs of
manufacturing the order will not change and therefore can be considered
irrelevant for the order if it is a one-time special order. Thus, for a short
term analysis, Morrow should determine that portion of manufacturing,
13-20