Chapter 12 – Strategy and the Analysis of Capital Investments
12-54 (Continued–1)
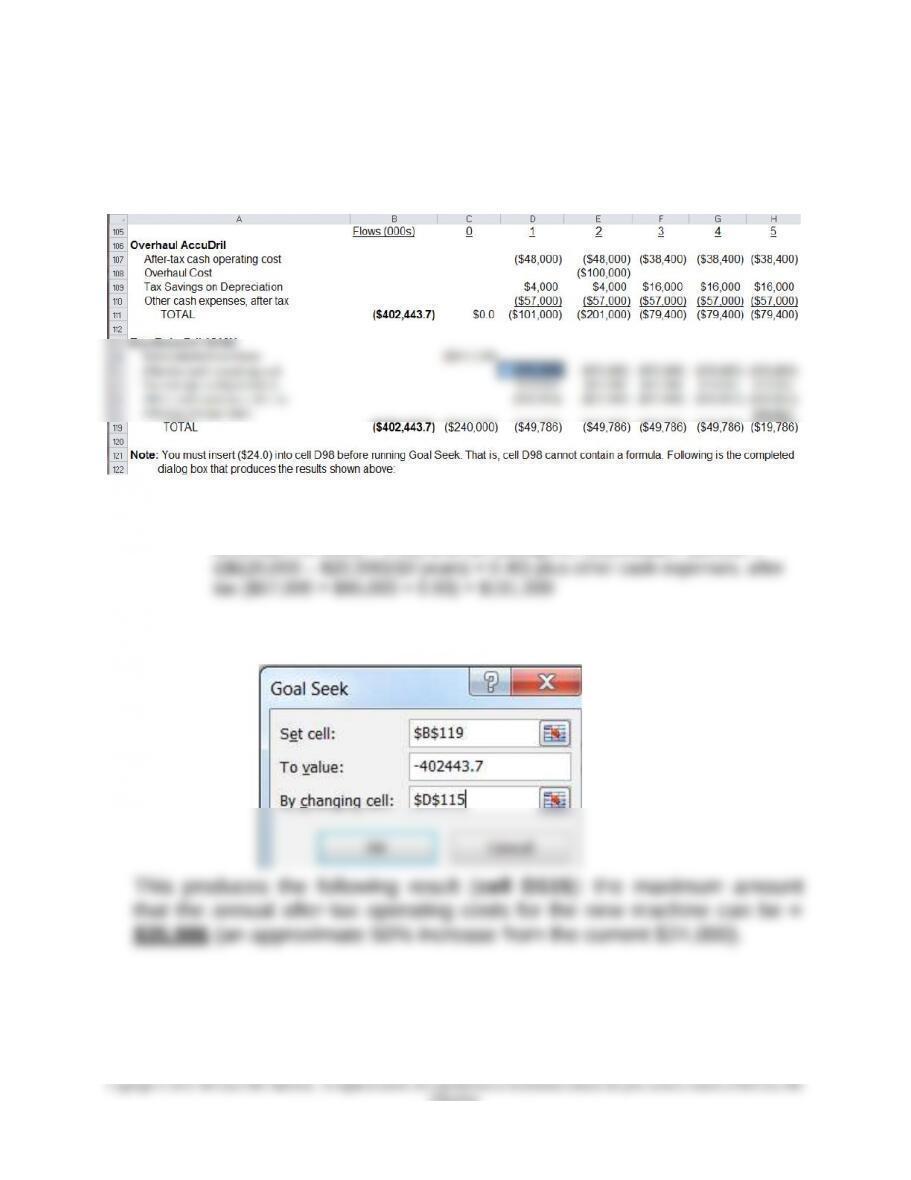
2. The following spreadsheet excerpt contains the PV of each alternative:
Sample Calculation:
Cell D111 = after-tax cash operating cost ($48,000 = (8,000 machine hours ×
$10/machine hour) × 0.60) less tax savings on depreciation ($4,000 =
Then, use the following Goal Seek commands in Excel:
12-83
Education.
Chapter 12 – Strategy and the Analysis of Capital Investments
12-54 (Continued-2)
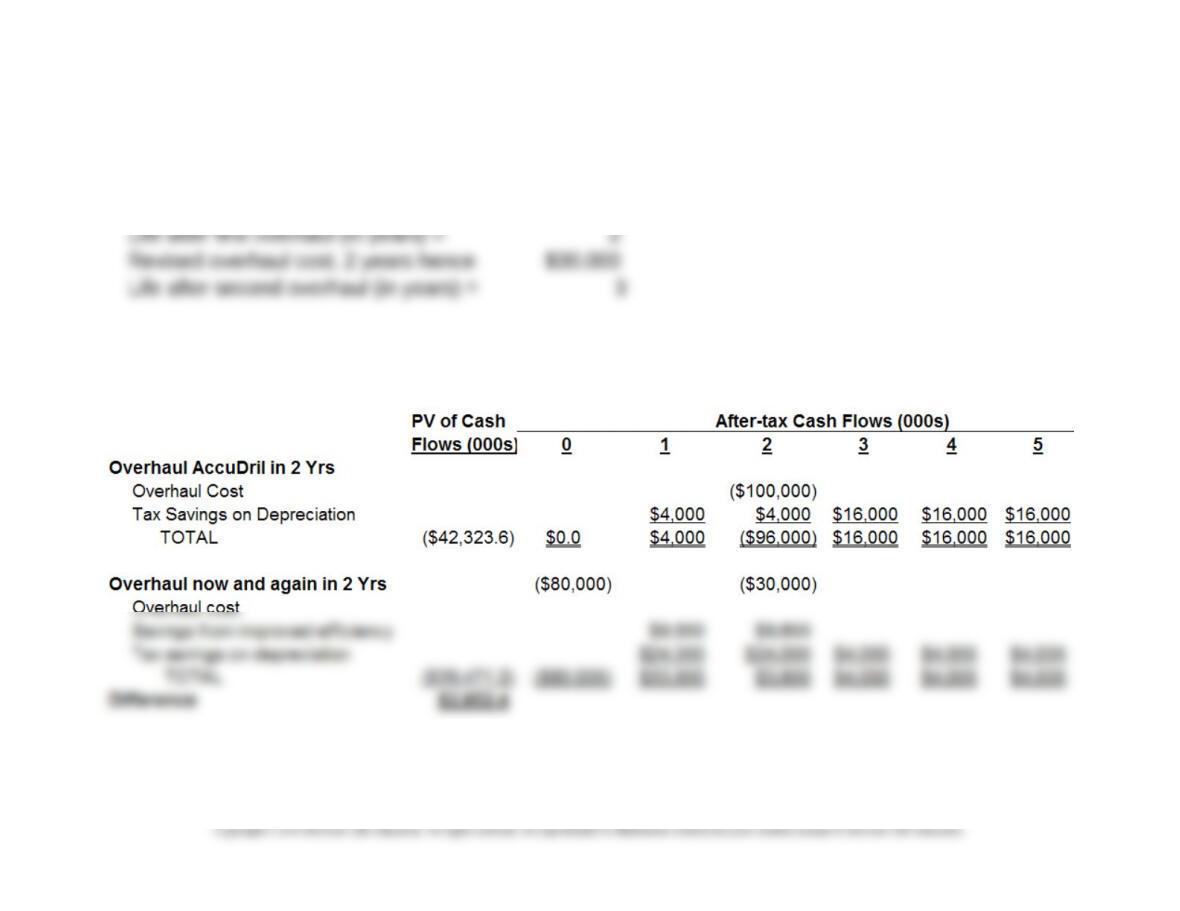
3. Alternative facts:
Revised overhaul cost = $80,000
Note: the PV cash-flow amounts listed below (viz., ($42,323.6) and ($39,471.2)) were generated using
the NPV built-in function in Excel
12-84
Chapter 12 – Strategy and the Analysis of Capital Investments
12-54 (Continued-3)
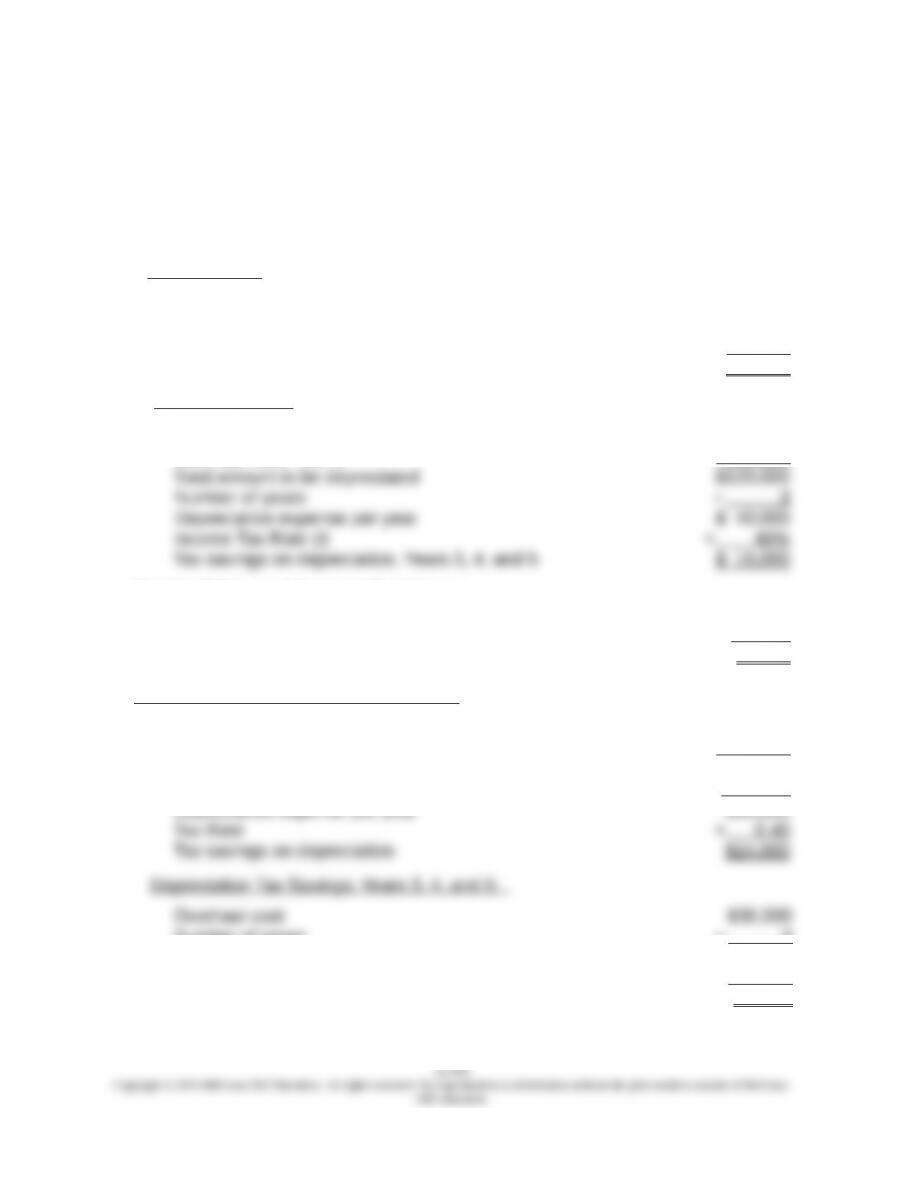
Calculations for the above are from part (1), Problem 12-53,
reproduced as follows:
Overhaul in 2 Years
Years 1 and 2:
Depreciation expense per year (SL basis):
($120,000 – $20,000) 10 years = $10,000
Income Tax Rate (t) × 0.40
Tax savings on depreciation, Years 1 and 2 $ 4,000
Years 3, 4, and 5:
Book value before overhaul (end of original useful life) $ 20,000
Overhaul cost, Year 3 100,000
Overhaul Now and Again in Two Years:
Savings from the improved productivity = $10/hr. × 8,000 hours × 20% = $16,000
Less: Income Taxes on the savings (@40.0%) = – 6,400
After-tax savings $9,600
Depreciation Tax Savings: Years 1 and 2:
Book value at the time of overhaul: $10,000 × 2 + $20,000 = $ 40,000
Overhaul cost + 80,000
Total amount to be depreciated $120,000
Number of years 2
Depreciation expense per year $60,000
Number of years 3
Depreciation expense per year $10,000
Income tax Rate × 0.40
Tax savings on depreciation $ 4,000
Chapter 12 – Strategy and the Analysis of Capital Investments
12-54 (Continued-4)
4. As a follow-up to (3) above: although the cost difference between
the two alternatives is only $2,852.4, which is less than 0.3% of
12-86
Hill Education.
Chapter 12 – Strategy and the Analysis of Capital Investments
12-55 Comparison of Capital-Budgeting Techniques, Sensitivity Analysis
(75 minutes)
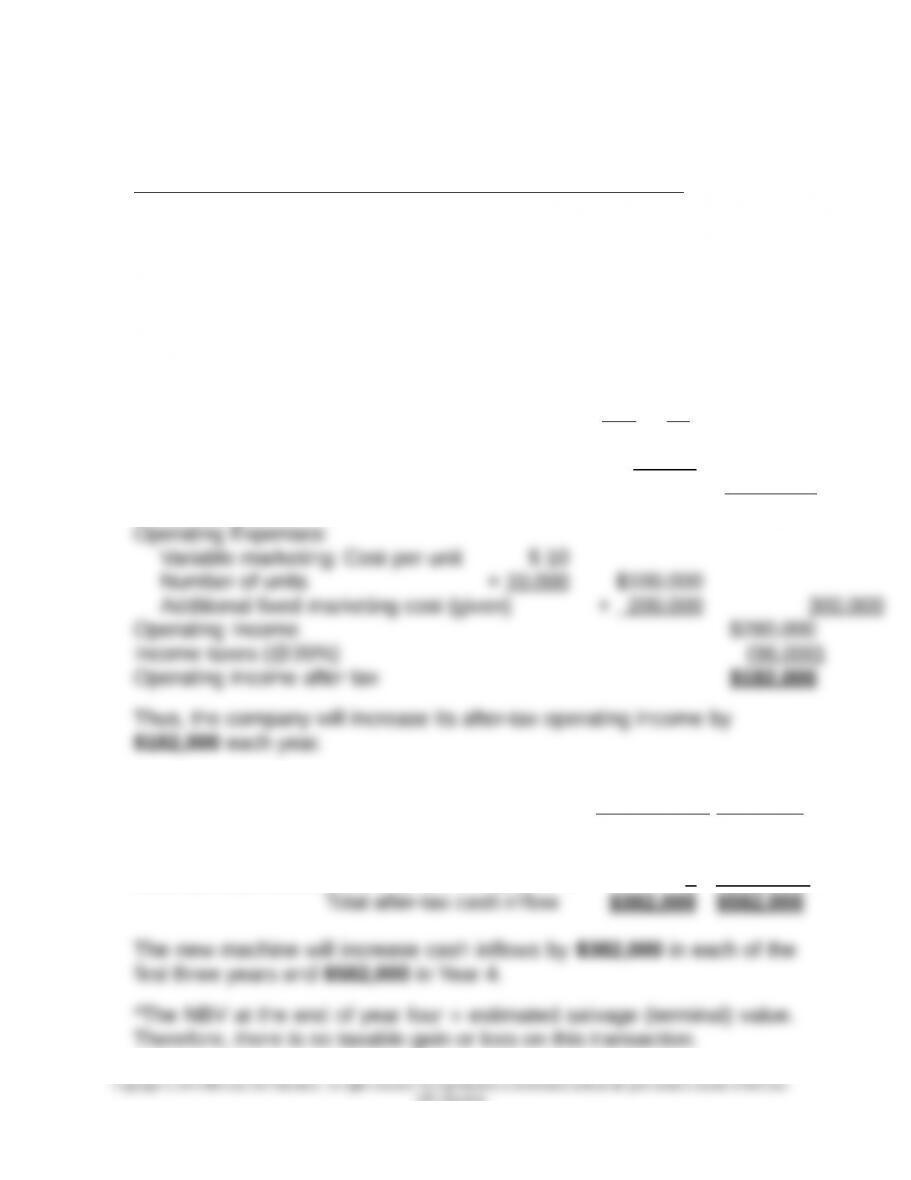
1. Effects of the new equipment on operating income after tax:
Sales $200 × 10,000 = $2,000,000
Cost of goods sold:
Variable manufacturing costs per unit $ 97
Fixed manufacturing costs per unit:
Additional fixed manufacturing overhead:
$250,000 ÷ 10,000 units = $25
Depreciation on new equipment, per unit:
($1,000,000 – $200,000) ÷ 4 = $200,000/year
$200,000 ÷ 10,000 units per year = 20 $ 45
Total manufacturing cost per unit (@ 10,000 units) $142
Times: Number of units × 10,000
Total cost of goods sold (CGS) 1,420,000
Gross margin $ 580,000
2. Years
1 to 3 Year 4
After-tax operating income (see #1 above) $182,000 $182,000
Add: increased depreciation expense (SL basis) 200,000 200,000
After-tax cash inflow from disposal of equipment 0 200,000*
12-87
Hill Education.

Chapter 12 – Strategy and the Analysis of Capital Investments
12-88
Hill Education.
Chapter 12 – Strategy and the Analysis of Capital Investments
12-55 (Continued-1)
3. Under the assumption that cash inflows occur evenly throughout the
year, the payback period is as follows:
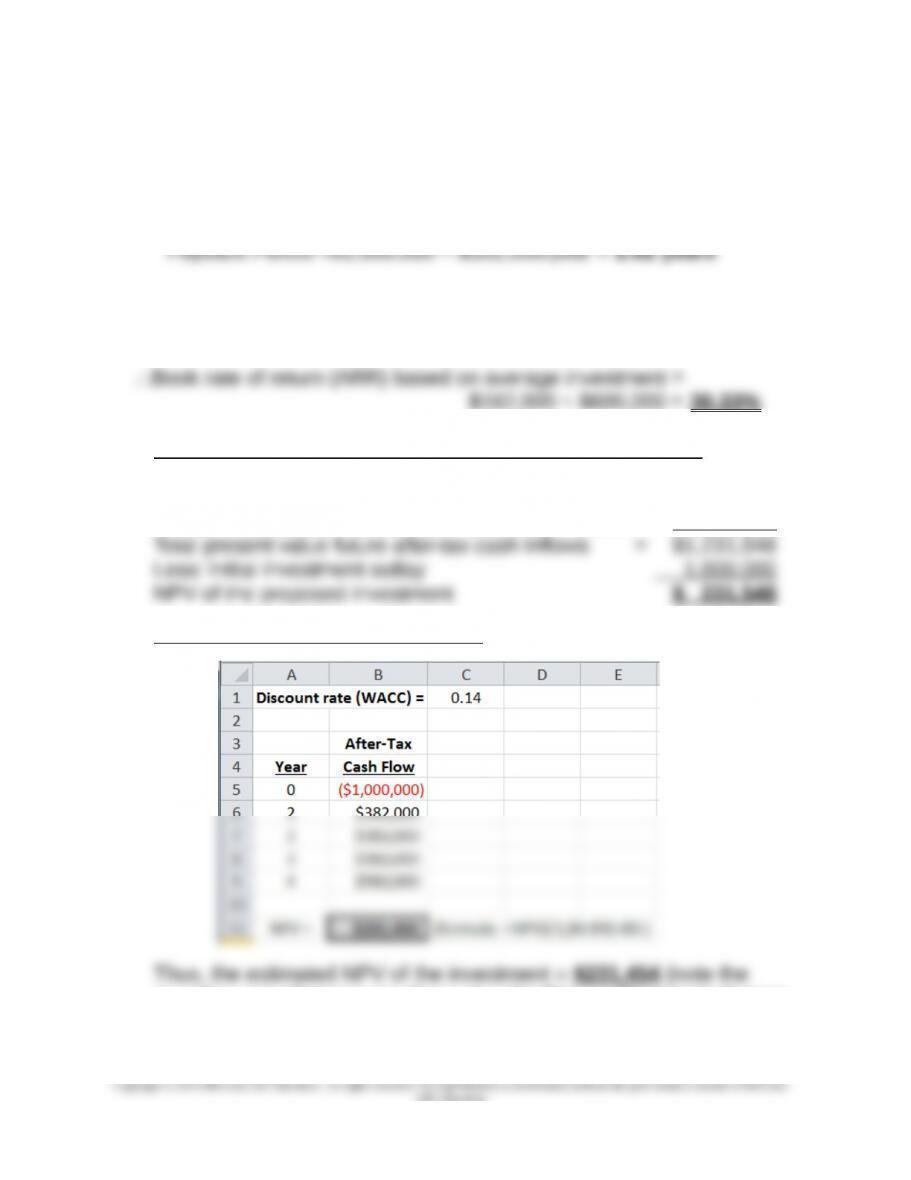
4. Average investment = ($1,000,000 + $200,000) ÷ 2 = $600,000
Average after-tax operating income = $182,000
5. Using PV and Annuity Tables (Chapter 12, Appendix C):
PV of after-tax cash inflows (@14%):
Years 1 through 3: $382,000 × 2.322 = $ 887,004
Year 4: $382,000 + $200,000 = $582,000 × 0.592 = 344,544
Using the NPV Function in Excel:
rounding error that occurs when using the PV and PV annuity factors
from Chapter 12, Appendix C rather than the NPV built-in function in
Excel)
12-89
Hill Education.
Chapter 12 – Strategy and the Analysis of Capital Investments
12-55 (Continued-2)
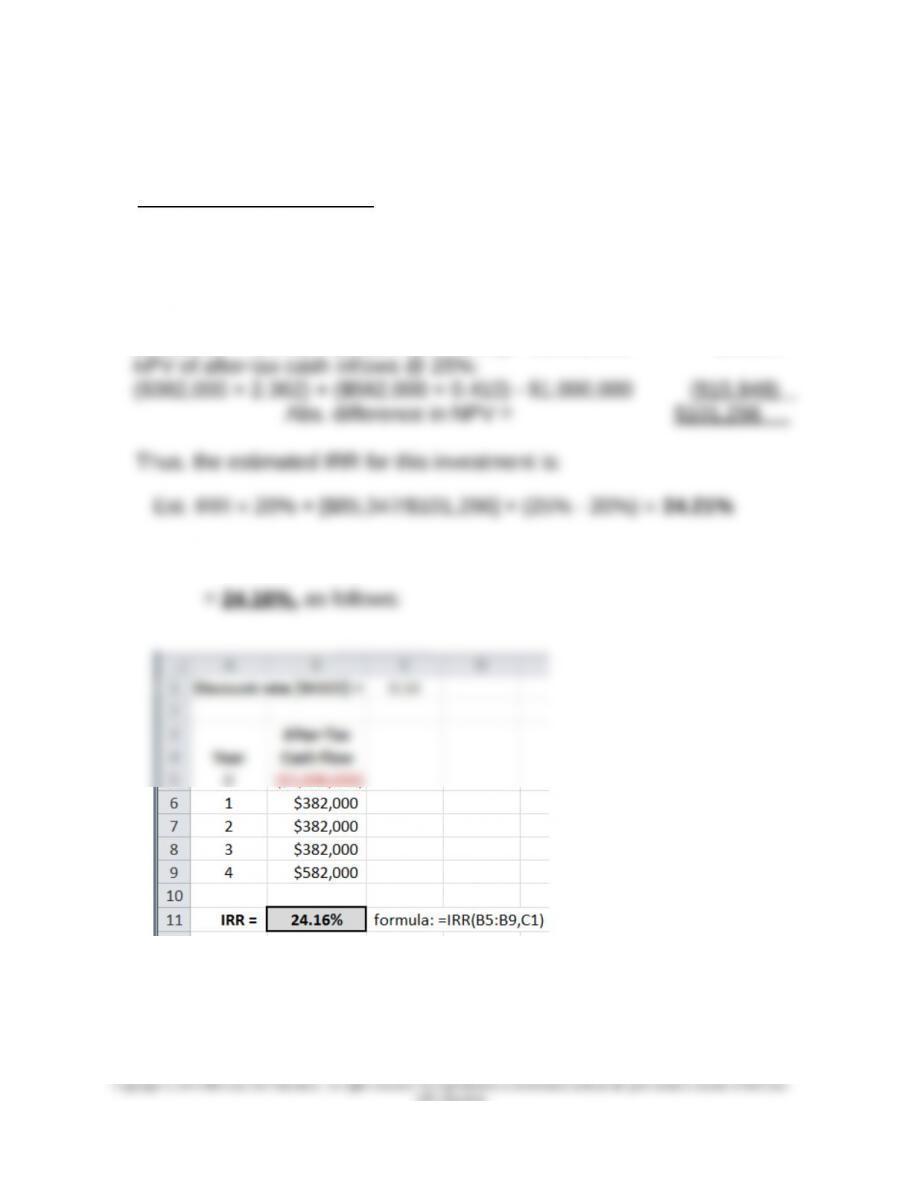
6. Trial-and-Error Approach (initial investment outlay = $1,000,000)—
choose two discount rates (by trial and error) and compute NPV; we
are looking for a discount rate that results in an NPV of $0. Here, we
chose 20% and 25%:
NPV of after-tax cash inflows @ 20%:
($382,000 × 2.589) + ($582,000 × 0.482) – $1,000,000 $85,347
Based on the built-in function in Excel, the estimated IRR of this project
12-90
Hill Education.
Chapter 12 – Strategy and the Analysis of Capital Investments
12-55 (Continued-3)
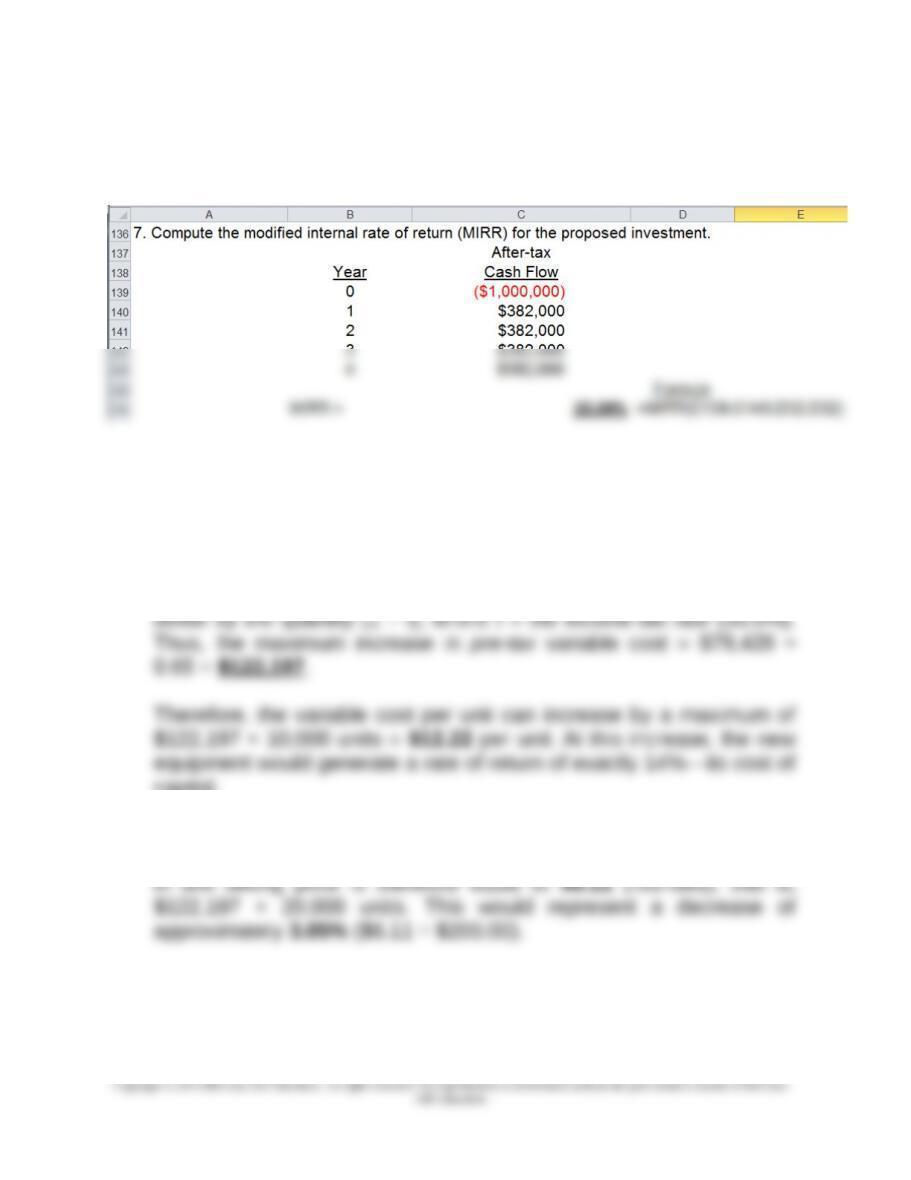
7. The modified internal rate of return (MIRR) = 20.09%, as follows:
8. a. Based on an estimated NPV of $231,548 (part 5, above), the PV of
any after–tax increase in variable costs associated with units
produced by the new machine = $231,548. Thus, the annual after-tax
increase that would be permissible = $231,548 ÷ 2.914 = $79,428.
To convert this annual cost to a pre-tax basis, we would have to
capital.
b. The maximum pre-tax decrease in selling price = $154,466 (see (a)
above). On a per-unit basis, for all units sold, the maximum decrease
9. Strategic considerations–-among the additional factors to be considered:
What is the associated risk of not expanding capacity? (e.g., loss
of market share, achievement by competitors of increased
12-91

Chapter 12 – Strategy and the Analysis of Capital Investments
12-55 (Continued-4)
operating efficiencies due to economies of scale, lost opportunity
for Nil Hill to cross-sell to new customers, etc.)
Are there any “real options” embedded in this investment decision
(beyond the abandonment option included in the basic analysis)?
In the absence of increased volume, would Nil Hill be able to
match the anticipated lower prices by competitors?
Are there any strategic factors associated with this investment?
a) Impact of the new equipment on customer response time?
b) Impact of the new equipment on plant safety?
c) Impact of the new equipment on environmental
performance/
management?
d) Impact of the new equipment on process (i.e.,
manufacturing) cycle time?
e) Impact of the new equipment on quality of outputs (e.g., %
of first-pass yield or PPM defects)?
f) Are there any more profitable uses of the existing space?
That is, would this space best be used to increase capacity
of the particular product in question?
12-92
Hill Education.