Unlock document.
This document is partially blurred.
Unlock all pages and 1 million more documents.
Get Access
Chapter 12 - Strategy and the Analysis of Capital Investments
EXERCISES
12-28 Determining Relevant Cash Flows: Asset-Purchase Decision (25 minutes)
1. Net cash outflow, project initiation (time period 0):
Cost of new machine $2,500,000
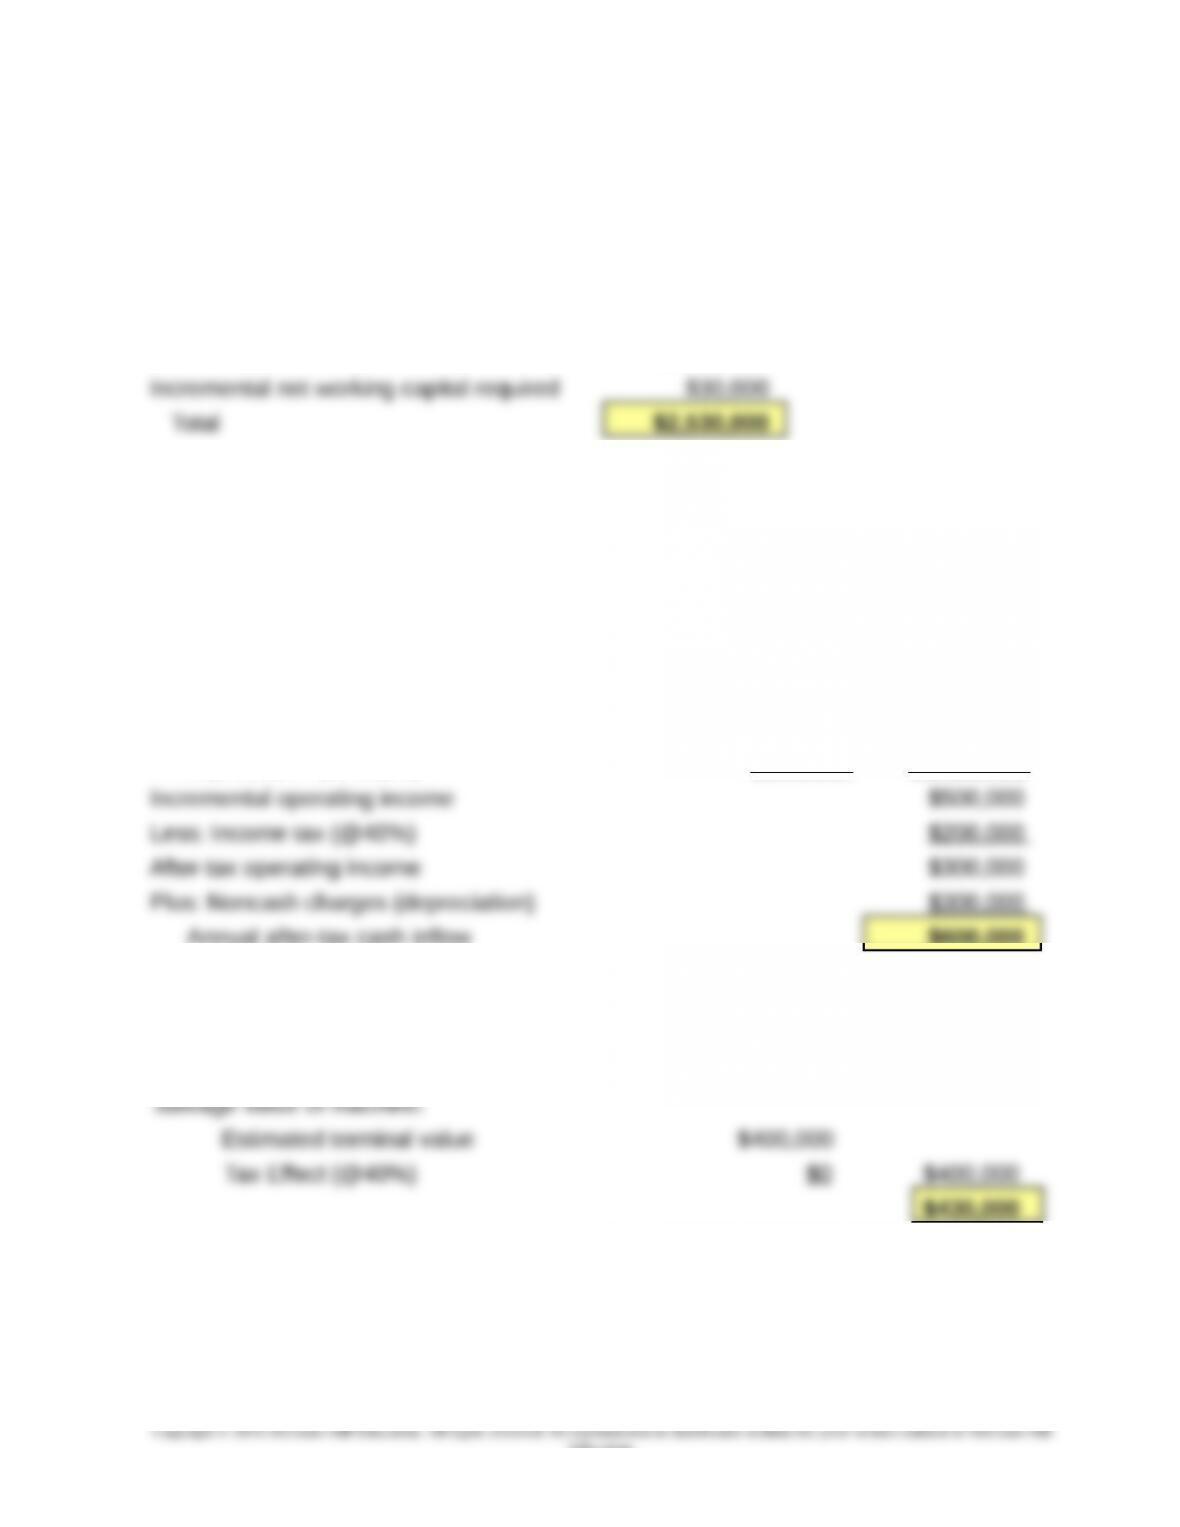
2. Annual after-tax cash inflow (time periods 1 through 7):
Incremental cash revenues $3,600,000
Incremental cash expenses:
Overhead $400,000
Raw materials $1,200,000
Labor (1/3 × $3,600,000) $1,200,000
Incremental non-cash expenses:
Depreciation (SL basis) $300,000 $3,100,000
Annual after-tax cash inflow $600,000
3. Project termination (end of year 7):
Recovery of incremental investment in net working capital $30,000
4. Irrelevant items: All costs and revenues of the existing product line, and the original
investment of the existing division that continues. (We are told to assume that neither of
these would be affected by the decision to add the complementary product line.)
12-11
Education.
Chapter 12 - Strategy and the Analysis of Capital Investments
12-29 Value of Accelerated Depreciation (40 minutes)
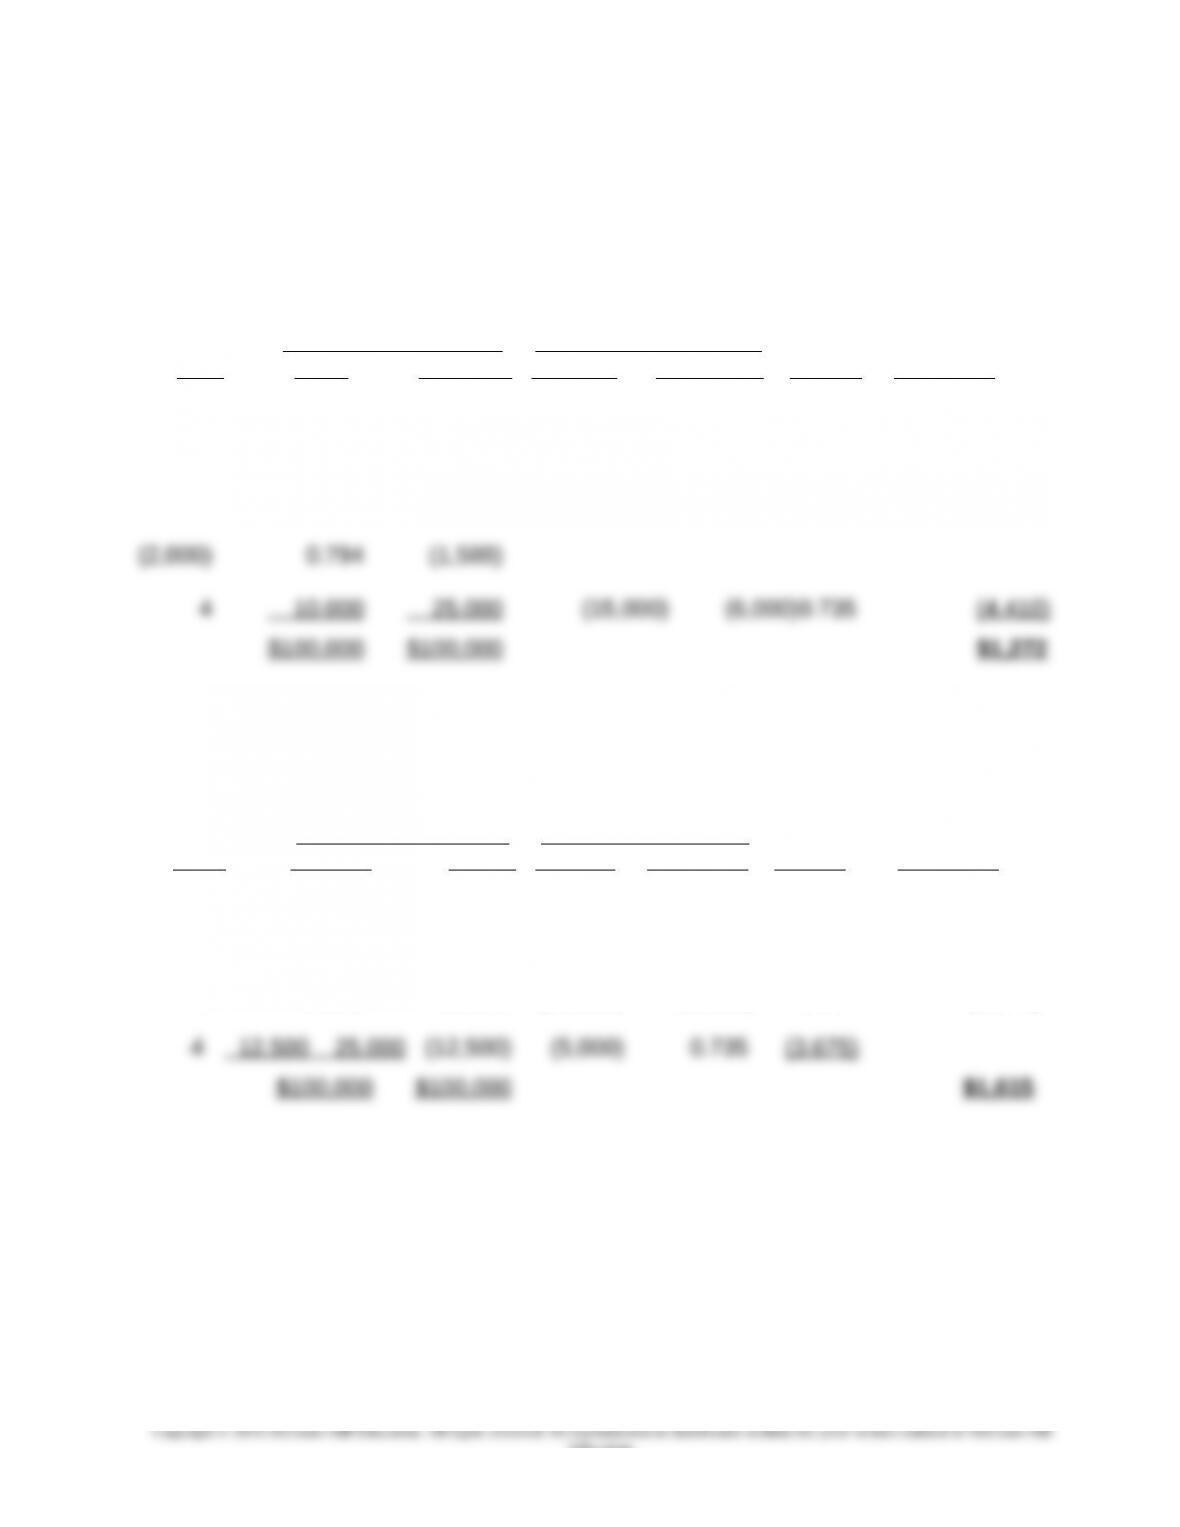
1. The incremental PV of using SYD depreciation rather than SL depreciation, at a
discount rate of 8%, is $1,272, as follows:
PV
Depreciation Method Difference Factor PV of
Year SYD S-L Amount Tax Effect at 8% Tax Effect
1 $40,000 $25,000 $15,000 $6,0000.926 $5,556
2 30,000 25,000 5,000 2,000 0.857 1,714
3 20,000 25,000 (5,000)
2. The incremental PV of using DDB depreciation rather than SL depreciation, at a
discount rate of 8%, is $1,615, as follows:
PV
Depreciation Method Difference Factor PV of
Year DDB S-L Amount Tax Effect at 8% Tax Effect
1 $50,000 $25,000 $25,000 $10,000 0.926 $9,260
2 25,000 25,000 - 0 - - 0 - 0.857 -0-
3 12,500 25,000 (12,500) (5,000) 0.794 (3,970)
12-12
Education.
Chapter 12 - Strategy and the Analysis of Capital Investments
12-29 (Continued)
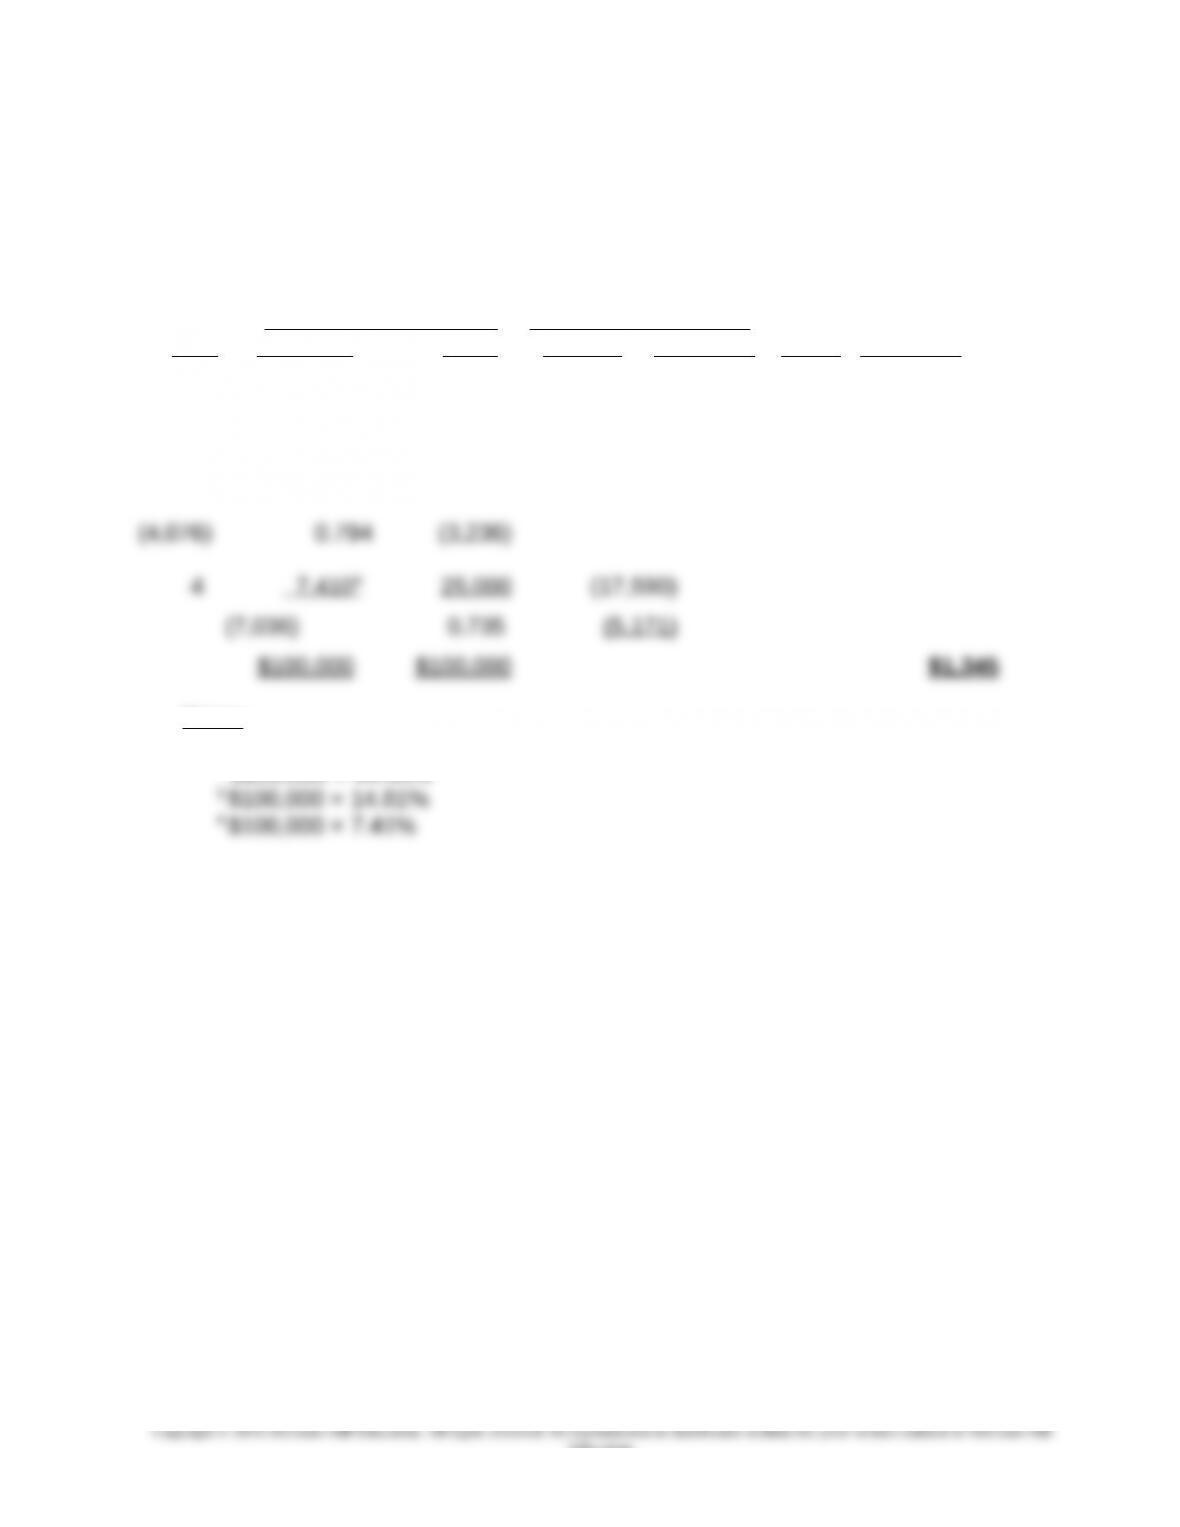
3. The incremental PV of using MACRS depreciation, rather than SL depreciation, at a
discount rate of 8%, is $1,345, as follows:
PV
Depreciation Method Difference Factor PV of
Year MACRS S-L Amount Tax Effect at 8% Tax Effect
1 $33,3301$25,000 $8,330 $3,332 0.926 $3,085
2 44,450225,000 19,450 7,7800.857 6,667
3 14,810325,000 (10,190)
Notes:
1 $100,000 × 33.33%
2 $100,000 × 44.45%
12-13
Education.
Chapter 12 - Strategy and the Analysis of Capital Investments
12-30 Cash Receipts Frequency and Present-Value Consequences (30 minutes)
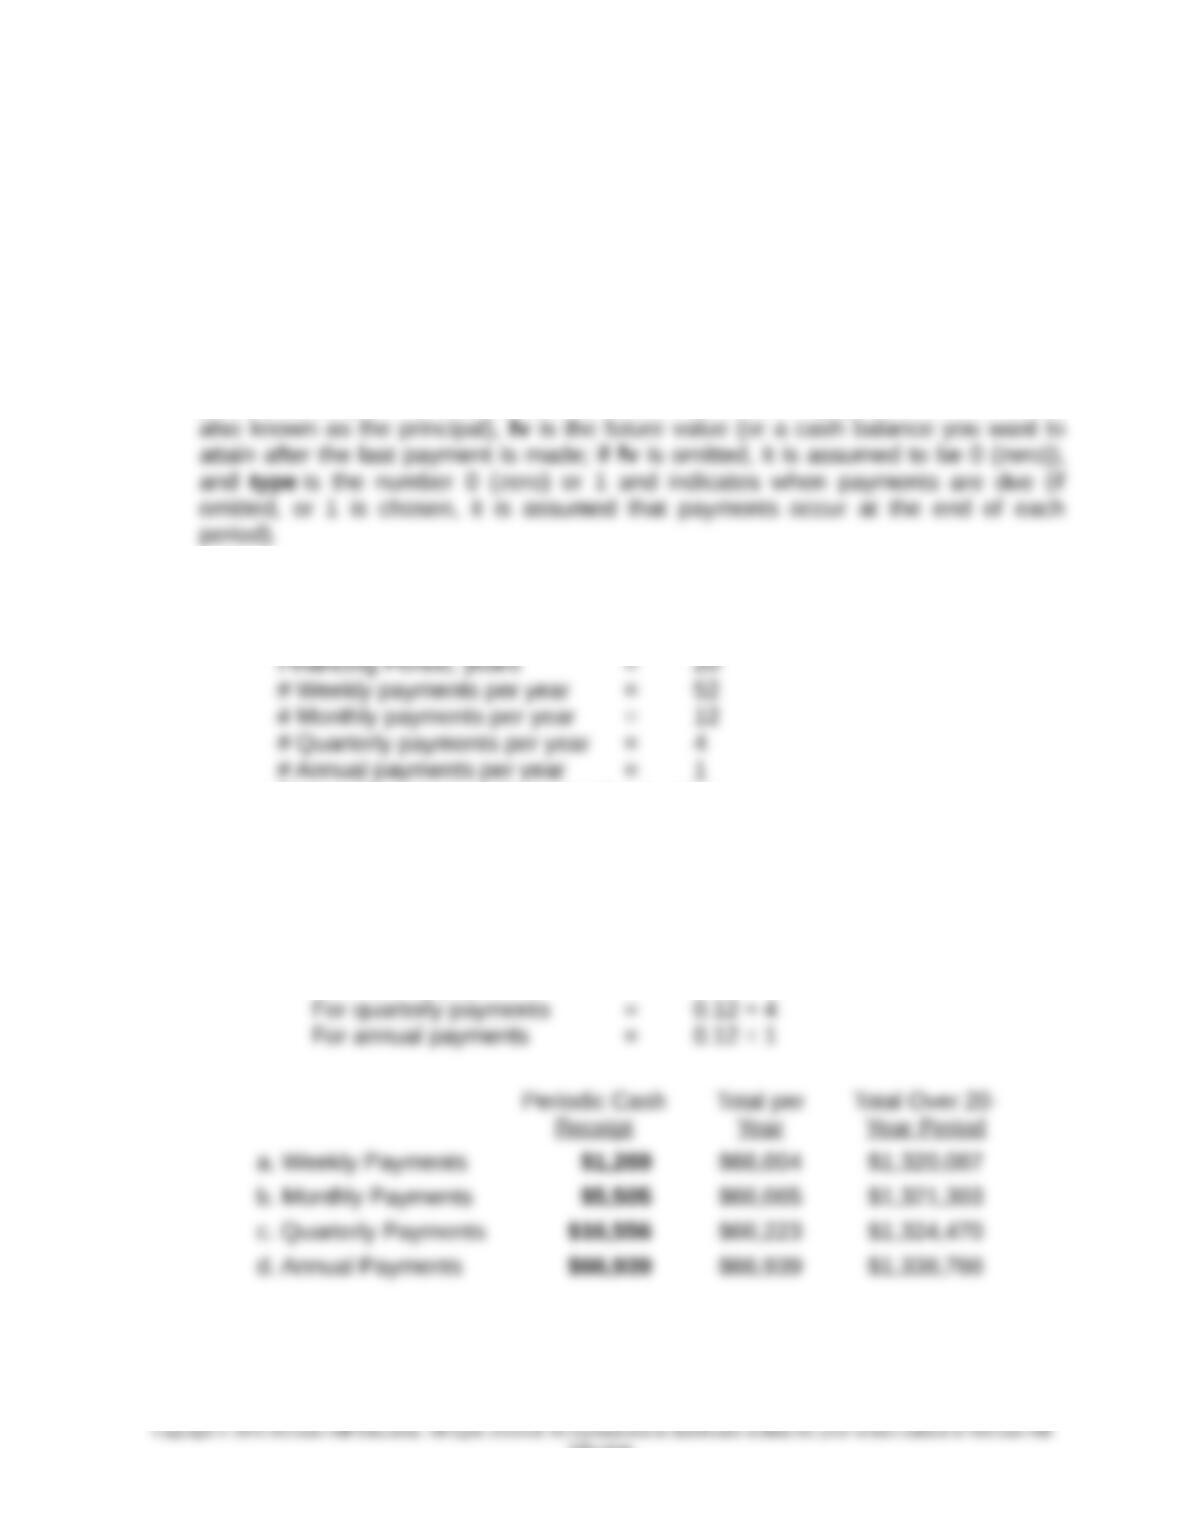
1. Periodic cash receipts, to earn a 12% return, if payments are received from the
purchaser for each of the listed situations. NOTE: the PMT function in Excel was
used to generate the periodic cash payment/receipt for each of the following cases.
Manual calculations may vary from these results.
PMT(rate,nper,pv,fv,type)
Rate is the interest rate for the loan, nper is the total number of payments, pv is the
present value (i.e., the total amount that a series of future payments is worth now;
Input Data:
Sales Price (present value, pv) = $500,000
Required Pre-tax Return = 12.00%
Nper = 20 years × # of payments per year:
For weekly payments, Nper = 1,040
For monthly payments, Nper = 240
For quarterly payments, Nper = 80
For annual payments, Nper = 20
Rate:
For weekly payments = 0.12 ÷ 52
For monthly payments = 0.12 ÷ 12
12-14
Education.
12-30 (Continued)
2. What general conclusion can you draw based on the calculations above in (1)?
Money has a time value. As such, cash received earlier (e.g., on a quarterly basis rather
than an annual basis) has a greater value to the recipient (who, for example, could
invest those receipts). Therefore, when payments are made more frequently, a lower
annual amount will occur. As seen from the data above, total cash paid/received over
Education.
Chapter 12 - Strategy and the Analysis of Capital Investments
12-31 Weighted-Average Cost of Capital (WACC) (25 minutes)
a. Bond interest expense before tax = $5,000,000 × 9% = $450,000
Income tax savings on bond interest expense = $450,000 × 30% = 135,000
After-tax bond interest expense = $315,000
b. After-tax cost of preferred stock = dividend per share/market price per share
c. Using weights based on the current market values of debt and equity, the estimated
WACC for this firm is 13.08%, as follows:
Interest After-tax
or Rate or Current Cost of
Dividend Expected Market Capital
Book Value Rate Return Values Weights Components
Bond $5,000,000 9% 5.73% $5,500,000 0.275 1.58%
Preferred
12-16
Chapter 12 - Strategy and the Analysis of Capital Investments
12-32 After-Tax Net Present Value (NPV) and IRR (non-MACRS rules) (45 minutes)
1. a. Net cash inflow each year: $62,000 – $30,000 = $32,000
Present value of net cash inflows (@10%) = $32,000 × 3.170 = $101,440
b. Net cash inflow before depreciation $32,000
Depreciation expense ($60,000 ÷ 4 years) 15,000
Increase in net income before tax $17,000
Income tax rate × 30%
c. Double-declining balance depreciation (non-MACRS):
Beginning Depreciation Accumulated Ending
Year Book Value Expense Depreciation Book Value
0 $60,000
1 $60,000 $30,000 $30,000 30,000
Pre-Tax DDB 30% After-tax 10%
Cash Depreciation Taxable Income Net Cash Discount Present
Year Inflows Expense Income Taxes Inflow Factor Values
0 ($60,000) ($60,000)1.000 ($60,000)
12-17
Education.
Chapter 12 - Strategy and the Analysis of Capital Investments
12-32 (Continued-1)
2. a. Net cash inflow each year: $62,000 – $30,000 = $32,000
$60,000 = $32,000 × A?, 4
A?, 4 = 1.875, which corresponds to a rate of return > 30%.
Using the IRR function of Excel, IRR = 39.08%, as follows:
b. Net cash inflow before depreciation $32,000
Depreciation expense ($60,000 ÷ 4 years) 15,000
Increase in net income before tax $17,000
Income tax rate × 30%
We can also use the annuity tables in the text (Appendix C), and interpolation, to
estimate the project’s IRR, as follows:
Discount Rate Discount Factor
25% 25% 2.362 2.362
? 2.230
30% 2.166
Difference 5% ? 0.196 0.132
12-18
Education.
Chapter 12 - Strategy and the Analysis of Capital Investments
12-32 (Continued-2)
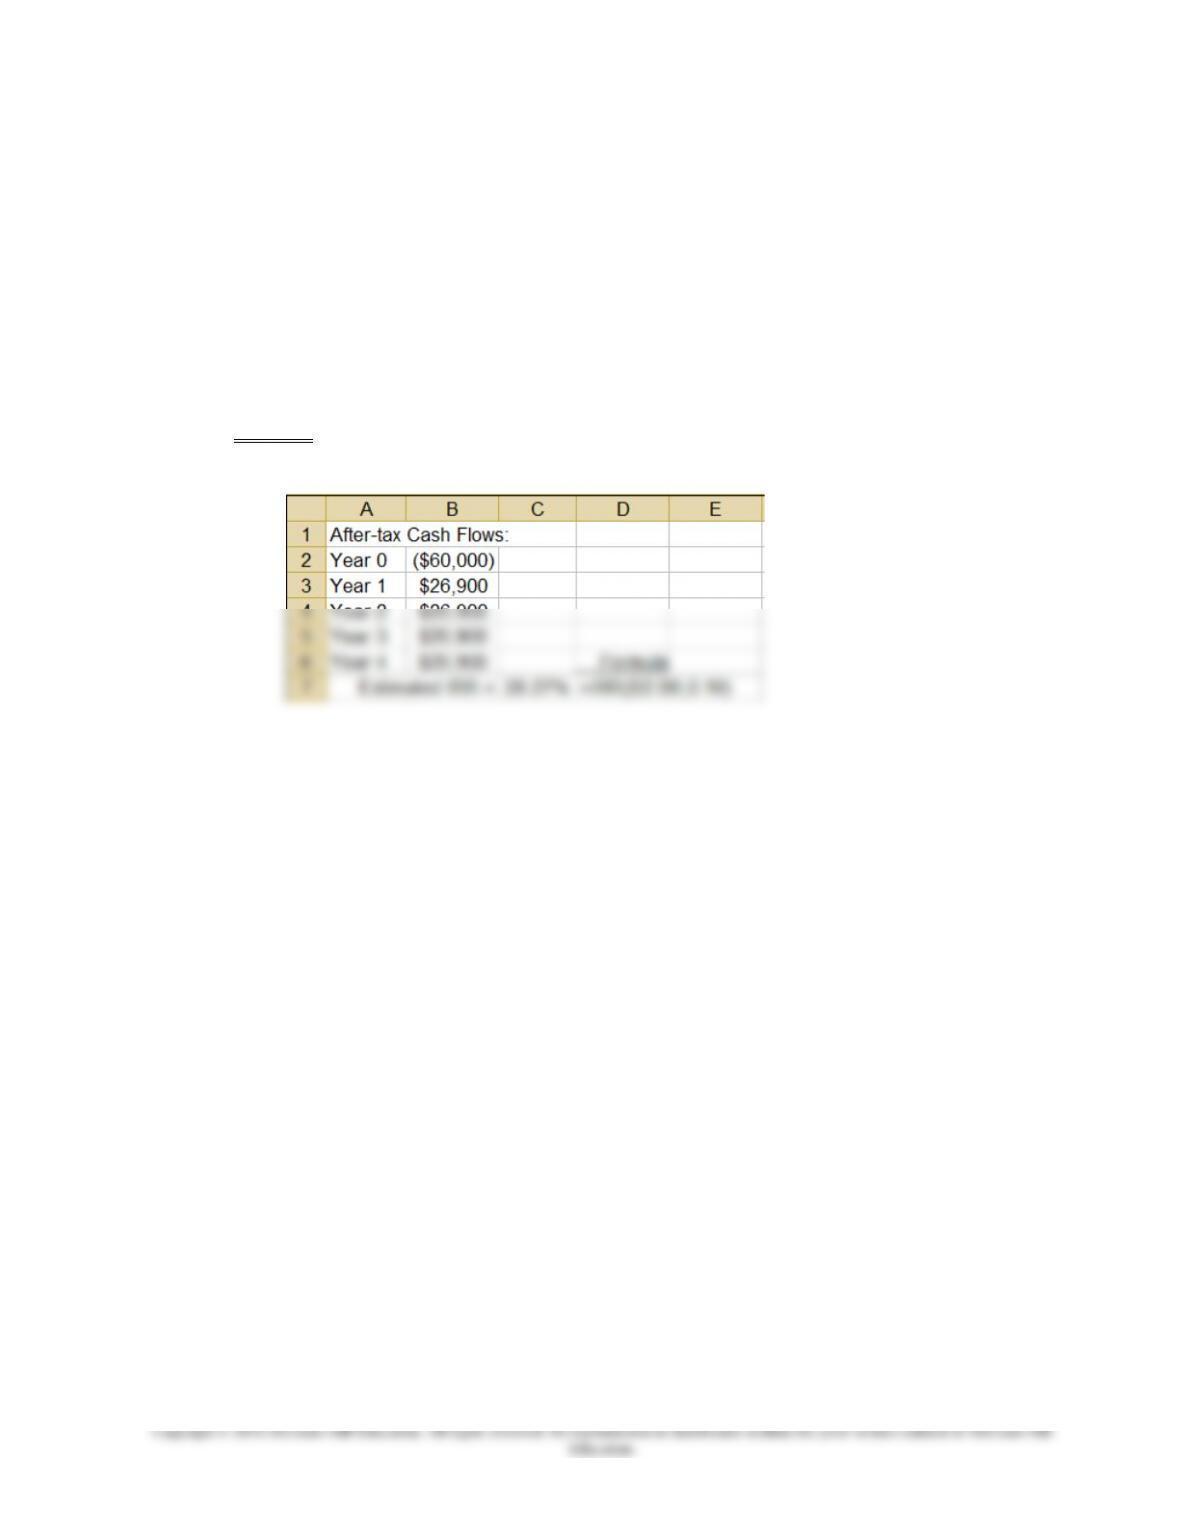
Therefore, estimated Internal Rate of Return (IRR) =
Finally, we could use the built-in IRR function in Excel, which provides an IRR =
28.27%, as follows:
12-19
Chapter 12 - Strategy and the Analysis of Capital Investments
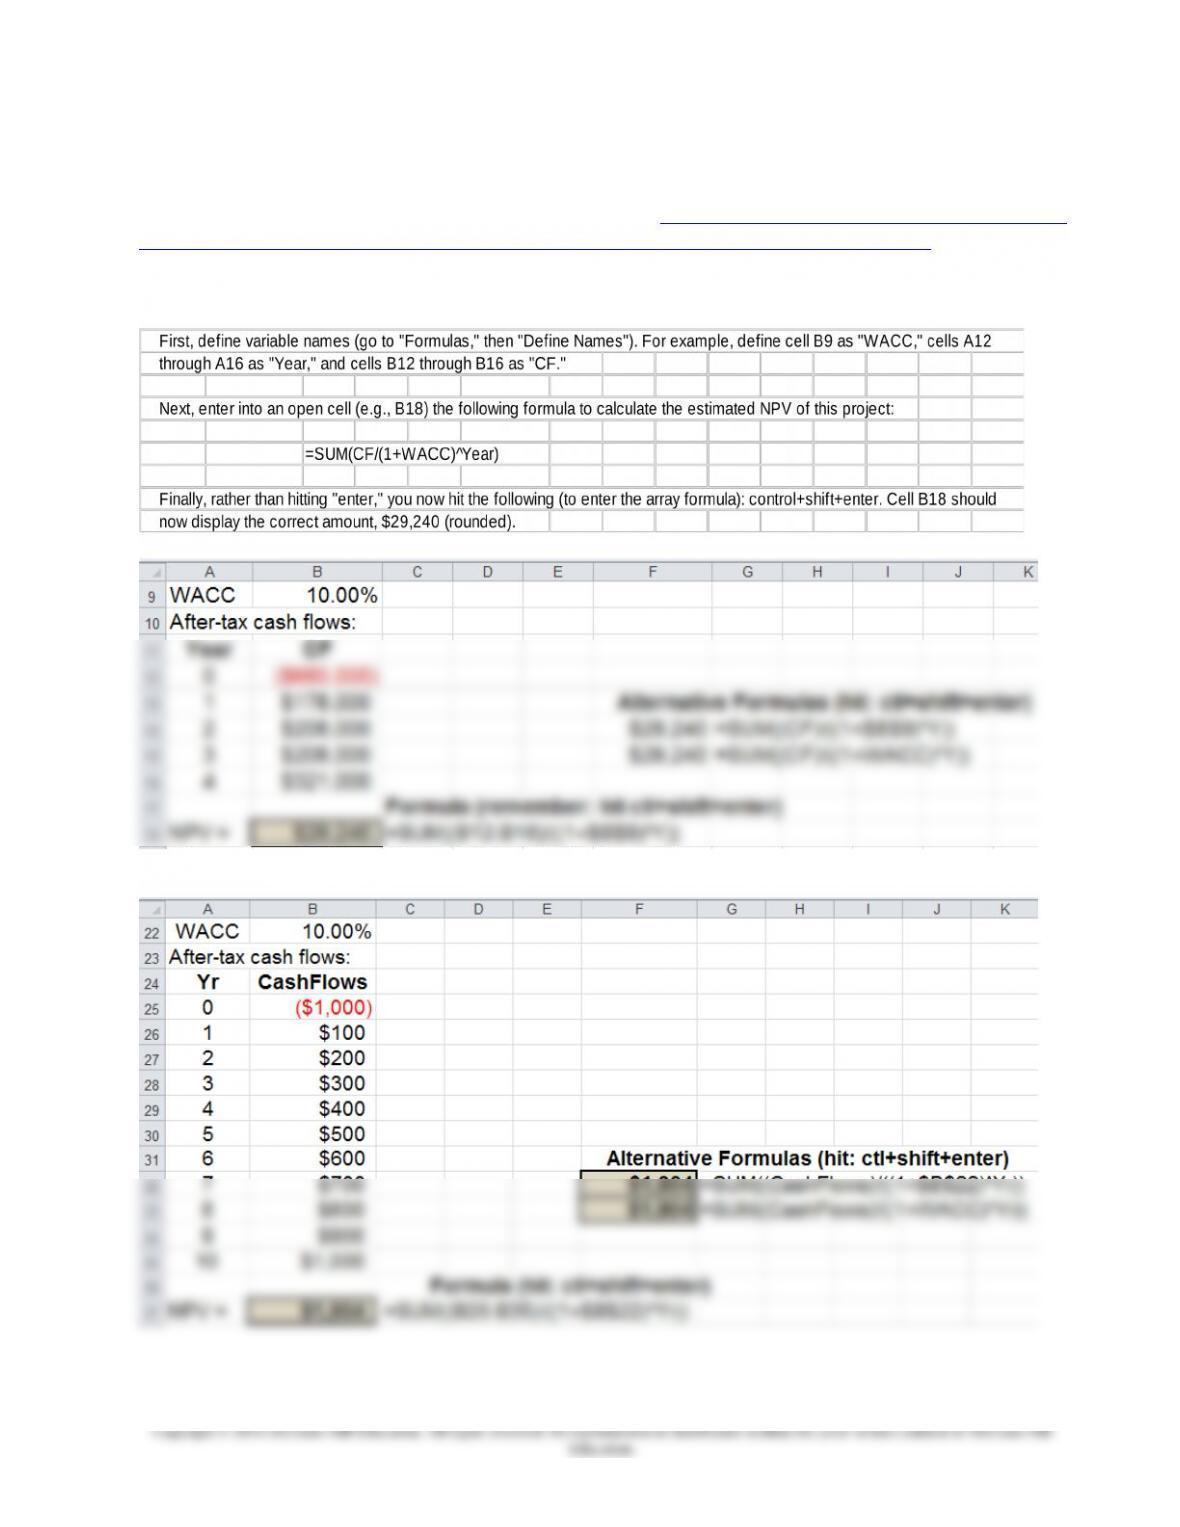
12-33 Using Arrays in Excel; NPV Analysis (40 minutes)
The following source may be consulted: http://office.microsoft.com/en-us/starter-
help/create-or-delete-a-formula-HP010342373.aspx?CTT=3#_Toc251333379
1. NPV = $29,240 (rounded), as follows:
2.
12-20


