11-39 (continued-2)
and long-term pricing strategy to make sure it is consistent with
long-term strategy with established profit targets.
Hillside should evaluate the effectiveness of its advertising and
promotional efforts. Are the targeted customers being reached?
An unintended effect of the sales contests is that certain retail
customers might buy unusually large orders, at the urging of
11-40 Profitability Analysis; Pro Forma Income Statement (60-75 min)
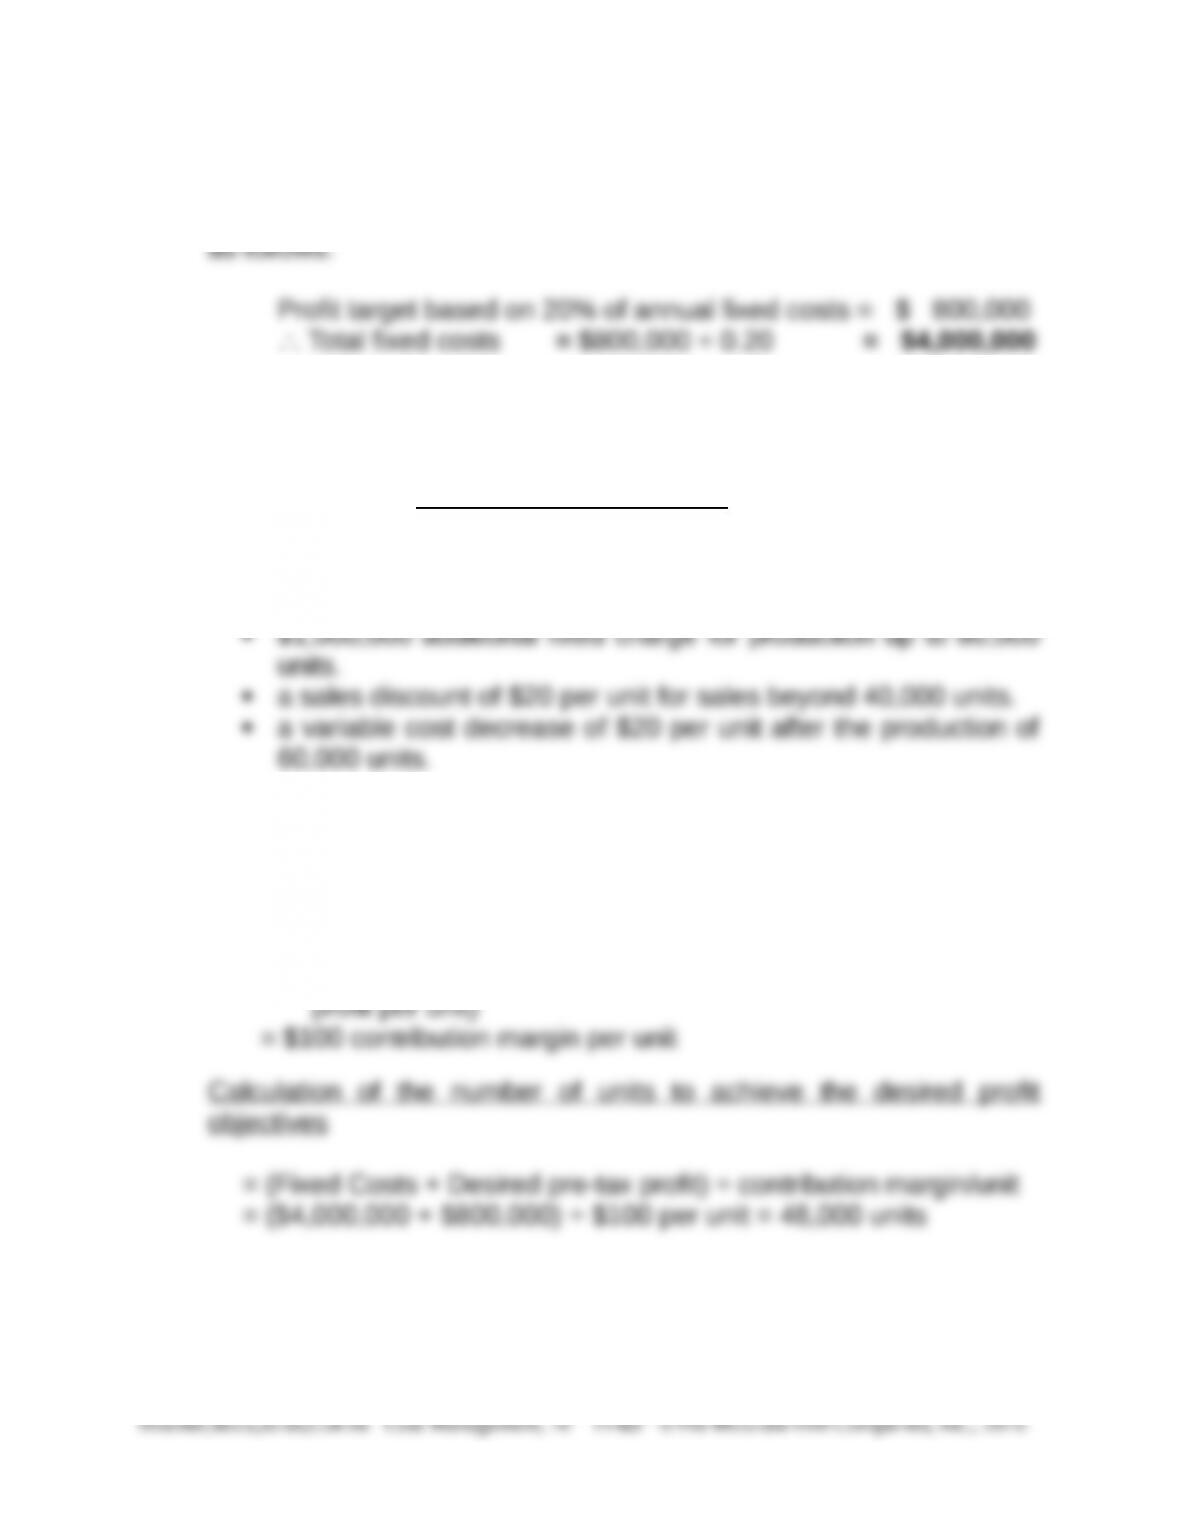
1. The dollar value of DimLok’s present annual fixed costs is calculated
2. DimLok must sell 64,000 units in order to achieve both profit
objectives of 20 percent return on fixed costs and $20 per unit sold.
Supporting Calculations
First: The solution must consider the following constraints:
40,000 unit capacity for the current facility.
Second: The calculation of profit with the current facility at the
capacity level of 40,000 units will not meet the profit objectives, as
demonstrated by the following calculations:
Contribution margin per unit below the 40,001 unit level
= $200 selling price per unit − ($80 variable cost per unit + $20
Note: 48,000 units exceeds current capacity (40,000 units) by
8,000 units.
11-40 (continued-1)
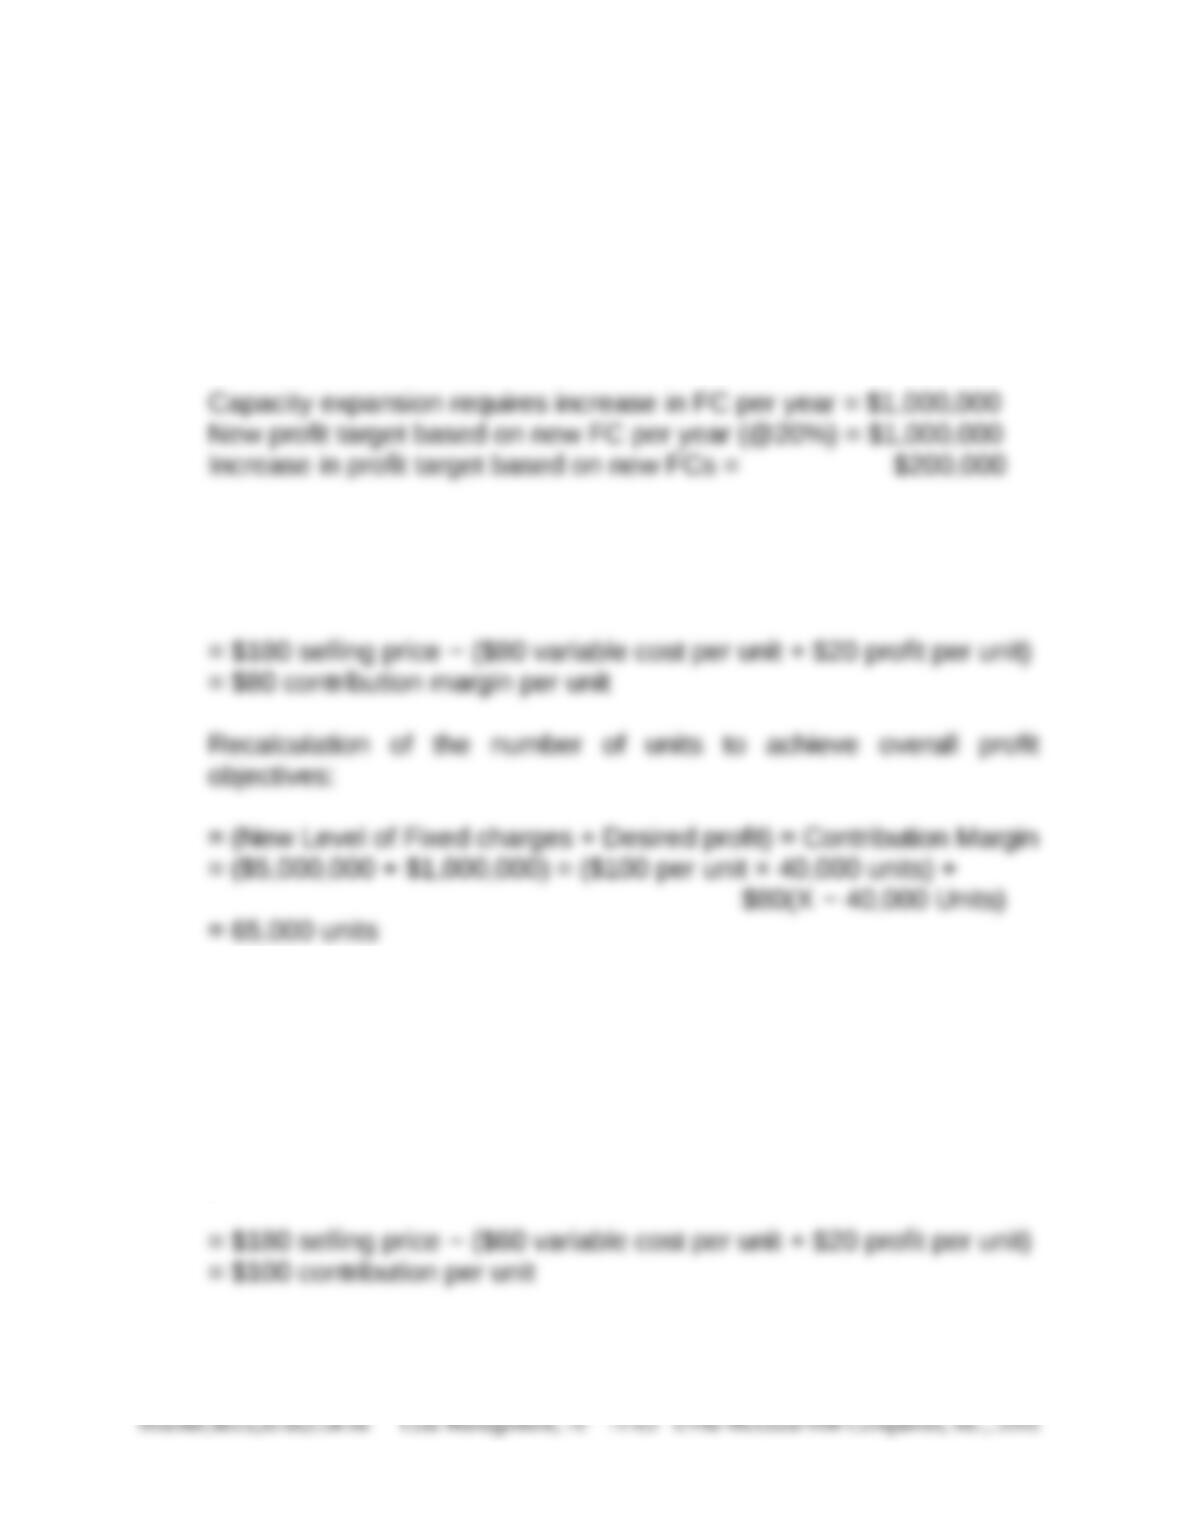
Third: Thus, in order to achieve the profit targets, DimLok must
increase plant capacity, thus incurring an additional $1,000,000 in
fixed costs. This, in turn, increases the profit target based on fixed
costs to a total of $1,000,000 (i.e., 0.20 × [$4,000,000 + $1,000,000]),
as follows:
The per-unit contribution margin for production in the 40,001 to
60,000 units range, with the selling price reduced to $180 per unit, is
$80, as follows:
65,000 units exceeds the 60,000-unit critical level
(supplier’s contract); variable costs are reduced by
$20 per unit for production in excess of 60,000 units.
Fourth: The contribution margin per unit for production in the 60,000
to 80,000 unit range, with the variable cost per unit reduced to $60
per unit, is determined as follows:

11-40 (continued-2)
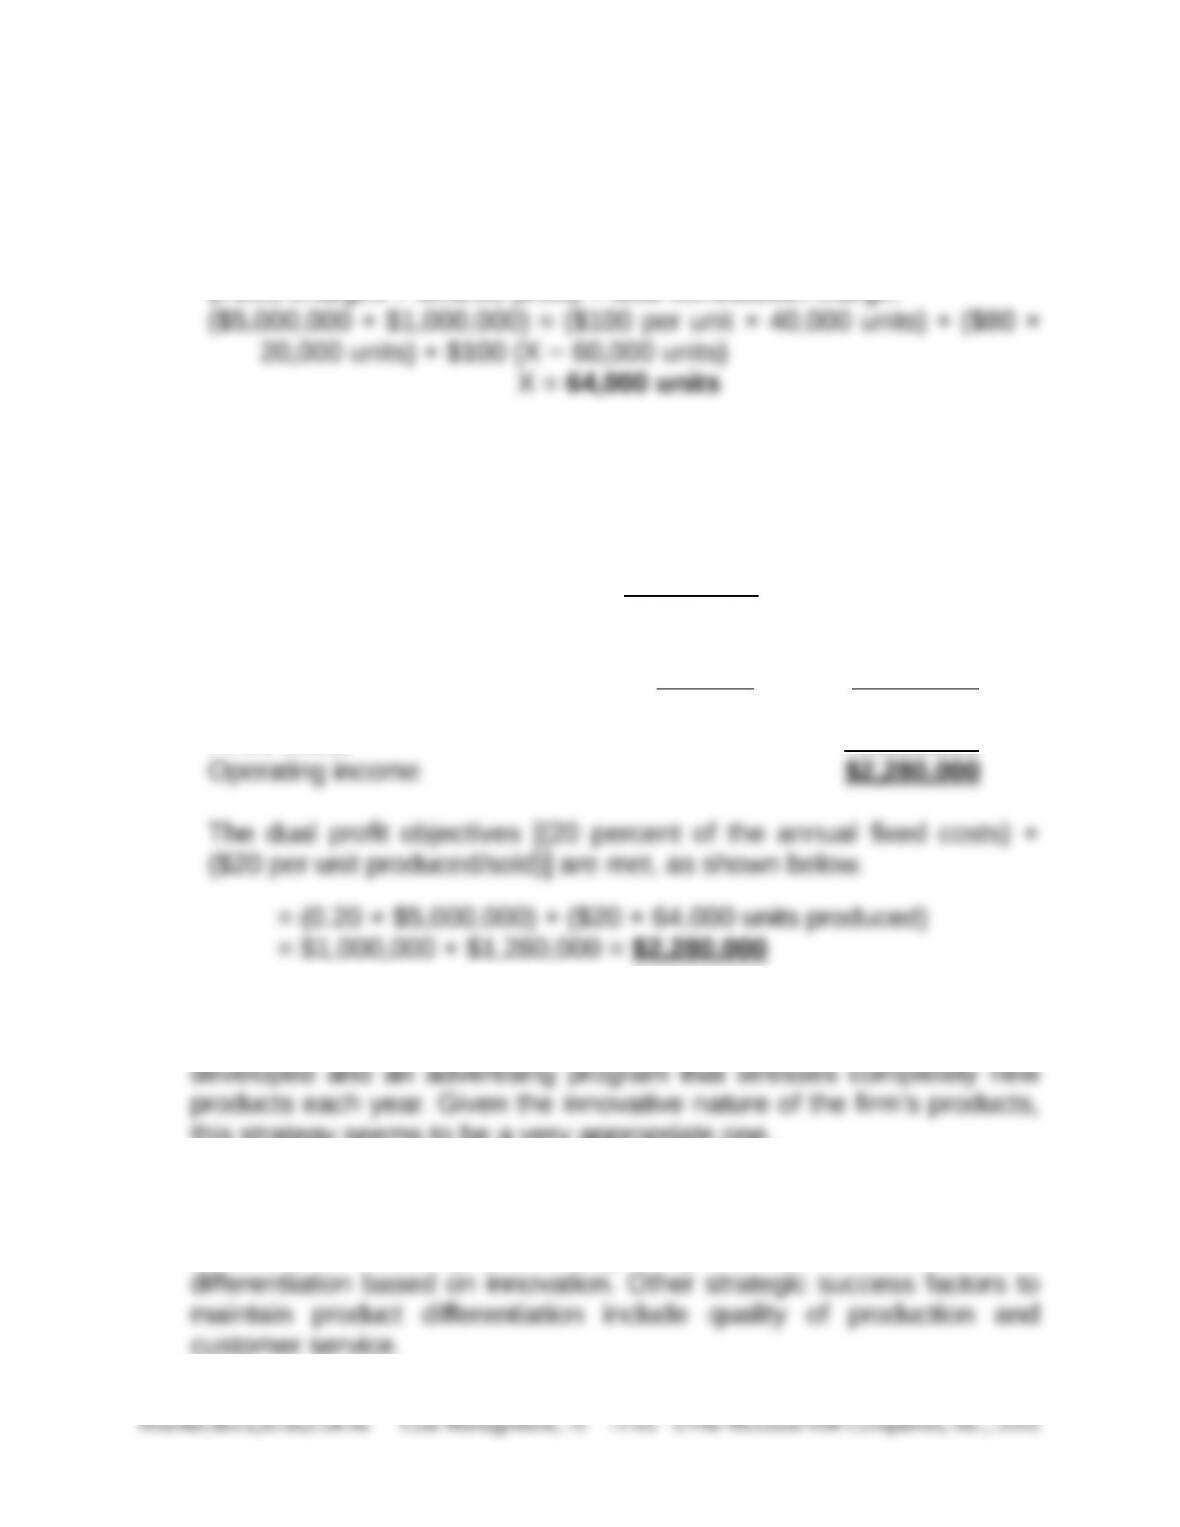
Finally, the calculation of the number of units (X) needed to achieve
overall profit objectives
(Fixed charges + desired profit) = total contribution margin
3. DimLok Division
Pro Forma Income Statement
Revenue
40,000 units × $200/unit = $8,000,000
24,000 units × $180/unit = 4,320,000 $12,320,000
Variable costs
60,000 units × $80/unit = 4,800,000
4,000 units × $60/unit = 240,000 5,040,000
Contribution Margin 7,280,000
Fixed Costs 5,000,000
4. DimLok has a competitive strategy based on differentiation. The
differentiation is based on the secret process that DimLok has
this strategy seems to be a very appropriate one.
5. Critical success factors for DimLok include research and development
(R&D) to maintain the technological advantage of their unique
products, and strong advertising programs to stress the firm’s
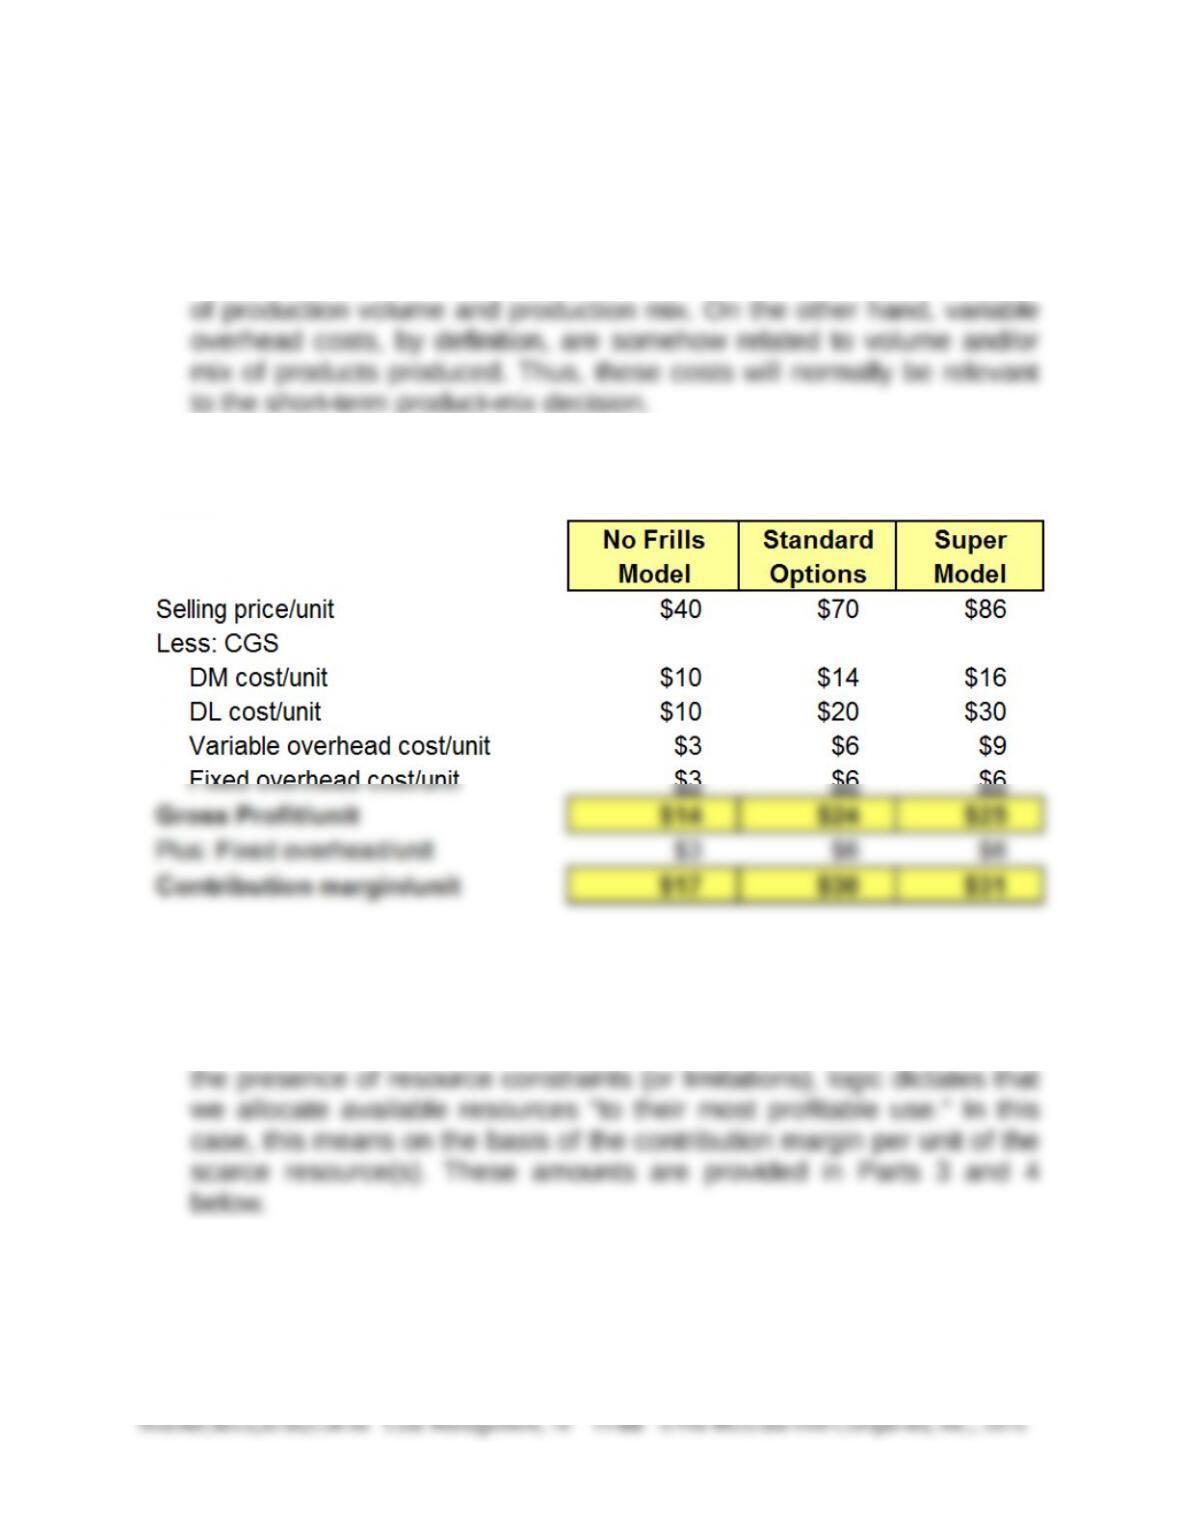
11-41 Product-Profitability Analysis, Scarce Resources (60 min)
1. Fixed manufacturing overhead costs, in total, are by definition
capacity-related costs and as such are not expected to change in the
short run. Thus, in total, short-term fixed costs should be independent
2. Gross profit per unit and contribution margin per-unit figures:
Neither of the above profit figures is useful in terms of determining the
optimum short-term product mix. In the absence of production
constraints, and assuming all per-unit contribution margins are
positive, we should produce each product up to its level of demand. In
3. In the presence of a single resource constraint, we should focus on
those products that provide the greatest contribution margin per unit of
the scare resource, in this situation, labor time. The calculations follow.

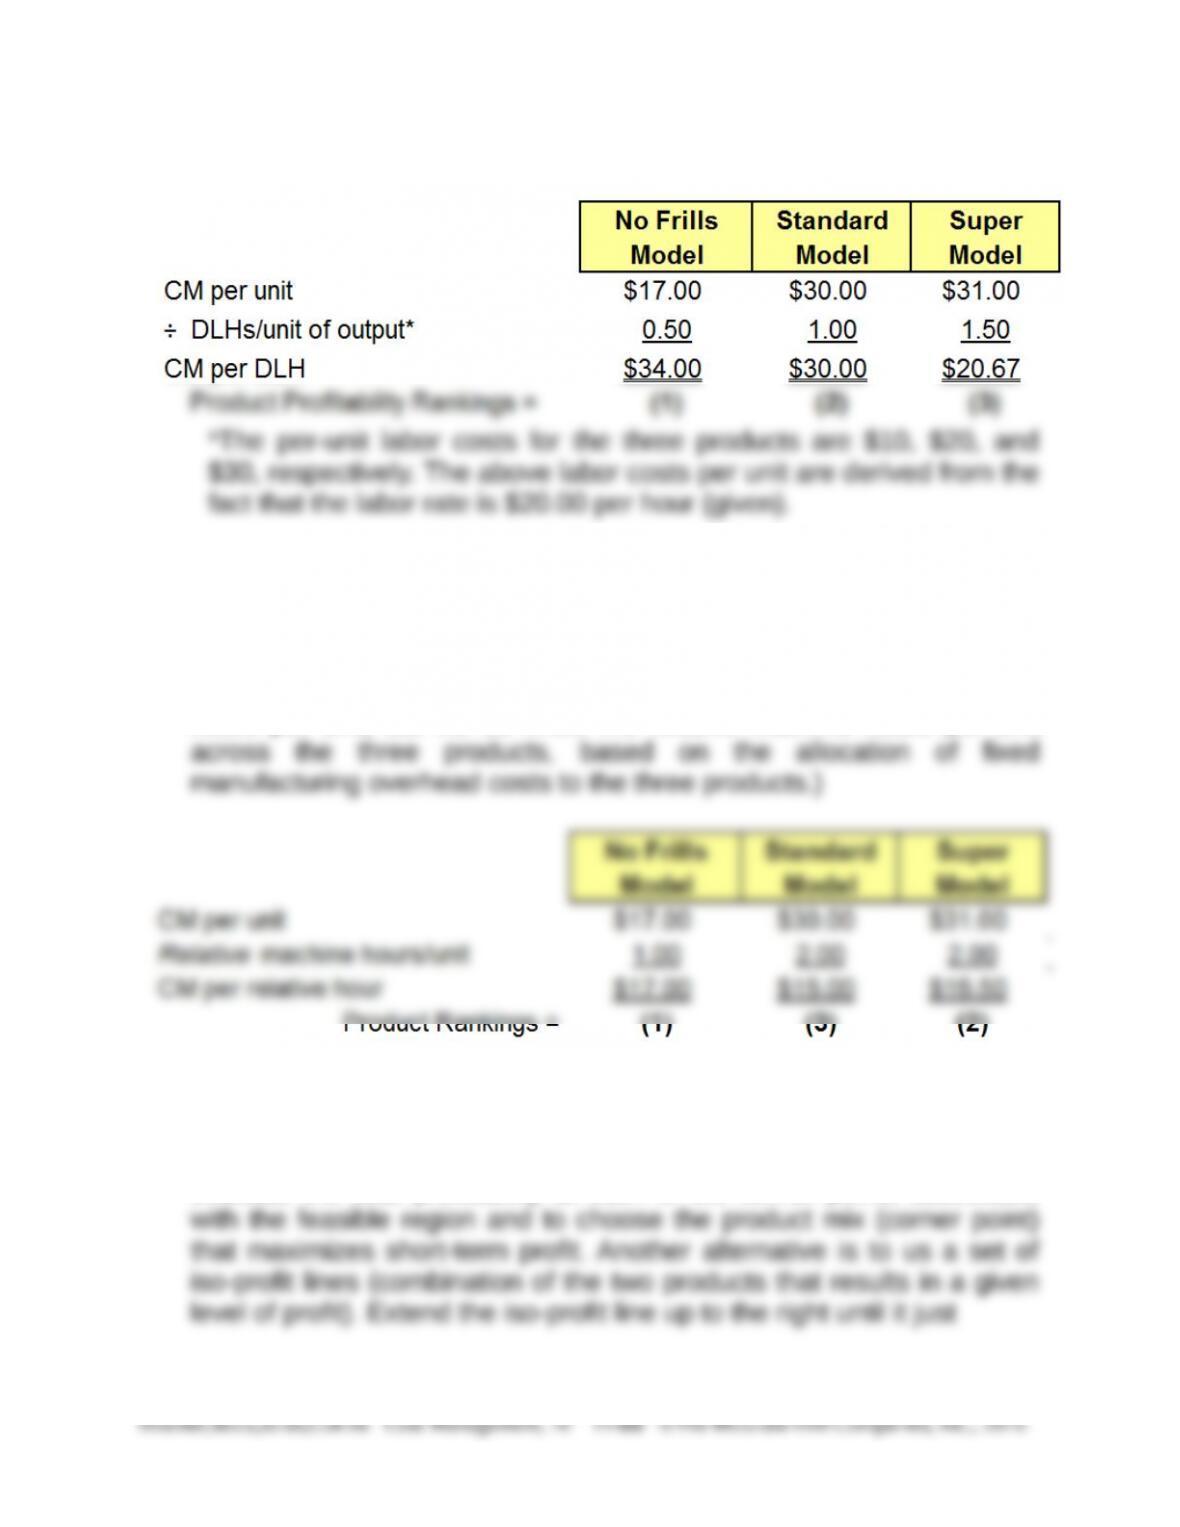
11-41 (Continued-1)
4. If machine hours represent the scarce resource, then the allocation of
machine hours to products should be based on the contribution margin
per machine hour. As seen from the calculations below, the product
profitability rankings differ from those determined in Part 3 above.
(Note that in the present case we do not know the actual machine
hours per unit, but we do know the relative machine hours per unit
5. If there are only two products (and one or more constraints), we could
solve the product-mix problem using the graphical approach presented
in the chapter (see Exhibits 11.19 and 11.21). One alternative is to
evaluate the total profitability at each of the corner points associated
11-41 (Continued-2)
touches a point in the feasible set (region): this point (mix of the two
products) defines the optimum product mix.
6. In the case where there are more than two products (and one or more
constraints), the graphical approach is not practical. In this case, the
7. The primary role of the management accountant in terms of short-term
profit planning is to generate accurate estimates of the contribution
margins for each product (or service). Whether a simple or a complex
11-42 (Also Problem 9-50): CVP Analysis; Sustainability; Uncertainty;
Decision Tables (75-90 min)
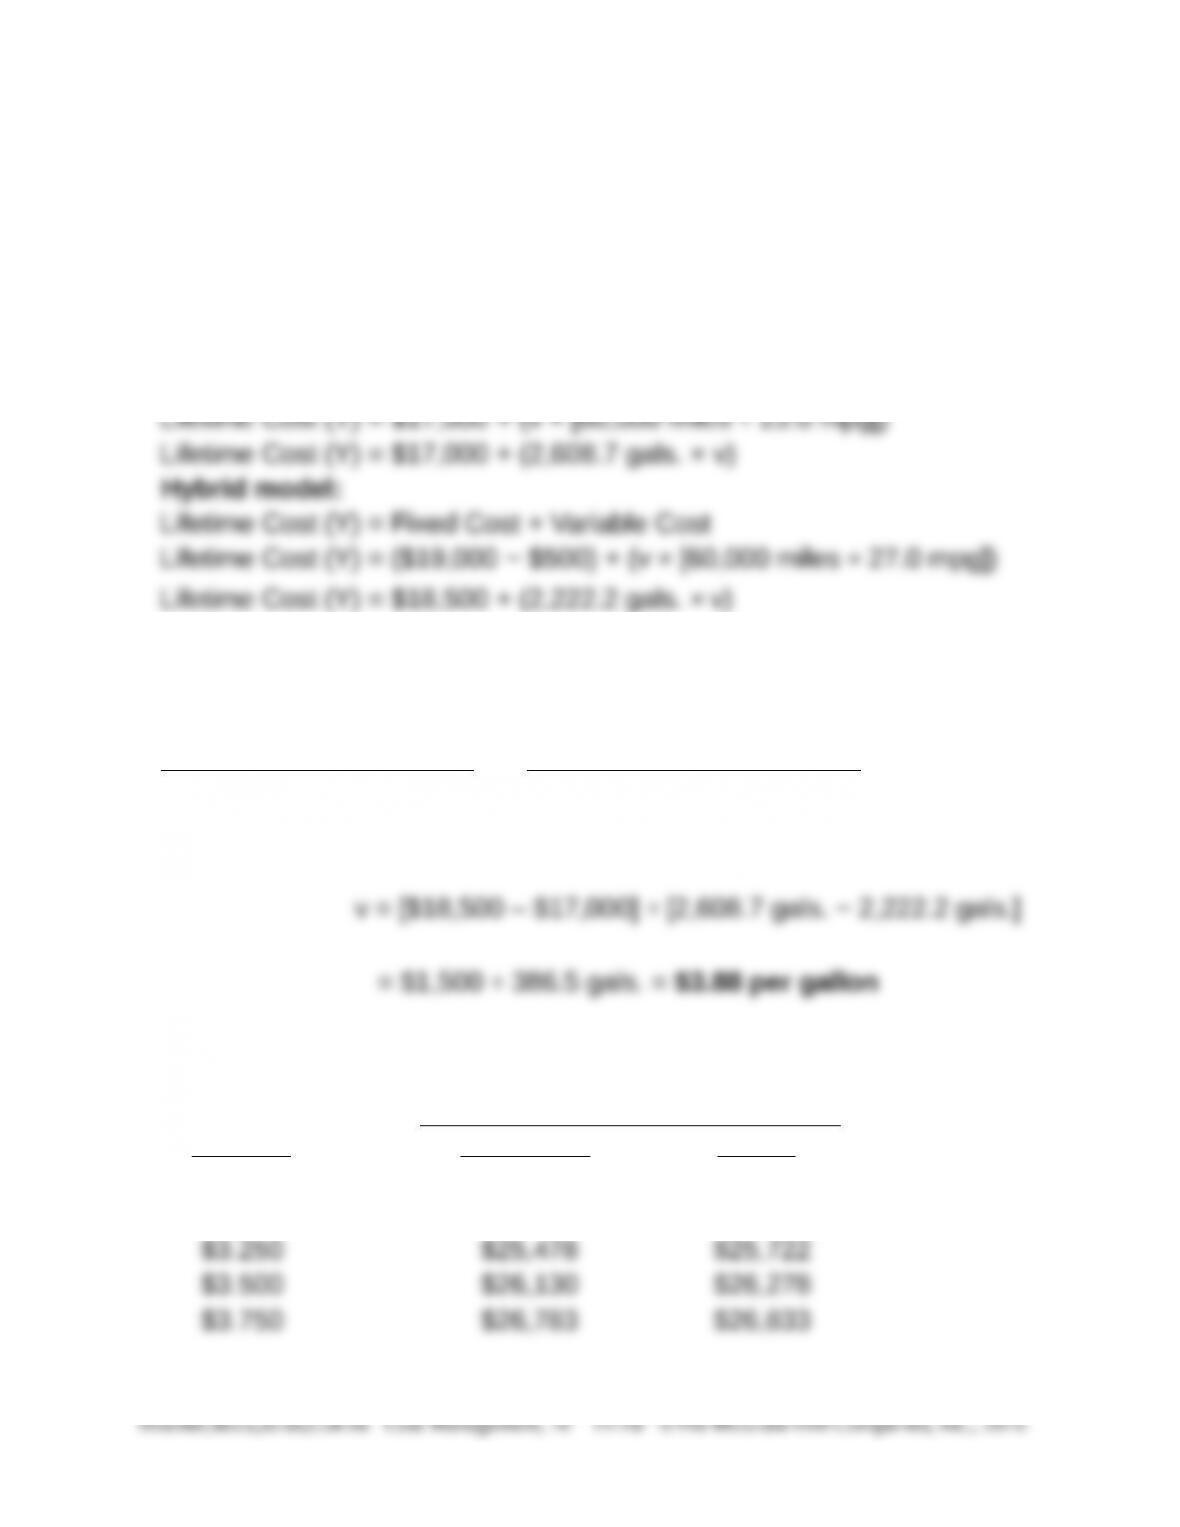
1. Lifetime cost functions: let Y = lifetime cost, and v = cost per gallon of
gas
Regular model:
Lifetime Cost (Y) = Fixed Cost + Variable Cost
2. Breakeven gas price (point of cost indifference): let “v” = breakeven price
per gallon
Lifetime Cost–Gas Model = Lifetime Cost–Hybrid Model
$17,000 + (2,608.7 gals. × v) = $18,500 + (2,222.2 gals. × v)
3. Graph of Lifetime Cost Function–Regular and Hybrid Models
X (price Lifetime Cost
per gal.) Gas Model Hybrid
$2.750 $24,174 $24,611
$3.000 $24,826 $25,167