11-47 Profitability Analysis (45-50 min)
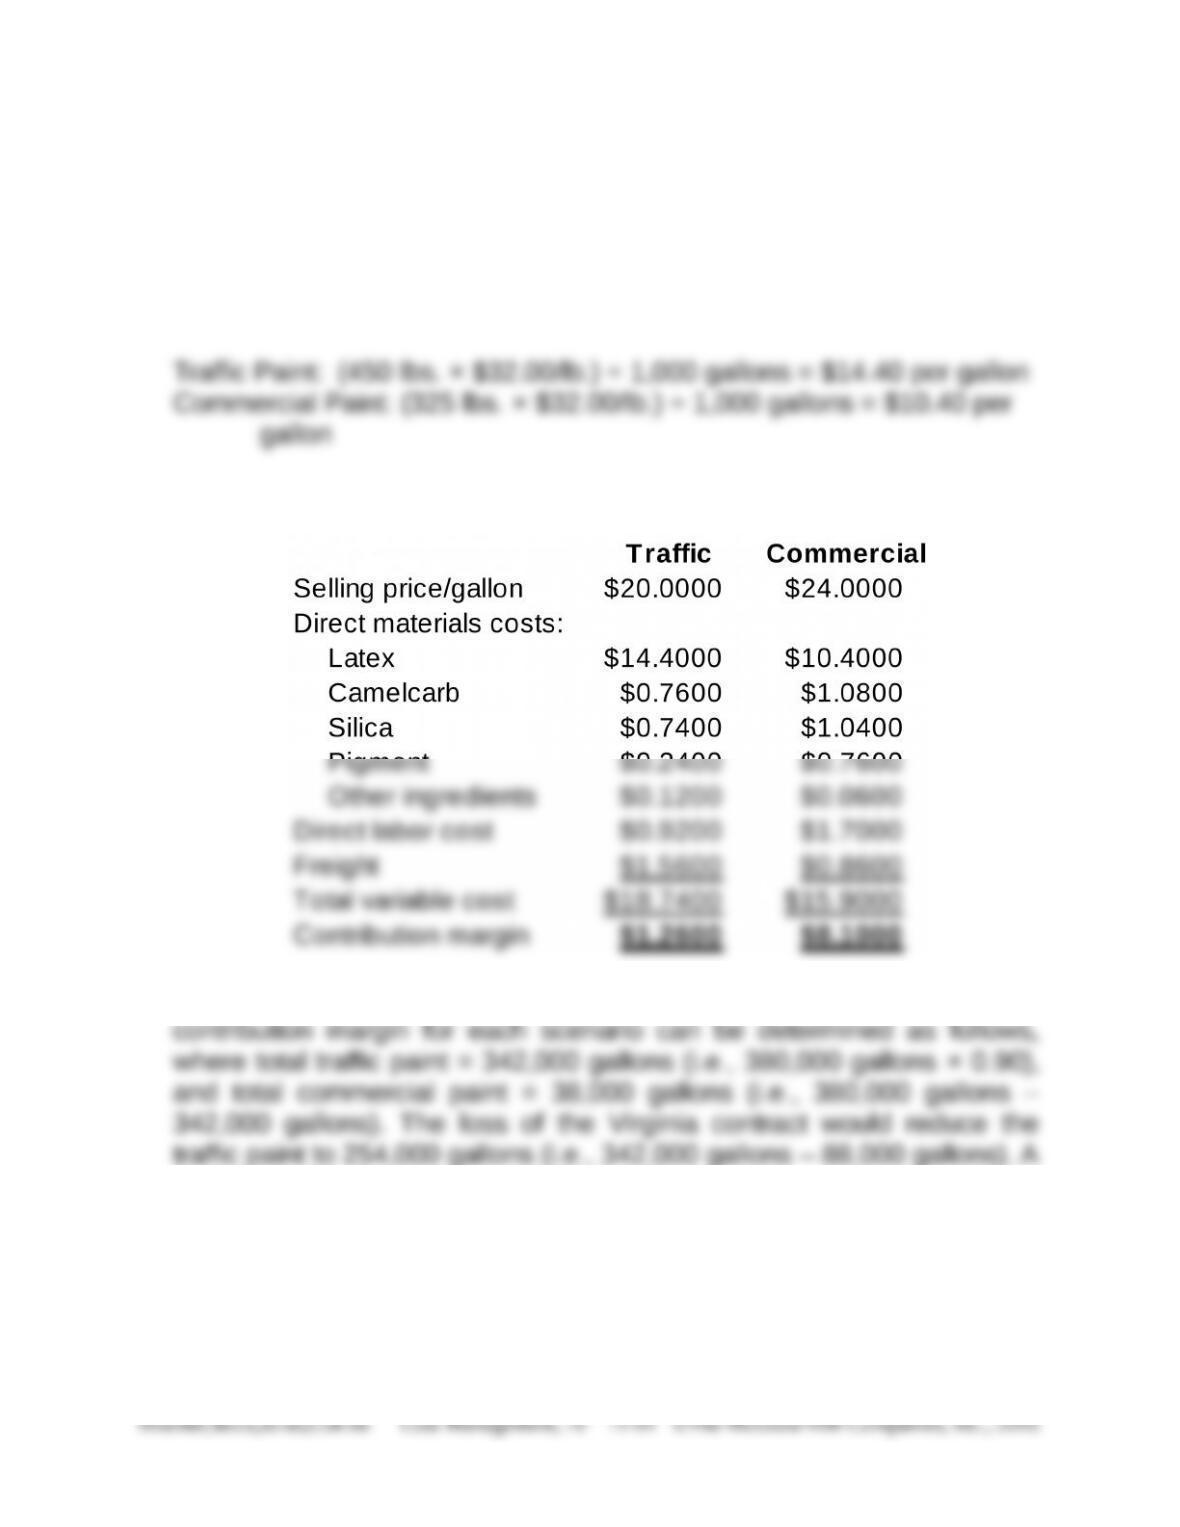
1. First, calculate the contribution margin per unit for traffic and commercial
paint.
The first step is to determine the unit cost of latex, as follows:
The per-unit contribution margins are then determined as follows:
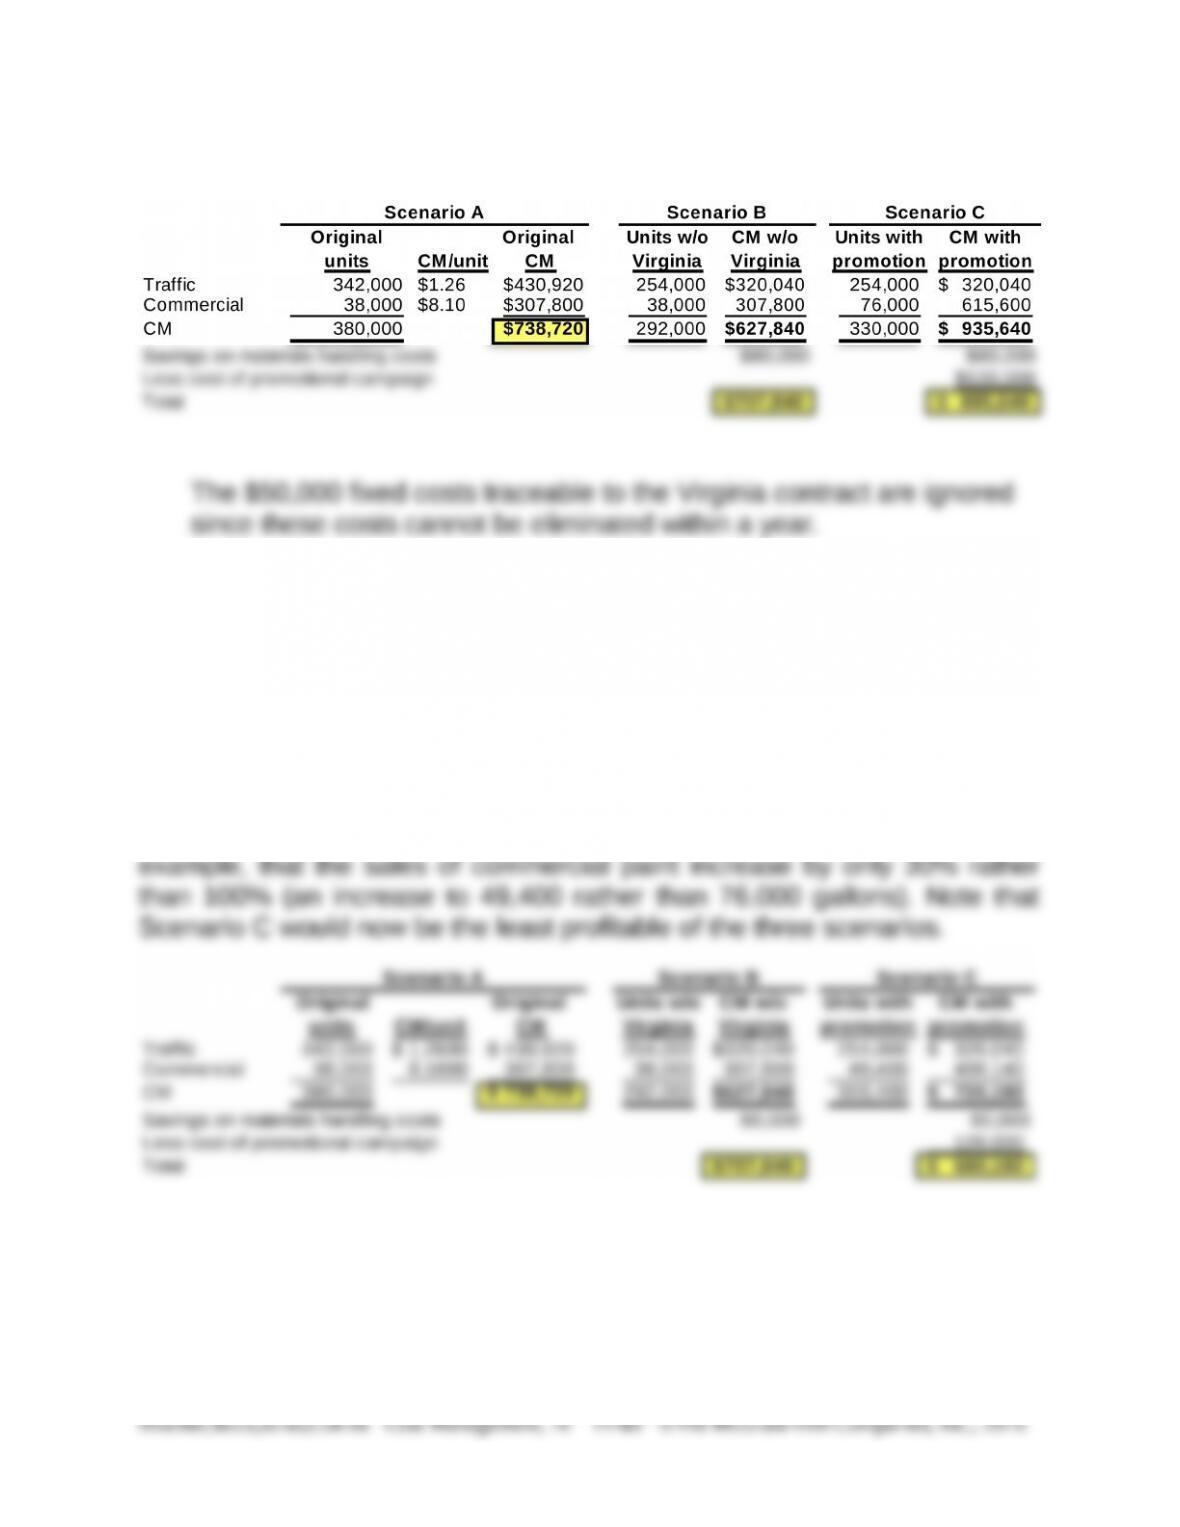
Using the above contribution margin per unit figures, the total
doubling of commercial paint (using the promotion) would result in
76,000 gallons (i.e., 38,000 gallons × 2).
Problem 11-47 (continued)
2. The proposed promotional campaign without the Virginia contract,
scenario C, has the greatest contribution margin, as shown in the
calculations above. Strategic issues for the decision between scenario B
and scenario C include the reliability of the projected sales-volume increase
in commercial paint and of the assumption that the volume of commercial
paint can be doubled without increasing fixed costs, other than the cost of
the promotion. A strategic opportunity, on the other hand, is that Meyer can
move from a relatively low contribution product line (traffic paint) to a
relatively high contribution product line (commercial paint). Suppose for
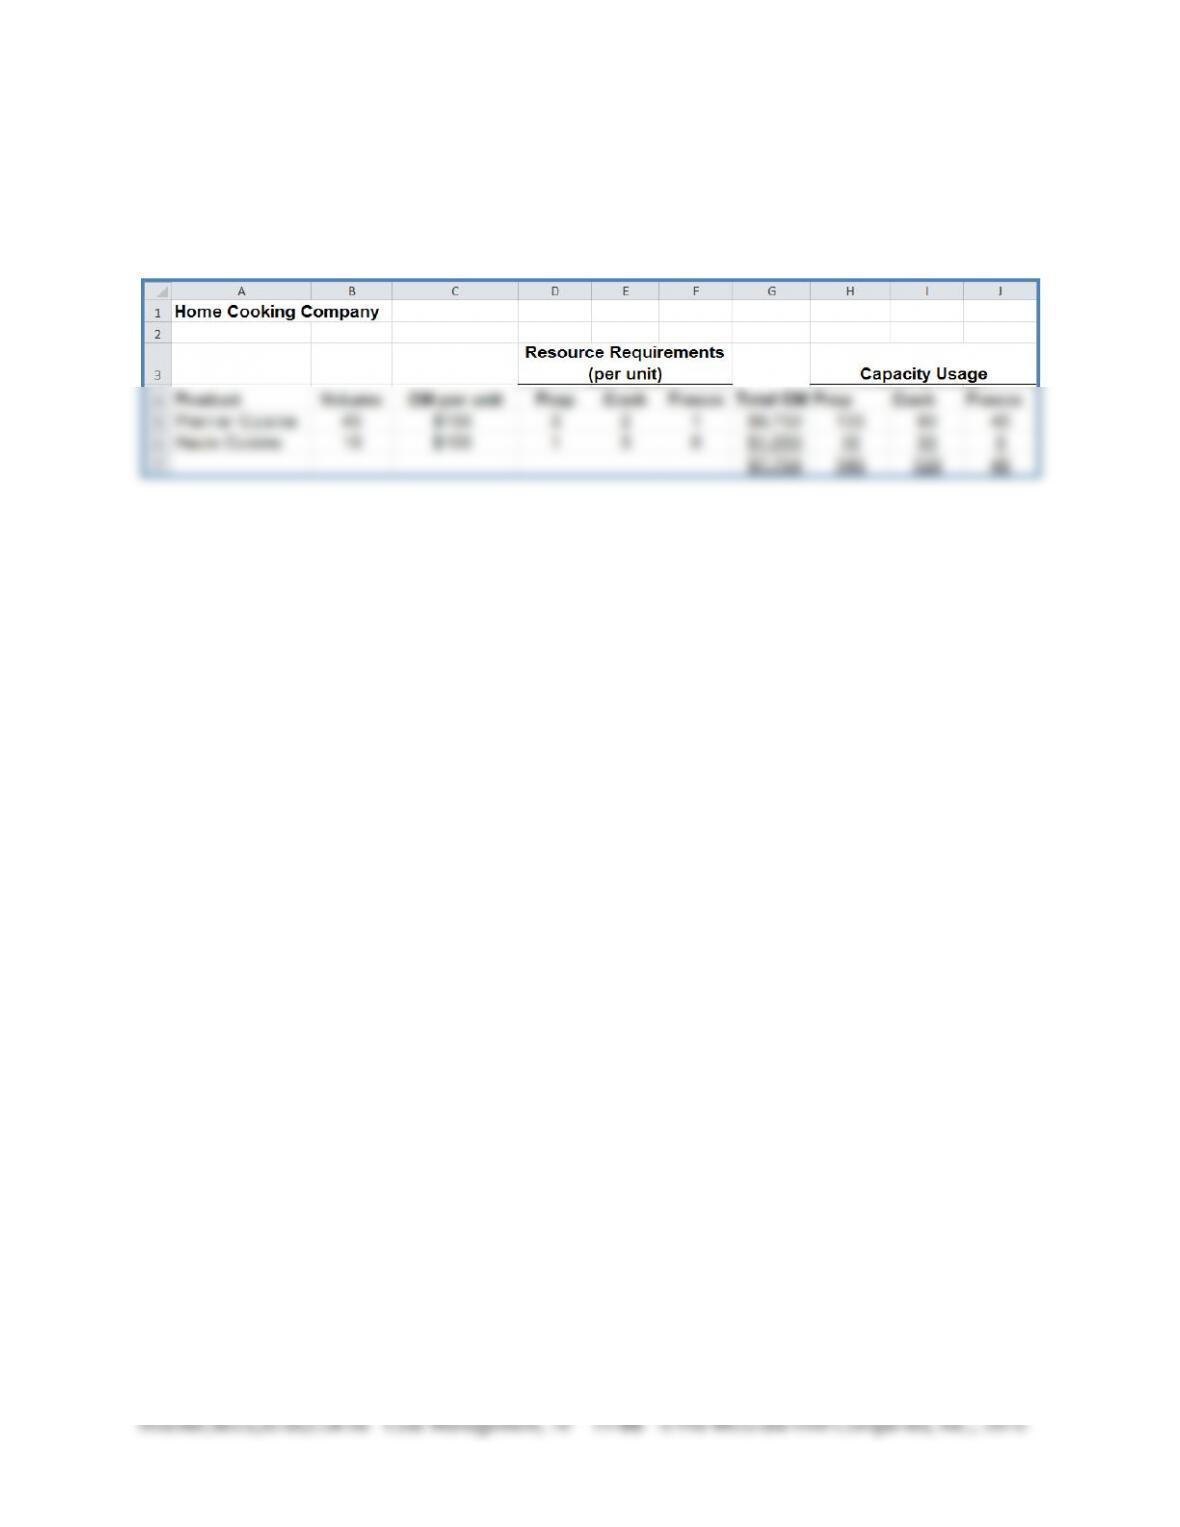
11-48 Constrained Optimization Analysis; Linear programming (50-60
min)
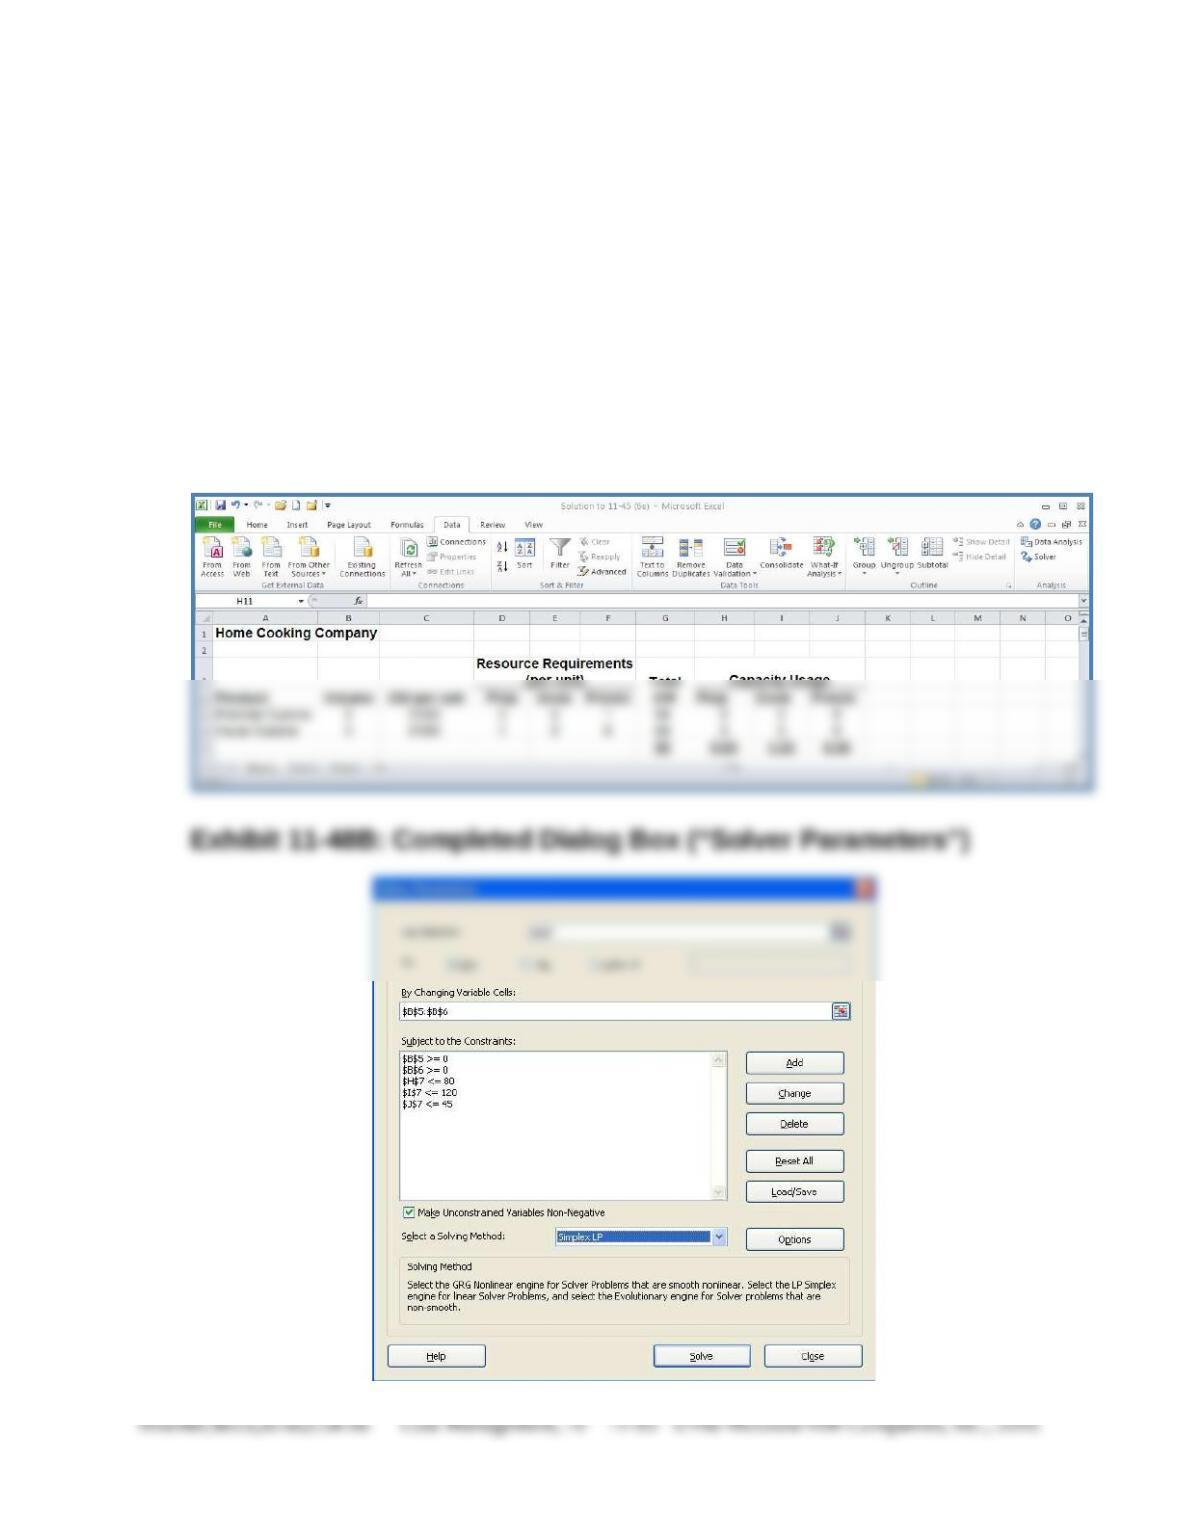
1. Solve for all three constraints: the solution is 17 units of Premier
Cuisine and 29 units of Haute Cuisine, as shown in Exhibit 11-48C,
cells B5 and B6. Total contribution margin for this mix is $5,429. The
Solver set up for this solution is shown in Exhibit 11-48A. The
completed dialog box (“Solver Parameters”) is presented in Exhibit 11-
48B.
Exhibit 11-48A: Solver Set Up
11-48 (Continued-1)
Exhibit 11-48C: Solver Solution (Optimum Product Mix)
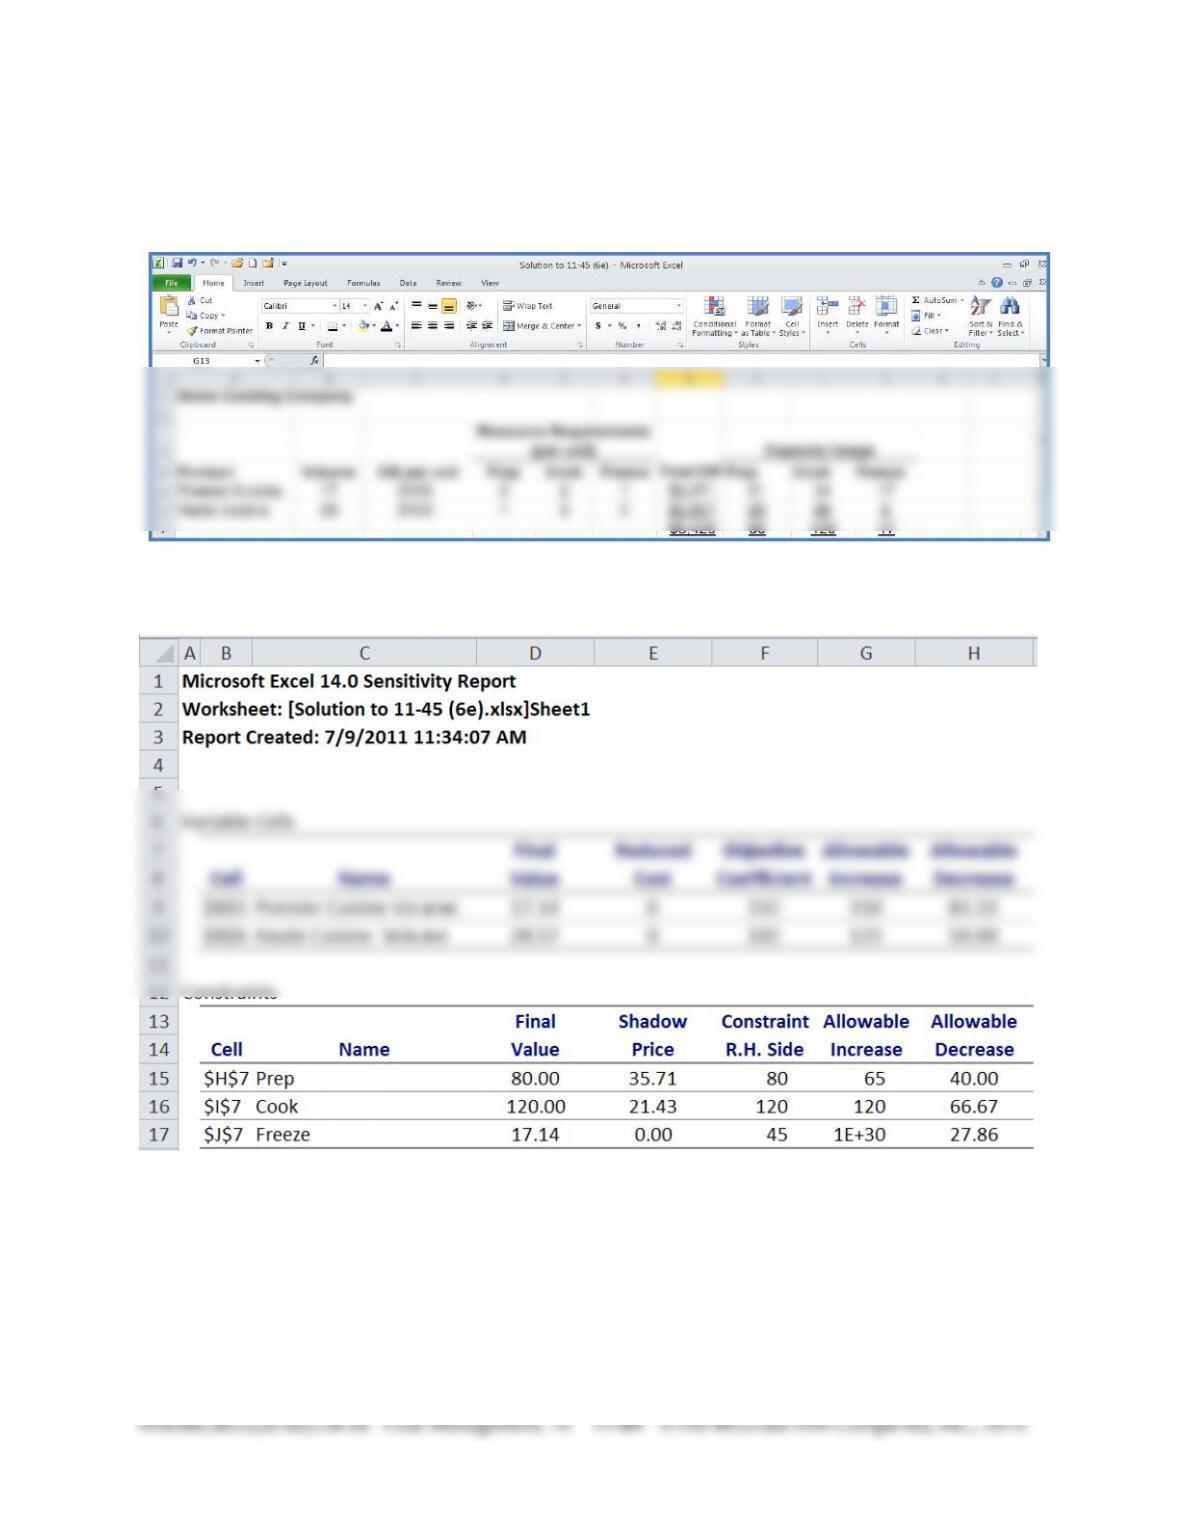
2. Sensitivity Report
Notes–Sensitivity Report:
1. Reduced costs: these pertain to the two decision variables (Premier
and Haute). If all such variables are in the optimum solution (as in the
present case), then these values will all be zero. Technically, the
11-48 (Continued-2)
“reduced cost” for a variable not in the optimum solution represents
the amount by which the per-unit contribution margin would have to
change in order for the variable to enter the optimal solution.
2. For each decision variable, the “Allowable Increase” and “Allowable
Decrease” provide a range over the objective function coefficients
3. For each constraint (Prep, Cook, and Freeze) the Final Value
represents the amount of the resource used under the optimum
solution. If you look at cell H7 and I7 you see that the entire
time allotment for Prep and Cook are used up under the
optimum solution. As such, each of these two constraints has a
4. Finally, for each constraint there is an “Allowable Increase” and an
“Allowable Decrease.” This information shows the range, around the
3. Optimal Solution after removing preparation time constraint: the optimal
solution, as showed in Exhibit 11-48D below, is to produce 45 units of
11-48 (Continued-3)
Exhibit 11-48D
Check Figures: Chapter 11
11-21 No check figure available.
11-26 1. If annual volume is at least 100,000 units, Vista should purchase and use
1 = 72.73%; 3. Required increase in sales from T-1 = 31.82%
11-28 1. 8,000 units of SilPol; 2. Operating income: for 0 units of SilPol, $2,000; for
11-29 1. Gross profit figures, per square yard: Commercial, $4.50; Residential, $7.75
11-30 a. Relevant cost to produce the product = $62.00 per unit; savings by producing
internally = $4,000; b. Difference in favor of the re-machining alternative =
per meal
11-31 1. One-year cost differential = $13,125; 2. Difference between paying the fine
11-32 1. Average cost per unit: prior to special order = $181.67; including special sales
11-33 1. Total relevant cost = $147,500; 2. Operating income would decrease by
per unit = $19.15
11-36 1. Number of fans manufactured = 15,000; number of fans purchased = 5,000;
11-37 1. Savings if parts are purchased = $48,975 (relevant cost to make = $21.8825
11-38 Non-discounted five-year cost advantage in favor of the Naftel contract =
11-39 1. To close the budget gap would require the following increases in sales
volume at budgeted cost, budgeted selling price, and budgeted resource usage.
11-40 1. Current level of fixed costs = $4,000,000; 2. Required sales volume = 64,000
units; 3. Pro-forma Operating Income = $2,280,000
11-41 2. Gross Profit per unit Figures: No Frills Model = $14; Standard Model = $24;
Standard Model = $15.00; Super Model = $15.50.
11-42 1. Lifetime cost function, regular model: Lifetime cost (Y) = $17,000 + (2,608.7
calculations (lifetime miles = 60,000): Hybrid = $27,360; Gas-Power Car =
$27,401
11-43 No check figure
11-44 2. First-year cost savings from closing the plant and outsourcing = $7,200,000
($7,200 in thousands)
11-45 2. Contribution margin per processing hour: Process #1 = $48.00; Process #2 =
across levels of variable overhead cost.
11-46 1. From a contribution income statement, contribution margins are as follows:
11-47 1. Per-unit contribution margins: Traffic Paint, $1.26; Commercial Paint, $8.10;
$738,720; Scenario B = $707,840; Scenario C = $680,180.
11-48 1. 17 units of Premier Cuisine and 29 units of Haute Cuisine (total Contribution
Margin = $5,429); 2. example interpretation: optimum solution holds as long as