
Chapter 10 – Strategy and the Master Budget
analysis is a tool that allows us to vary one or more of these inputs in order to
examine the resulting effect on one or more budgets (e.g., operating income or cash
10-54 (Continued-3)
flows). In essence, we attempt to determine how sensitive our budgets and
forecasted financial statements are with respect to assumptions we are making as to
the value of input factors. For example, the analysis in 3 above suggests that the
budgeted break-even point for the company is sensitive (i.e., it reacts significantly) to
changes in the labor-cost component of variable cost per unit. As such, management
would want to control this cost as carefully as it could.
See the following tutorials for additional information about performing “what-if” analyses
using Excel 2010:
1.Introduction to What-If Analysis:
http://office.microsoft.com/en-us/excel-help/introduction-to-what-if-analysis-HA010342628.aspx
2. Using Excel to Perform Scenario Analysis:
http://office.microsoft.com/en-us/excel-help/switch-between-various-sets-of-values-by-using-scenarios-
HP010072669.aspx
3. Using Excel to Create Data Tables:
http://office.microsoft.com/en-us/excel-help/calculate-multiple-results-by-using-a-data-table-
HP010342214.aspx
4. Using the Goal Seek Routine in Excel:
http://office.microsoft.com/en-us/excel-help/use-goal-seek-to-find-the-result-you-want-by-adjusting-an-
input-value-HP010342990.aspx
5. Using Solver to Perform What-If Analysis:
http://office.microsoft.com/en-us/excel-help/define-and-solve-a-problem-by-using-solver-
HP010342416.aspx
http://office.microsoft.com/en-us/excel-help/video-use-the-solver-add-in-VA101840549.aspx
10-80
Education.
Chapter 10 – Strategy and the Master Budget
10-55 Budgeting Customer Retention and Insurance-Policy Renewal; Sensitivity Analysis (75-90 Minutes)
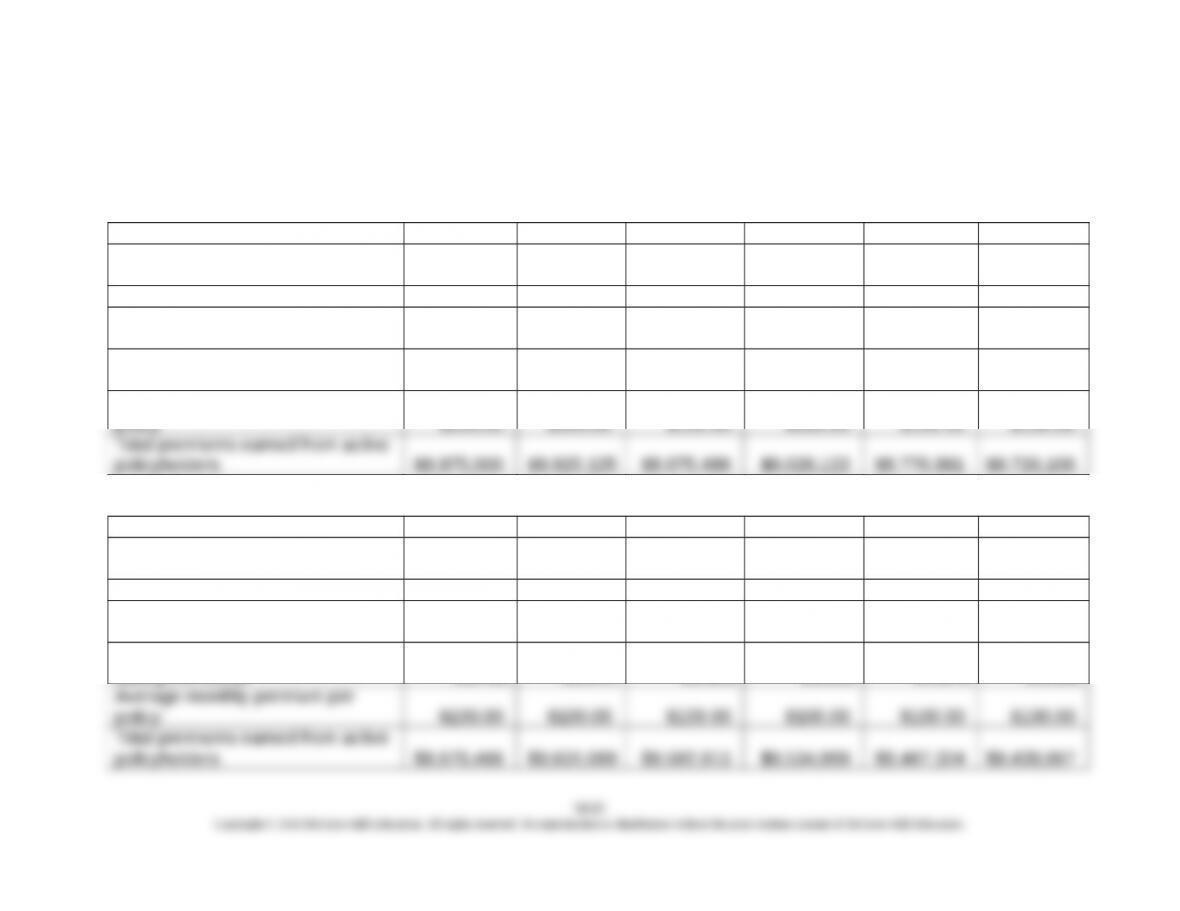
1. Budget for Customer-Retention and Premiums Earned
Budget Item January February March April May June
No. of active policyholders,
beginning of the month 100,000 99,500 99,003 98,507 98,015 97,525
Mid-term cancellation rate (%) 0.50% 0.50% 0.50% 0.50% 0.50% 0.50%
No. of active policyholders, end of
the month 99,500 99,003 98,507 98,015 97,525 97,037
Average no. of active policyholders
during the month 99,750 99,251 98,755 98,261 97,770 97,281
Average monthly premium per
policy $100.00 $100.00 $100.00 $100.00 $100.00 $100.00
Budget Item July August September October November December
No. of active policyholders,
beginning of the month 97,037 96,552 96,069 95,589 95,111 94,635
Mid-term cancellation rate (%) 0.50% 0.50% 0.50% 0.50% 0.50% 0.50%
No. of active policyholders, end of
the month 96,552 96,069 95,589 95,111 94,635 94,162
Average no. of active policyholders
during the month 96,795 96,311 95,829 95,350 94,873 94,399

Chapter 10 – Strategy and the Master Budget
10-55 (Continued-1)
Active policies, end of December 94,162
Policy renewal rate 85.00%
2.
As stated in the chapter, inputs to the construction of individual budgets are subject to
uncertainty. That is, the inputs represent forecasts (e.g., selling price per unit, sales
volume, and sales mix) and therefore are subject to estimation error. “What-if” analysis
is a tool that allows us to vary one or more of these inputs in order to examine the
resulting effect on one or more budgets (e.g., operating income or cash flows). In
essence, we attempt to determine how sensitive our budgets and forecasted financial
statements are with respect to assumptions we are making as to the value of input
factors. For example, in the present case we might be interested in knowing how the
assumption of mid-term cancellation rate affects monthly premium–is premium
revenue sensitive to this assumption? If so, then management may want to carefully
monitor and control this rate.
10-55 (Continued-2)
10-82
Education.
The following web-accessible tutorials regarding the use of Excel 2010 to perform
“What-If analysis” may be helpful:
1. Introduction to What-If Analysis: http://office.microsoft.com/en-us/excel-
help/introduction-to-what-if-analysis-HA010342628.aspx
2. Using Excel to Perform Scenario Analysis: http://office.microsoft.com/en-
us/excel-help/switch-between-various-sets-of-values-by-using-scenarios-
HP010072669.aspx
3. Using Excel to Create Data Tables:http://office.microsoft.com/en-us/excel-
help/calculate-multiple-results-by-using-a-data-table-HP010342214.aspx
4. Using the Goal Seek Routine in Excel:http://office.microsoft.com/en-us/excel-
help/use-goal-seek-to-find-the-result-you-want-by-adjusting-an-input-value-
HP010342990.aspx
5. Using Solver to Perform What-If Analysis:
http://office.microsoft.com/en-us/excel-help/define-and-solve-a-problem-by-using-
solver-HP010342416.aspx
http://office.microsoft.com/en-us/excel-help/video-use-the-solver-add-in-
VA101840549.aspx

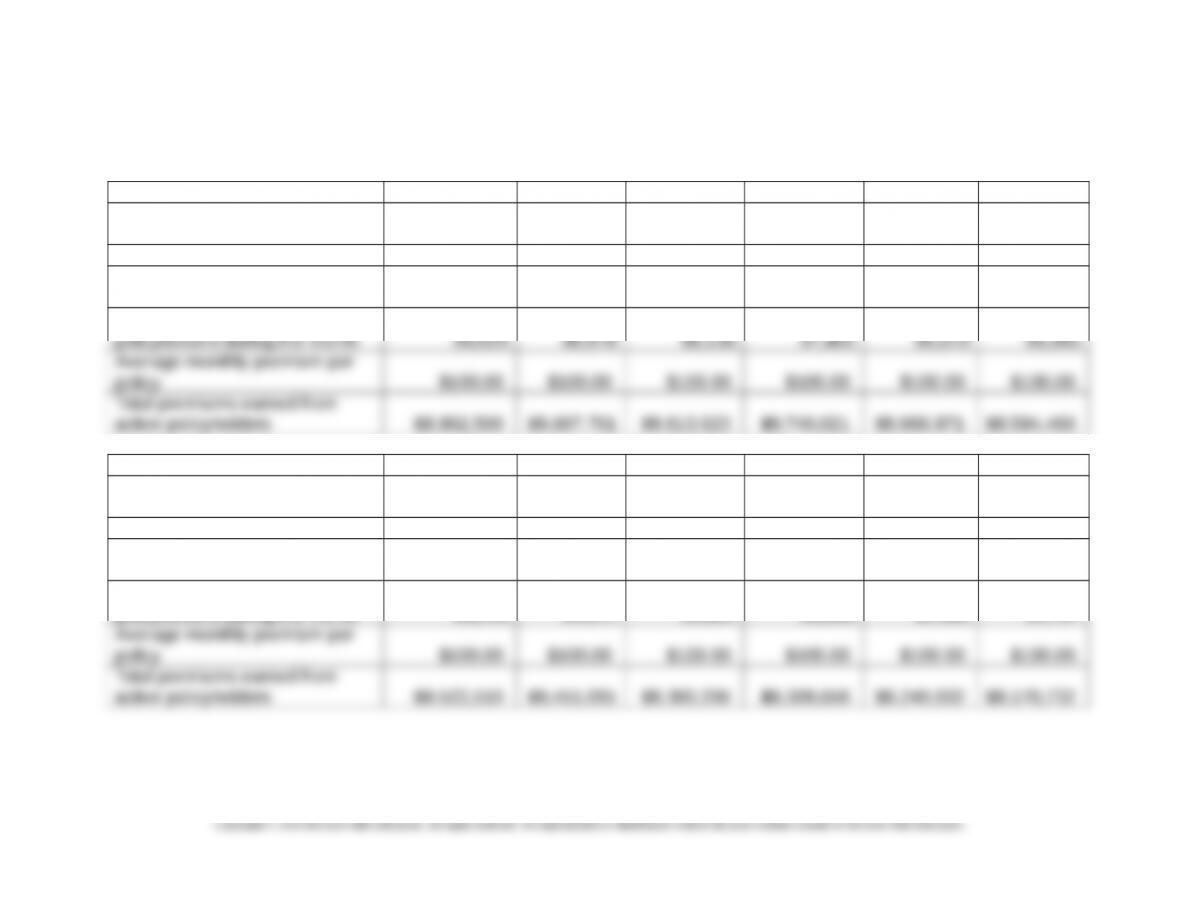
3. Sensitivity Analysis: Revision of the original 12-month budget created above in (1) to
reflect a decrease in the policy-renewal rate to 80.0% and a change in the mid-term
cancellation rate to 0.75%. (See following page for answer.)
10-83
Chapter 10 – Strategy and the Master Budget
10-55 (Continued-3)
Budget Item January February March April May June
No. of active policyholders,
beginning of the month 100,000 99,250 98,506 97,767 97,034 96,306
Mid-term cancellation rate (%) 0.75% 0.75% 0.75% 0.75% 0.75% 0.75%
No. of active policyholders, end
of the month 99,250 98,506 97,767 97,034 96,306 95,584
Average no. of active
Budget Item July August September October November December
No. of active policyholders,
beginning of the month 95,584 94,867 94,155 93,449 92,748 92,053
Mid-term cancellation rate (%) 0.75% 0.75% 0.75% 0.75% 0.75% 0.75%
No. of active policyholders, end
of the month 94,867 94,155 93,449 92,748 92,053 91,362
Average no. of active
policyholders during the month 95,225 94,511 93,802 93,099 92,400 91,707
10-84

Chapter 10 – Strategy and the Master Budget
Chapter 10 – Strategy and the Master Budget
10-55 (Continued-4)
Active policies, end of December 91,362
Policy renewal rate 80.00%
No. of estimated policyholders, beginning of new year 73,090
Recap:
Estimated policy renewals, end of year:
Original assumption 80,038
4. What other information or data would be included in a full budget prepared each
month for this insurance company?
This question is meant to reinforce real-world complexities in the budget-
preparation process and the interrelationship (articulation) of various sub-budgets.
The following are some additional considerations for the present insurance
company example:
a) The schedules presented above assumed that the renewal date for all
policyholders was the end of December. Naturally, this is a simplification. In
b) Policyholder attrition rate is a variable that has to be modeled. Most
organizations working in financial services, such as an insurance company
where there are large numbers of policyholders paying monthly premiums,
would have sophisticated policyholder-retention models that measure the
1010-55 (Continued-5)
10-86
Education.

Chapter 10 – Strategy and the Master Budget
c) In the case of life insurance, where different policyholders pay different
d) For simplicity we assumed a constant monthly mid-term cancellation rate. The
e) This problem provides an excellent opportunity to introduce, within a financial
f) It is likely that some of the non-financial indicators in this company’s budget
(e.g., customer attrition rates) would also be included in the “Customer
10-87
Education.
Chapter 10 – Strategy and the Master Budget
10-56: Budgeting Insurance Policy Volume and Monthly Revenues (75-90 Minutes)
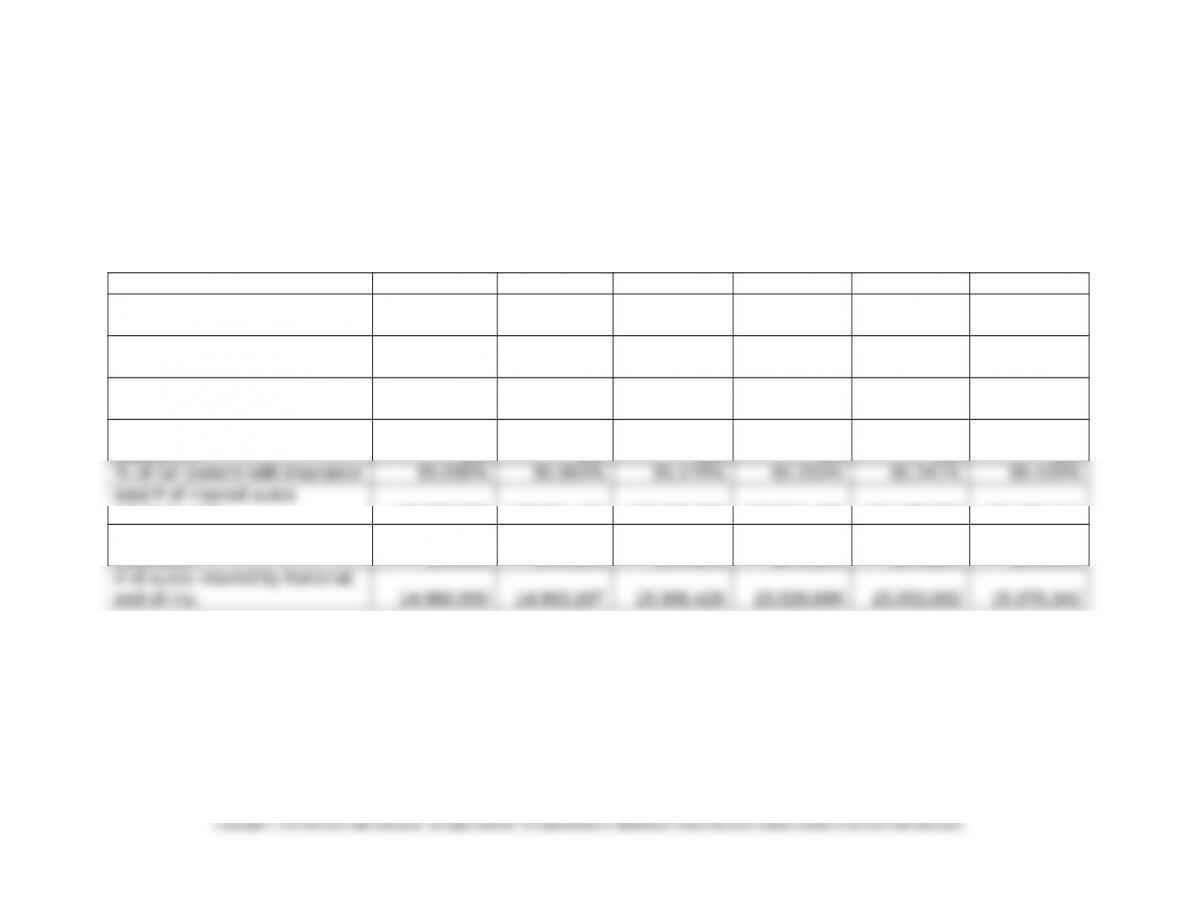
1. Monthly budgets broken down into three parts: market size and volume; volume for National Auto Insurance
Company; and, Premium Revenues earned.
January February March April May June
Part a: Market Size &
Volumes
Total # of households (market
size) 100,000,000 100,050,000 100,100,025 100,150,075 100,200,150 100,250,250
% of households–car
ownership 80.00% 80.00% 80.00% 80.00% 80.00% 80.00%
avg. # of cars owned per
household 2.2 2.2 2.2 2.2 2.2 2.2
(market-wide) 149,600,000 149,824,475 150,049,286 150,274,435 150,499,922 150,725,747
market share of National Auto
Insurance 10.00% 10.001% 10.001% 10.002% 10.002% 10.003%
10-88
Chapter 10 – Strategy and the Master Budget
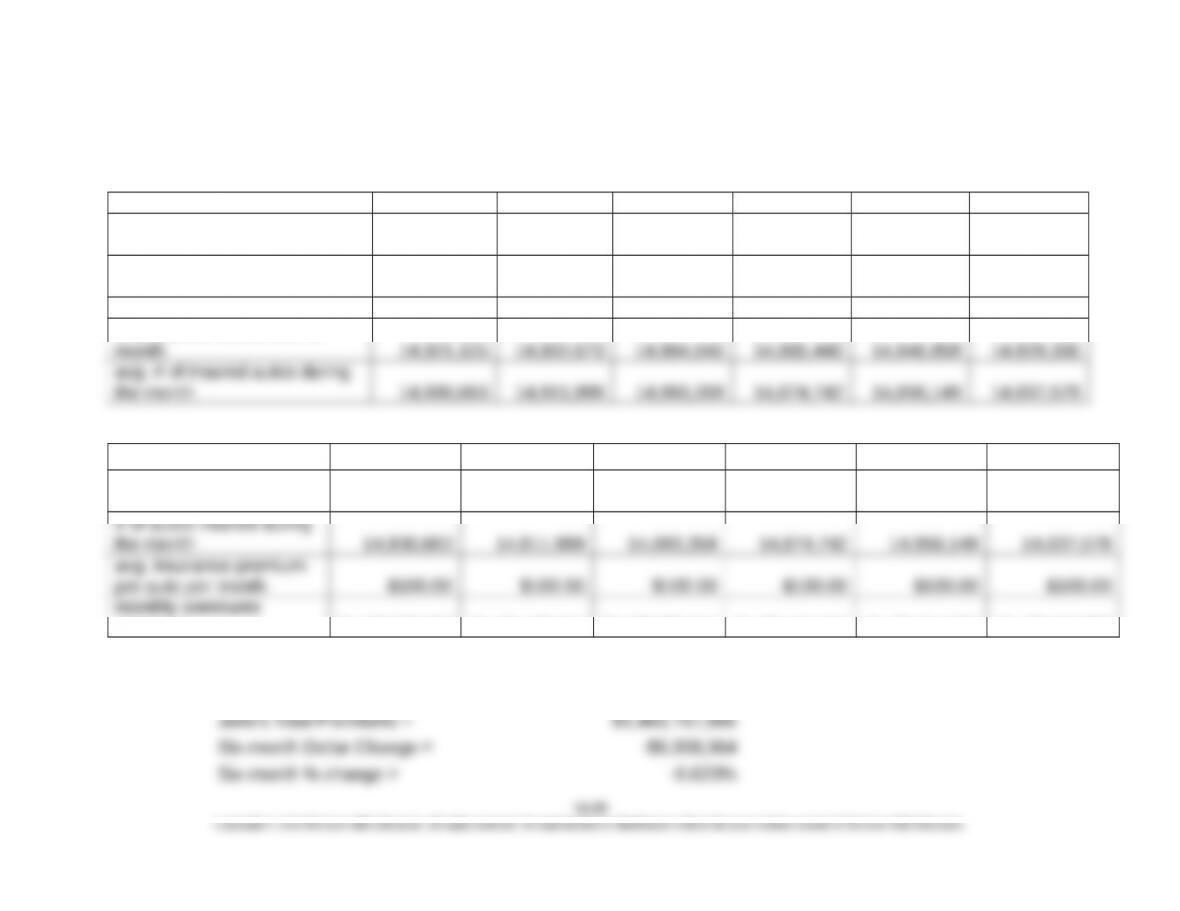
10-56 (Continued-2)
January February March April May June
Part b: Volume for National
Auto Insurance
# of autos insured, beginning
of month 14,940,000 14,921,325 14,902,673 14,884,045 14,865,440 14,846,858
cancellations during the month 18,675 18,652 18,628 18,605 18,582 18,559
# of insured autos, end of
January February March April May June
Part c: Volume for
National Auto Insurance
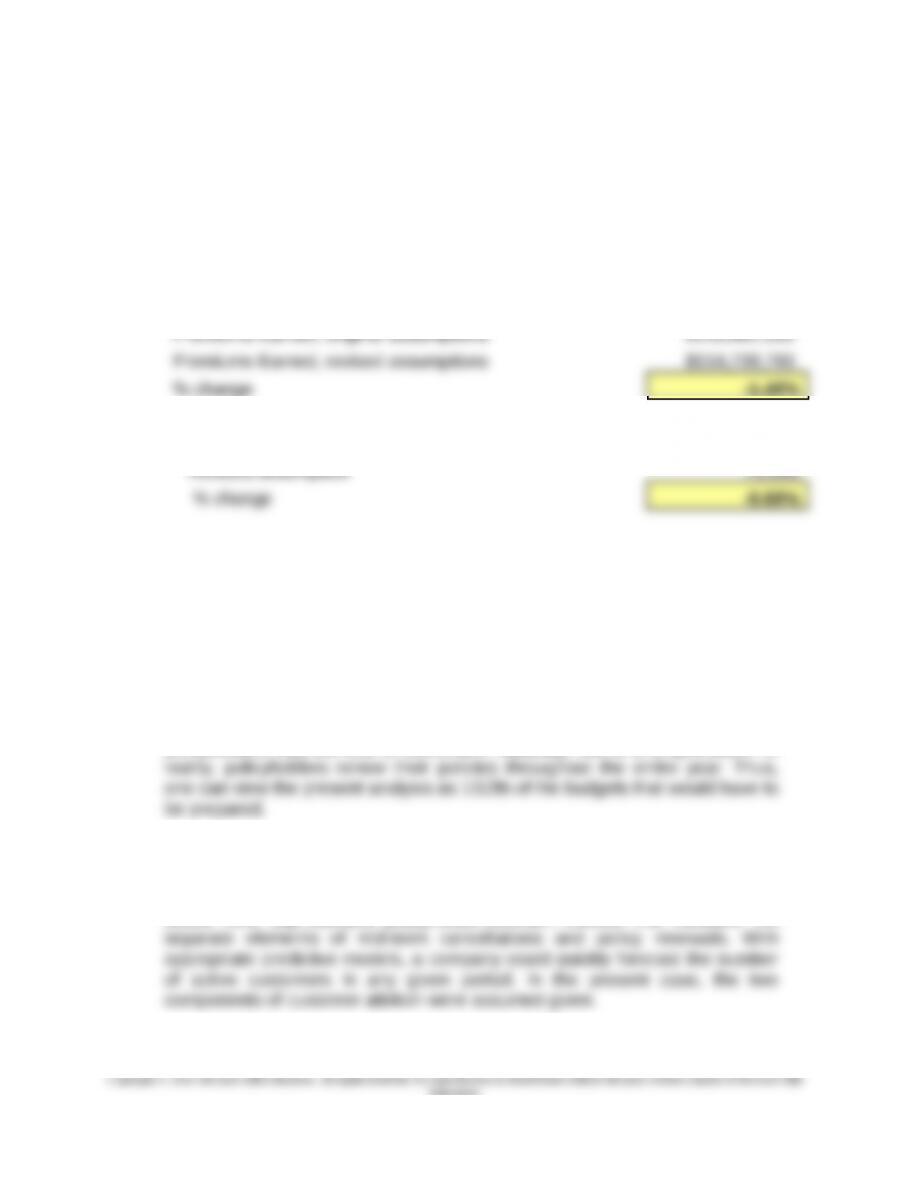
revenue $1,493,066,250 $1,491,199,917 $1,489,335,917 $1,487,474,247 $1,485,614,905 $1,483,757,886
Change in Total Premiums Revenue, January to June:
January’s Total Premiums = $1,493,066,250