Chapter 10 – Strategy and the Master Budget
10-37 (Continued)
2. Budgeted Operating Income–Current Year:
Sales Revenue (2,500 units × $1,500 per unit) =
$3,750,00
0
Less: Variable Costs (2,500 units × $1,000 per unit) =
$2,500,00
0
$1,250,00
Operating Income =
0
3. Scenario Analysis:
Percentage Change from Baseline
Sales
Volume
Selling
Price
Variable
Cost Total Fixed
Scenarios (units) per Unit per Unit Costs
a 0.00% 10.00% 0.00% 10.00%
b 0.00% 0.00% 5.00% (5.00%)
c (8.00%) 10.00% 0.00% 0.00%
Sales
Volume
Selling
Price
Variable
Cost Total Fixed
Scenario (units) per Unit per Unit Costs
Baseline 2,500 $1,500 $1,000 $200,000
a 2,500 $1,650 $1,000 $220,000
b 2,500 $1,500 $1,050 $190,000
c 2,300 $1,650 $1,000 $200,000
$ Difference % Change
Baseline
Operating
Budgeted
Operating
From
Baseline
from
Baseline
Scenario Income Income Op. Income Op. Income
Baseline $1,050,000 $1,050,000 $0 0.00%
a $1,050,000 $1,405,000 $355,000 33.81%
b $1,050,000 $935,000 ($115,000) (10.95%)
c $1,050,000 $1,295,000 $245,000 23.33%
10-30
Chapter 10 – Strategy and the Master Budget
10-38 Cash Budgeting: Not-for-Profit Context (45 minutes)
1. “Endowment fund:” a gift (contribution) whose principal must be maintained but whose
income may be expended. (You might use the example of an “endowed professorship”
as an example.)
2.
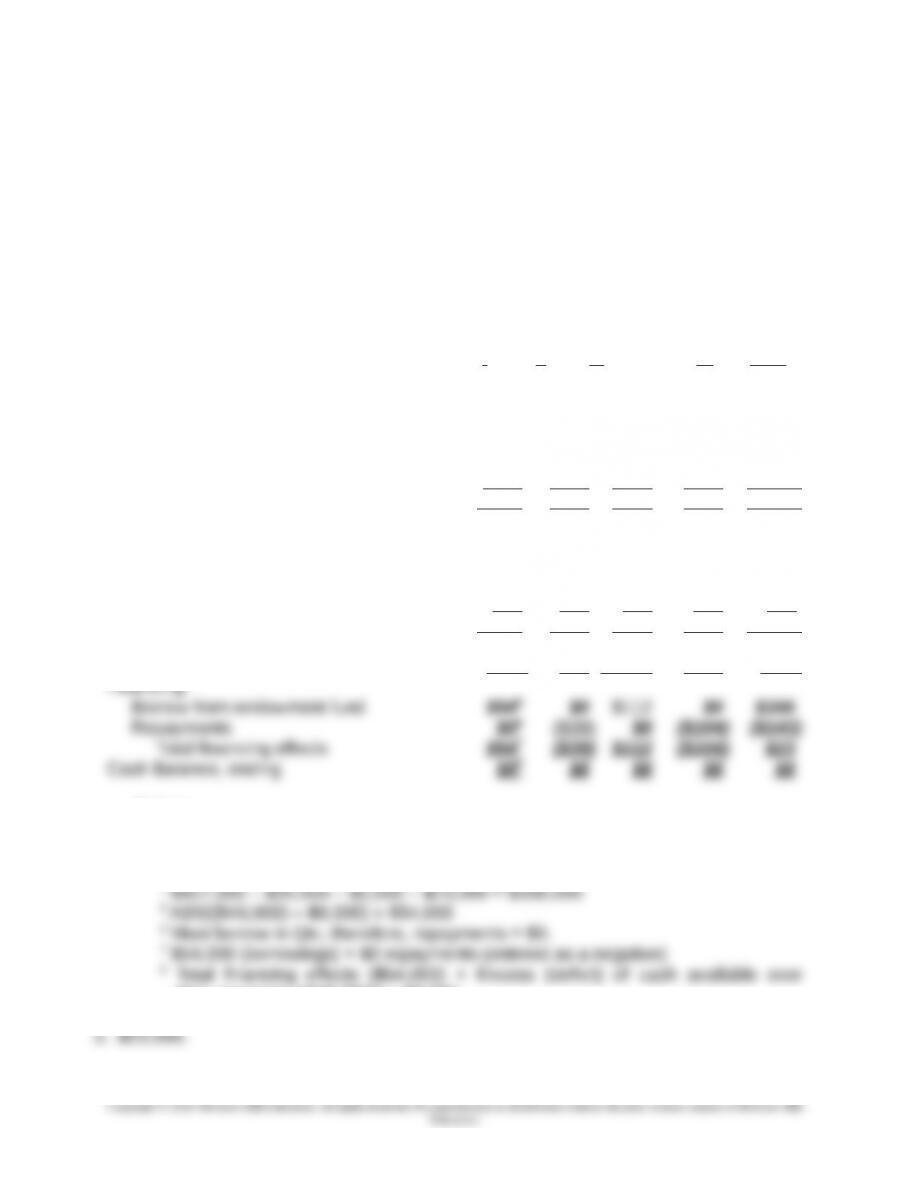
Cash Budget for Tri-County Social Service Agency
2016
(in thousands)
Quarters
I II III IV Year
Cash Balance, beginning $11 $8 $8 $8 $11
Receipts:
Grants $80 $70 $75 $75 $300
Contracts (evenly during year) $201$201$201$201$80
Mental Health Income (+5 in Qtrs. II, III) $20 $25 $30 $30 $105
Charitable donations $250 $350 $200 $400 $1 ,200
Total Cash Available $381 2
$473 $333 $533 $1 ,696
Less: Disbursements:
Salaries and Benefits $3354$342 $342 $346 $1,365
Office expenses $70 $65 $71 $50 $256
Equipment purchases & maintenance $2 $4 $6 $5 $17
Specific assistance $20 $15 $18 $20 $73
Total disbursements $427 3
$426 $437 $421 $1 ,711
Excess (deficiency) of cash available
over disbursements ($46 ) $47 ($104) $112 ($15 )
Notes:
1 Annual total ($80,000) ÷ 4
2 $11,000 + $80,000 + $20,000 + $20,000 + $250,000 = $381,000
3 $381,000 – ($46,000) = $427,000
4 $427,000 – $20,000 – $2,000 – $70,000 = $335,000
disbursements (($46,000)) = $8,000
10-31
Chapter 10 – Strategy and the Master Budget
10-38 (Continued)
4. It is probable that both donations and requests for services are unevenly distributed
Chapter 10 – Strategy and the Master Budget
10-39 Budgeting: Not-for-Profit (NFP) Context (30 minutes)
1. Stewardship is defined by Merriam-Webster Online Dictionary as “the conducting,
supervising, or managing of something; especially: the careful and responsible
management of something entrusted to one’s care.”
The Socially Responsible Investment Guidelines cited states: “Although it is a
moral and legal fiduciary responsibility of the trustees to ensure an adequate return
on investment for the support of the work of the church, their stewardship
embraces broader moral concerns.” Also, the principles of stewardship lists two
fundamental and interdependent principles: “The Conference should exercise
responsible financial stewardship over its economic resources.” and “The
Conference should exercise ethical and social stewardship in its investment
policy.”
The latter states: “Socially responsible investment involves investment strategies
based on Catholic moral principles. These strategies are based on the moral
demands posed by the virtues of prudence and justice. They recognize the reality
that socially beneficial activities and socially undesirable or even immoral activities
are often inextricably linked in the products produced and the policies followed by
2. “These two major principles work together to encourage the Conference to identify
investment opportunities that meet both our financial needs and our social criteria.
10-33
Chapter 10 – Strategy and the Master Budget
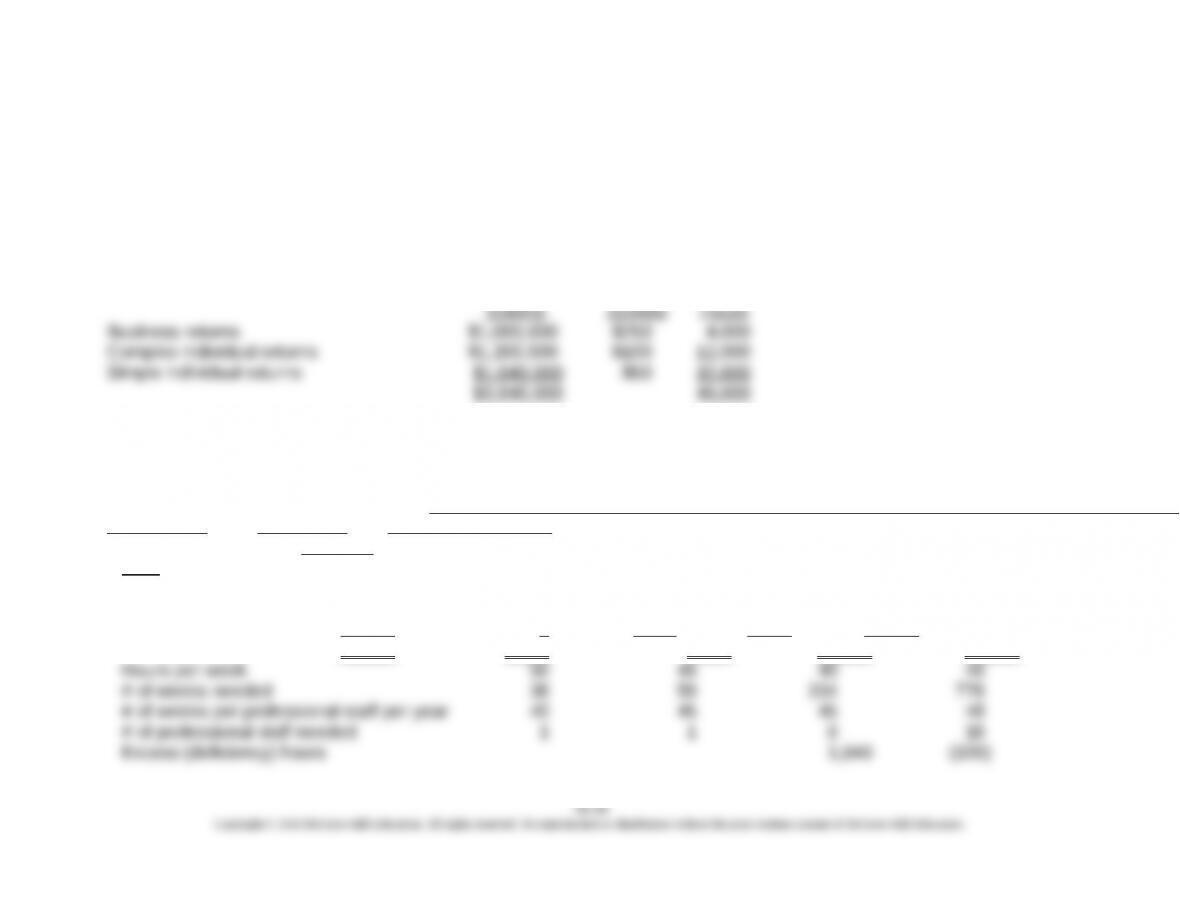
10-40 Budgeting for a Service Firm (75 minutes)
1.
Total hours for the budgeted activities:
Hourly
Budgeted Charge
Revenue Rate Required
Professional staff requirements for the budgeted revenue:
Senior
Total Hours
Manager Consultant _Consultant_
Required
Total Each Total
Business returns 4,000 0.30 1,200 0.20 800 0.502,000 0.00 0
Complex individual returns 12,000 0.05 600 0.15 1,800 0.404,800 0.40 4,800
Simple individual returns 32,800 0.00 0 0.00 0 0.20 6 ,560 0.80 26 ,240
Total Hours 48,800 1,800 2 ,600 13 ,360 31 ,040

Chapter 10 – Strategy and the Master Budget
Note: Because Consultants can be hired on a part-time basis, we round the calculation DOWN for this class of labor. The
other three labor classes are given (i.e., do not have to be planned for based on data in the problem).
Since, according to the present staffing plan and anticipated workload needs, there is an excess of senior
consultant hours, the budgeted cost for overtime hours worked by senior consultants would be $0.
10-35
Chapter 10 – Strategy and the Master Budget
10-40 (Continued-1)
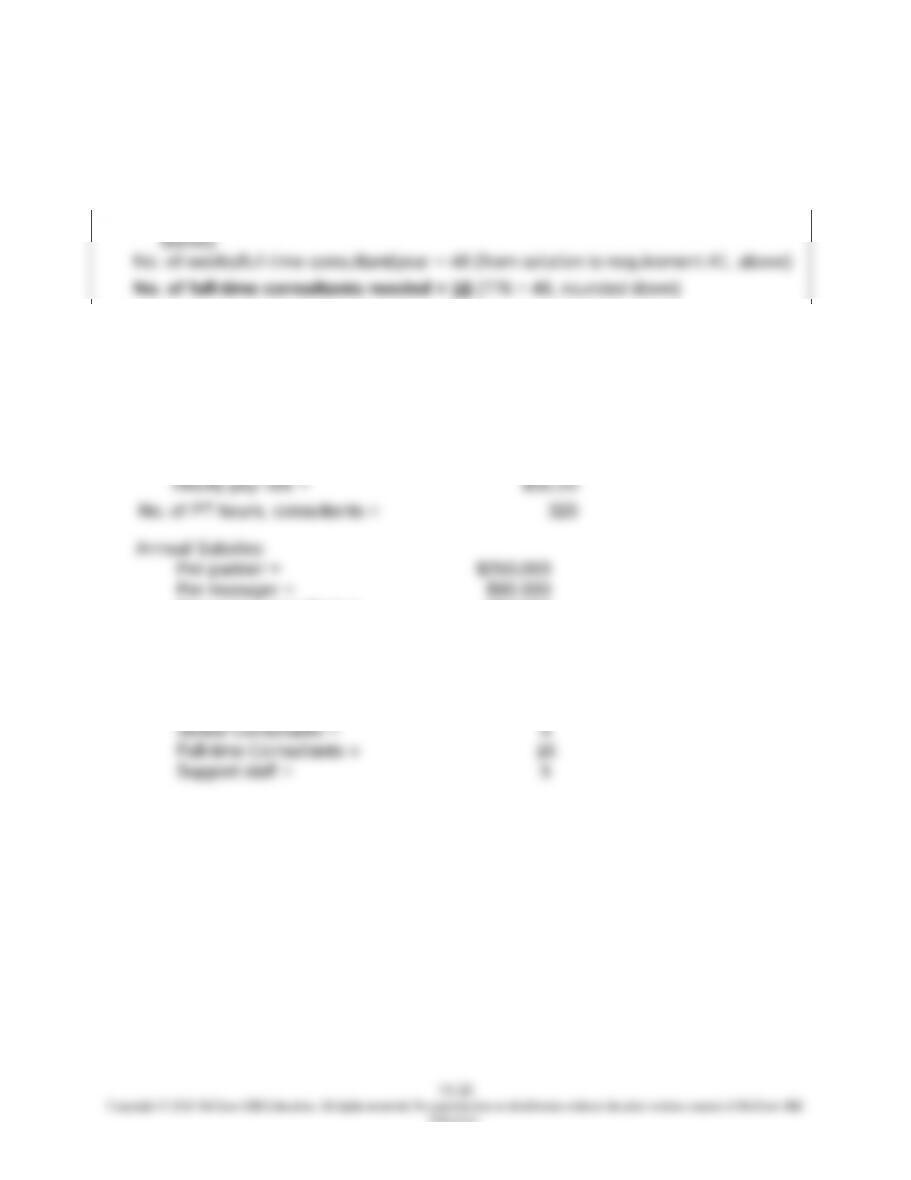
2. Number of full-time consultants needed for the year:
No. of consultant-weeks needed for the year = 776 (from solution to requirement #1,
3. The manager’s total compensation, assuming that the revenues from preparing tax
returns remains the same:
Consultant’s pay:
Earning per year = $60,000
Hrs. worked/year = 1,920
Per senior consultant = $90,000
Per support staff = $40,000
Staffing Plan:
Partners = 1
Managers = 1
Education.
Chapter 10 – Strategy and the Master Budget
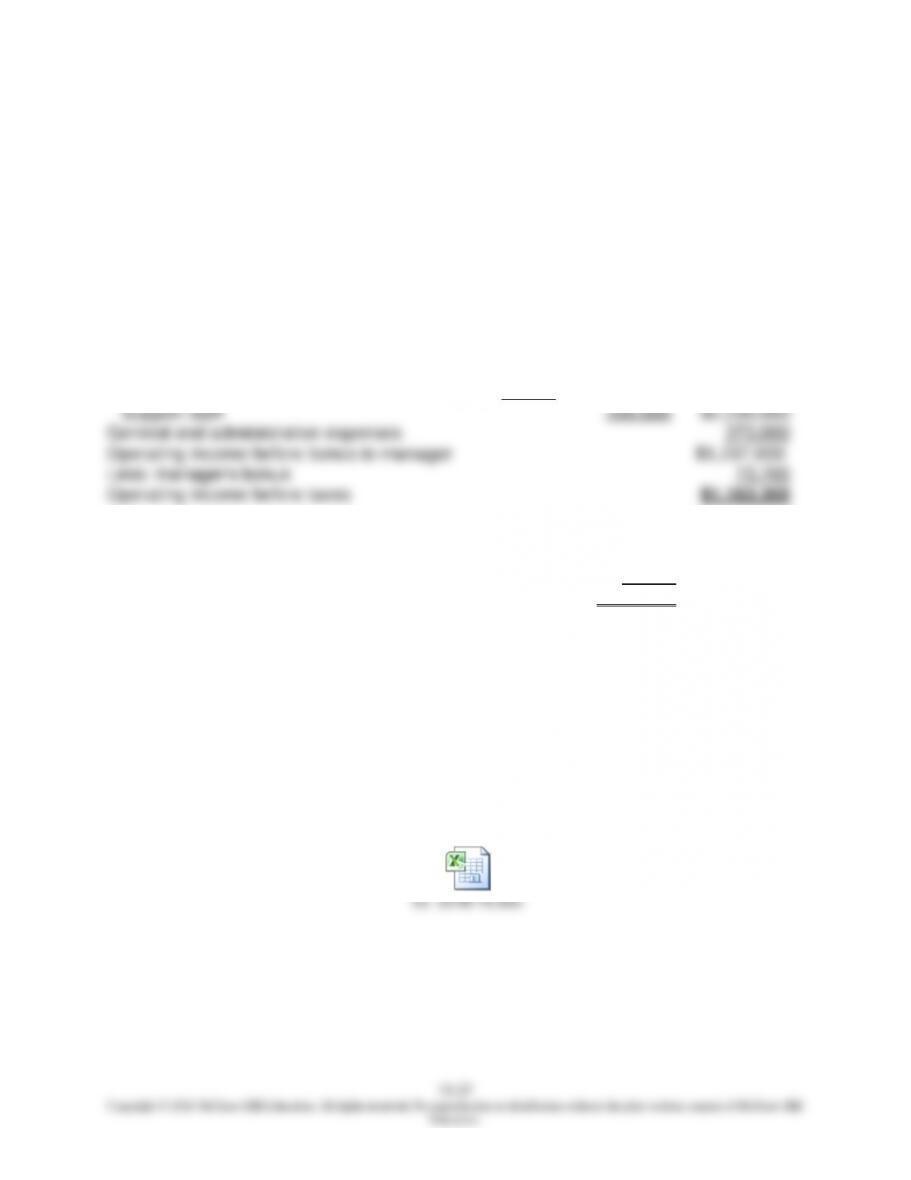
10-40 (Continued-2)
AccuTax, Inc.
Budgeted Operating Income
For the Year ended August 31, 2016
Revenue $3,840,000
Payroll expenses:
Partner $250,000
Manager 90,000
Senior consultants—base pay 720,000
Senior consultants—pay for overtime hours 0
Consultants:
Full-time $960,000
Part-time 10,000 970,000
Total compensation for the manager:
Salary (given) $90,000
Bonus (0.10 × [$1,237,000 − $500,000]) 73,700
Total $163,700
Note to Instructor: An Excel spreadsheet solution file is embedded in this document. You
can open the spreadsheet “object” that follows by doing the following:
1. Right click anywhere in the worksheet area below.
2. Select “Worksheet Object,” then “Open.”
3. To return to the Word document, select “File” and then “Close and return to…”
while you are in the spreadsheet mode.
Ex. 10-40 7e.xlsx
Chapter 10 – Strategy and the Master Budget
10–41 Activity–Based Budgeting (ABB) (30 Minutes)
1. Total budgeted cost for each activity and for the Business Services Division for
January 2016:
Budgeted Cost-
Activity Activity Driver Rate Total Cost
Storage 400,000 $0.4925 $ 197,000
Requisition Handling 30,000 $12.50 $ 375,000
Pick Packing 800,000 $ 1.50 $1,200,000
Data Entry 800,000 $ 0.80 $ 640,000
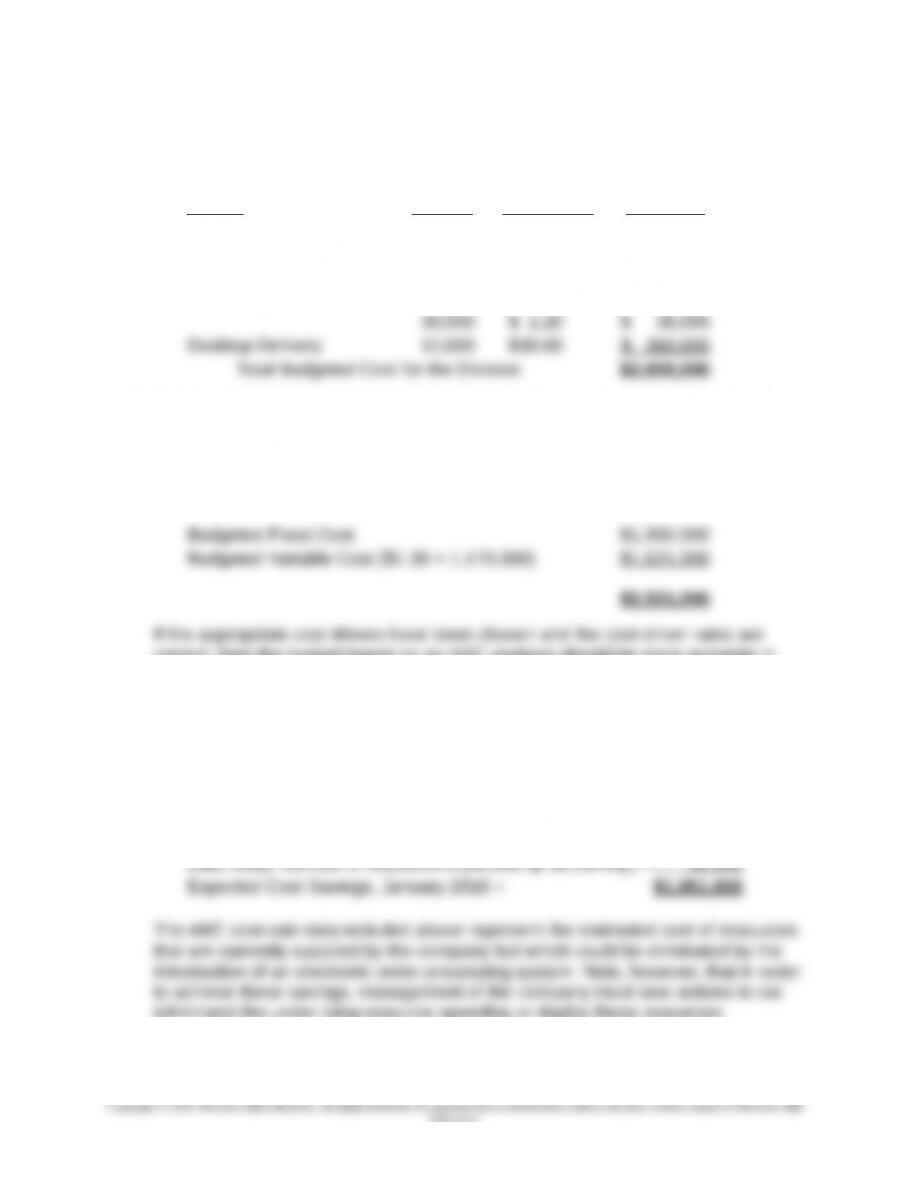
2. Activity-related data are not available. The only data you have is that budgeted
fixed cost per month is $1,000,000 and budgeted variable cost per carton is
$1.30. Using this approach, what is the estimated cost for the month? Compare
and comment on how your answer here differs from the answer to Requirement 1.
Budgeted total Cost for the Division for the Month of January:
correct, then the budget based on an ABC analysis should be more accurate in
terms of depicting the resource consumption (or resource demands) on the
organization for the coming month. Put another way, the use of a single, volume-
based cost driver will not likely capture the underlying economics of the
company’s support activities and associate cost.
3. Expected saving in costs—January 2016:
Requisition Handling (30,000 @ $12.50/requisition) = $ 375,000
Data Entry: number of lines (800,000 @ $0.80/line) = 640,000
(eliminate) the under-lying resource spending or deploy these resources
elsewhere. In other words, the savings will not likely occur automatically.
10-38
Education.

Chapter 10 – Strategy and the Master Budget
10-41 (Continued)
If the company uses a single cost-rate system based on the number of cartons
delivered, it will not be able to estimate the cost savings without special efforts to
10-39
Education.