Chapter 10 – Strategy and the Master Budget
CHAPTER 10: STRATEGY AND THE MASTER BUDGET
QUESTIONS
10-1 Compel strategic planning and facilitate implementation of strategic plans. An
organization’s strategy, strategic plans, and budgets are interrelated. Preparing
budgets compels reviews of an organization’s strategy and its strategic plans and
can facilitate implementations of the strategic plan. Feedback from budgets often
results in improvements to an organization’s strategy and strategic plan.
and may not be suitable to serve as a benchmark. To the extent past performance
was not effective/efficient it does not make sense to use this as the standard
against which actual performance is compared.
Promote coordination and communication within the organization. Budgets compel
managers to think of interdependencies and interrelationships among subunits of
10-2 A master budget is a comprehensive plan of action for a future period; as such, the
master budget includes both operating and financial budgets. An operating budget
consists of plans regarding revenues and resource acquisition/use across all major
operating areas of the organization (e.g., sales, production, purchasing, marketing,
10-3 Many organizations are “run by the numbers.” In these organizations managers are
held accountable for financial results and therefore need to be “data literate” as
10-1
Education.
Chapter 10 – Strategy and the Master Budget
10-4 Some would argue that the primary purpose of budgets is for planning and that
problems are created when budgets are used for control and incentive-
compensation purposes. The latter use of budgets is thought to engender both
unethical practices (e.g., ENRON, WorldCom) or, more prevalently, gaming
behavior. For example people whose performance will be compared to the budget
targets may understate their potential in order to have achievable targets set.
performance and to meet budget projections.
10-5 The sales budget is often regarded as the cornerstone in the master budget
because all operating activities in a business emanate from efforts to attain the
level of sales specified in the sales budget. A firm can complete the plan for other
activities of a period only after it knows the expected sales levels for the current
and the immediate future periods. A manufacturing firm, for example, cannot
complete its production schedule for the upcoming period without knowing the
10-6 Additional factors include:
Beginning and desired ending inventories of work-in-process (WIP) and
finished goods
10-7 A cash budget that is prepared according to the statement of cash flows required
for external reporting purposes generally includes five components:
Beginning-of-period cash balance
Net cash flow from operations
10-2
Education.
Chapter 10 – Strategy and the Master Budget
10-8 Zero-base budgeting (ZBB) is a budgeting process that requires managers to
prepare budgets each period from ground zero for all operations.
A typical budgeting process is “incremental” in nature. That is, budgets for the
upcoming period start from the approved budgets for the current period, with
amounts added to reflect planned changes for the upcoming period. Thus,
traditional budgets assume that most, if not all, of the current activities and
A number of companies (e.g., Xerox, Texas Instruments) and government
organizations (e.g., State of Georgia) have at one time or another used ZBB.
10-9 Budgetary slack, or “padding” the budget, is the practice of knowingly including a
higher amount of expenditure in the budget (or lower amount of revenue) than
managers actually believe should be the case. One reason that it is common to
find slacks in budgets is the desire of managers to use such slack as a cushion for
the amount of resources they feel they actually need.
10-10 A time-driven activity-based cost (TDABC) system, as explained in Chapter 5, is a
refinement and simplification of a traditional ABC system. Rather than identifying
activities and associated activity costs, a TDABC system calculates a cost rate for
each major activity, process, or department using only pieces of information: (1)
Advocates of TDABC believe that this system both reduces the cost of
implementing an ABC system and improves the accuracy of the resulting activity-
cost data. Resulting activity-cost data from a TDABC system can be used, as is
10-3
Education.
Chapter 10 – Strategy and the Master Budget
10-11 A fixed-performance contract refers to the performance associated with the results
reflected in the master (static) budget that is prepared at the beginning of the year.
This amount is “fixed” in the sense that the amount is negotiated prior to the
beginning of the budget period and not adjusted afterwards. For incentive-
10-12 A fixed-performance contract implies a fixed (static) target, usually negotiated
prior to the start of the budget period. Incentive compensation (i.e., managerial
reward) is contingent on whether, or the extent to which, this fixed target is
achieved during the period. In typical fixed-performance contracts there are
minimum and maximum rewards. Thus, the performance-reward contract is
discontinuous.
By contrast, an organization can employ a “linear performance contract.” Quite
literally, this implies a zero compensation if performance (e.g., operating income)
is zero (or negative). It also implies unlimited compensation for extraordinary
10-13 The term “relative performance contract” means that the basis against which
actual managerial performance is compared is either an internal or an external
benchmark, rather than budgeted performance embodied in the annual (fixed or
The use of both “relative performance contracts” and “rolling financial forecasts”
are key recommendations set forth by the Beyond Budgeting Roundtable
(www.bbrt.org). Also, see Jeremy Hope and Robin Fraser, Beyond Budgeting:
How Managers Can Break Free from the Annual Performance Trap. Boston, MA:

Chapter 10 – Strategy and the Master Budget
“Who Needs Budgets?” HBR OnPoint Product Number 306X. Boston, MA:
Harvard Business School Publishing Corporation, 2003.
10-5
Education.
Chapter 10 – Strategy and the Master Budget
BRIEF EXERCISES
10-14
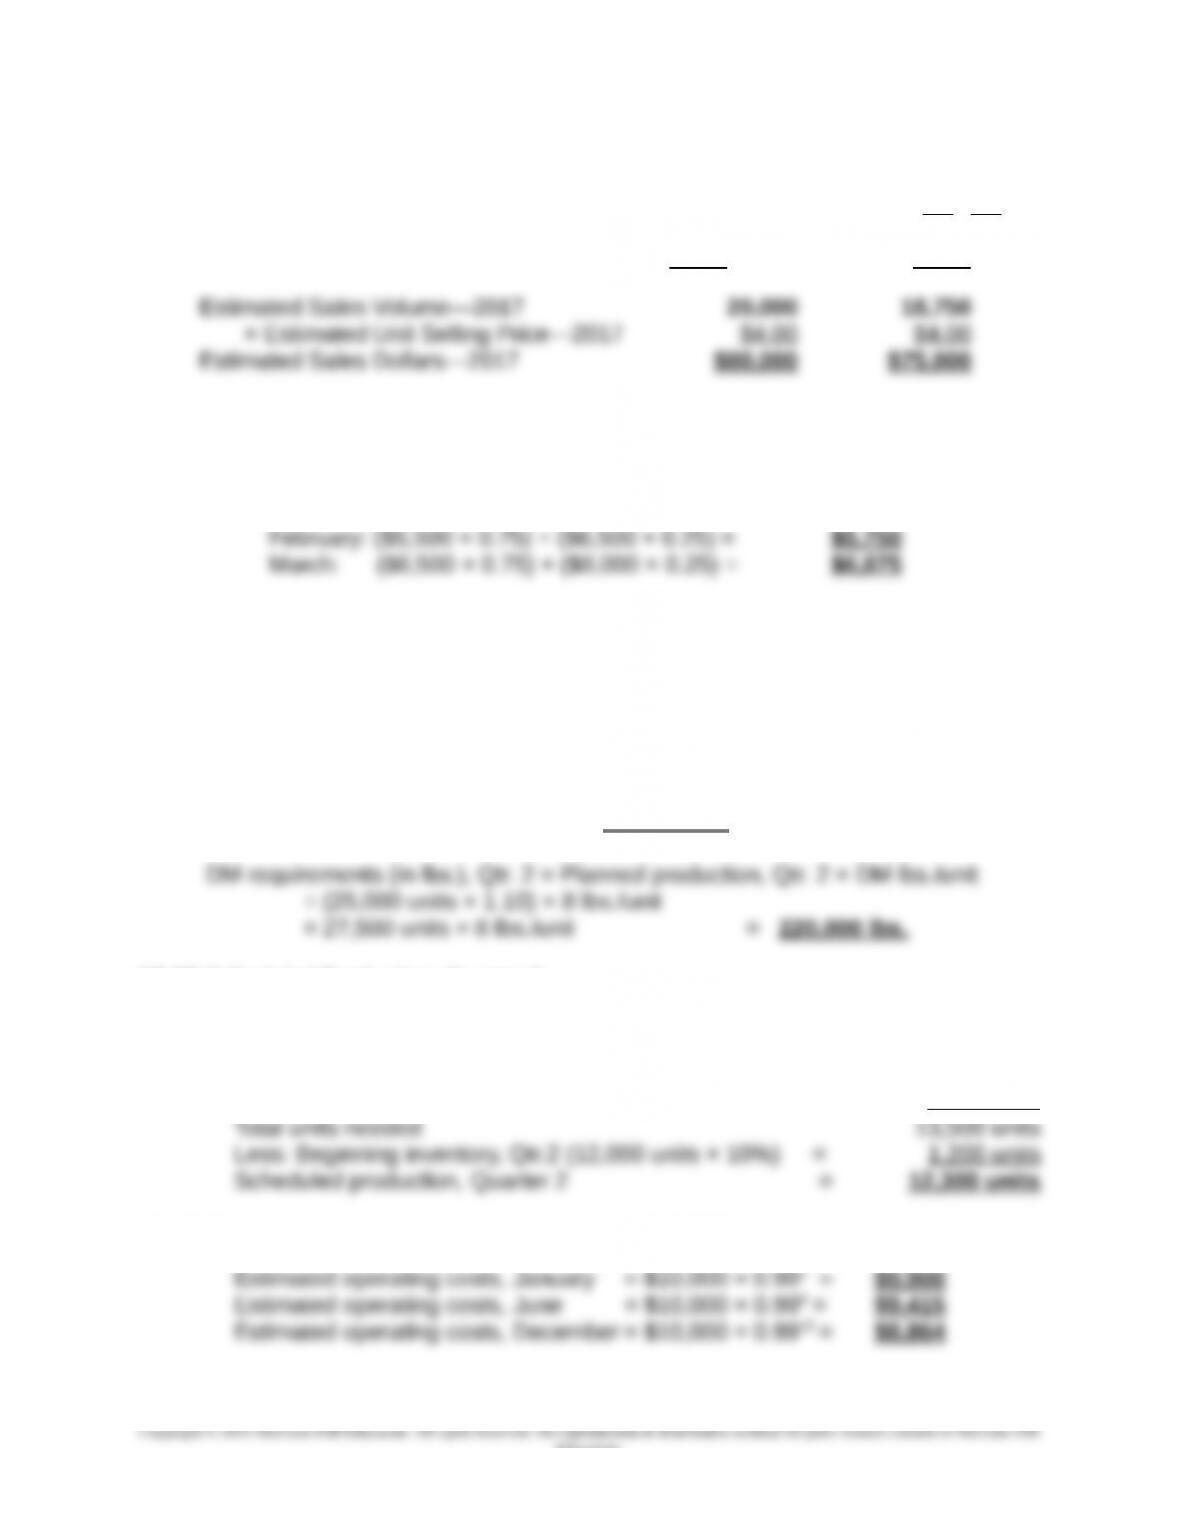
Q2 Q3
Sales—2016 16,000 15,000
Plus projected 25% increase for 2017 4,000 3,750
10-15 Payment history:
% paid in month of purchase: 25%
% paid in month following month of purchase: 75%
Expected Cash Disbursements:
10-16 Number of units produced in Qtr. 1:
Ending inventory of direct materials (DM) = 50,000 lbs.
Target ending inventory % = 25% of following month’s production
requirements
Therefore, DM used for production in Qtr. 1 = 50,000 ÷ 0.25 = 200,000 lbs.
Units produced in Qtr. 1 = lbs. of DM used/lbs. of DM per unit of
output = 200,000 ÷ 8 = 25,000 units
10-17 Scheduled Production, Quarter 2:
Units required to meet estimated sales, Qtr. 2 = 12,000 units
Units required to meet targeted ending inventory:
15,000 units × 10% = 1,500 units
10-18 Current level of monthly operating costs = $10,000:
10-6
Education.
Chapter 10 – Strategy and the Master Budget
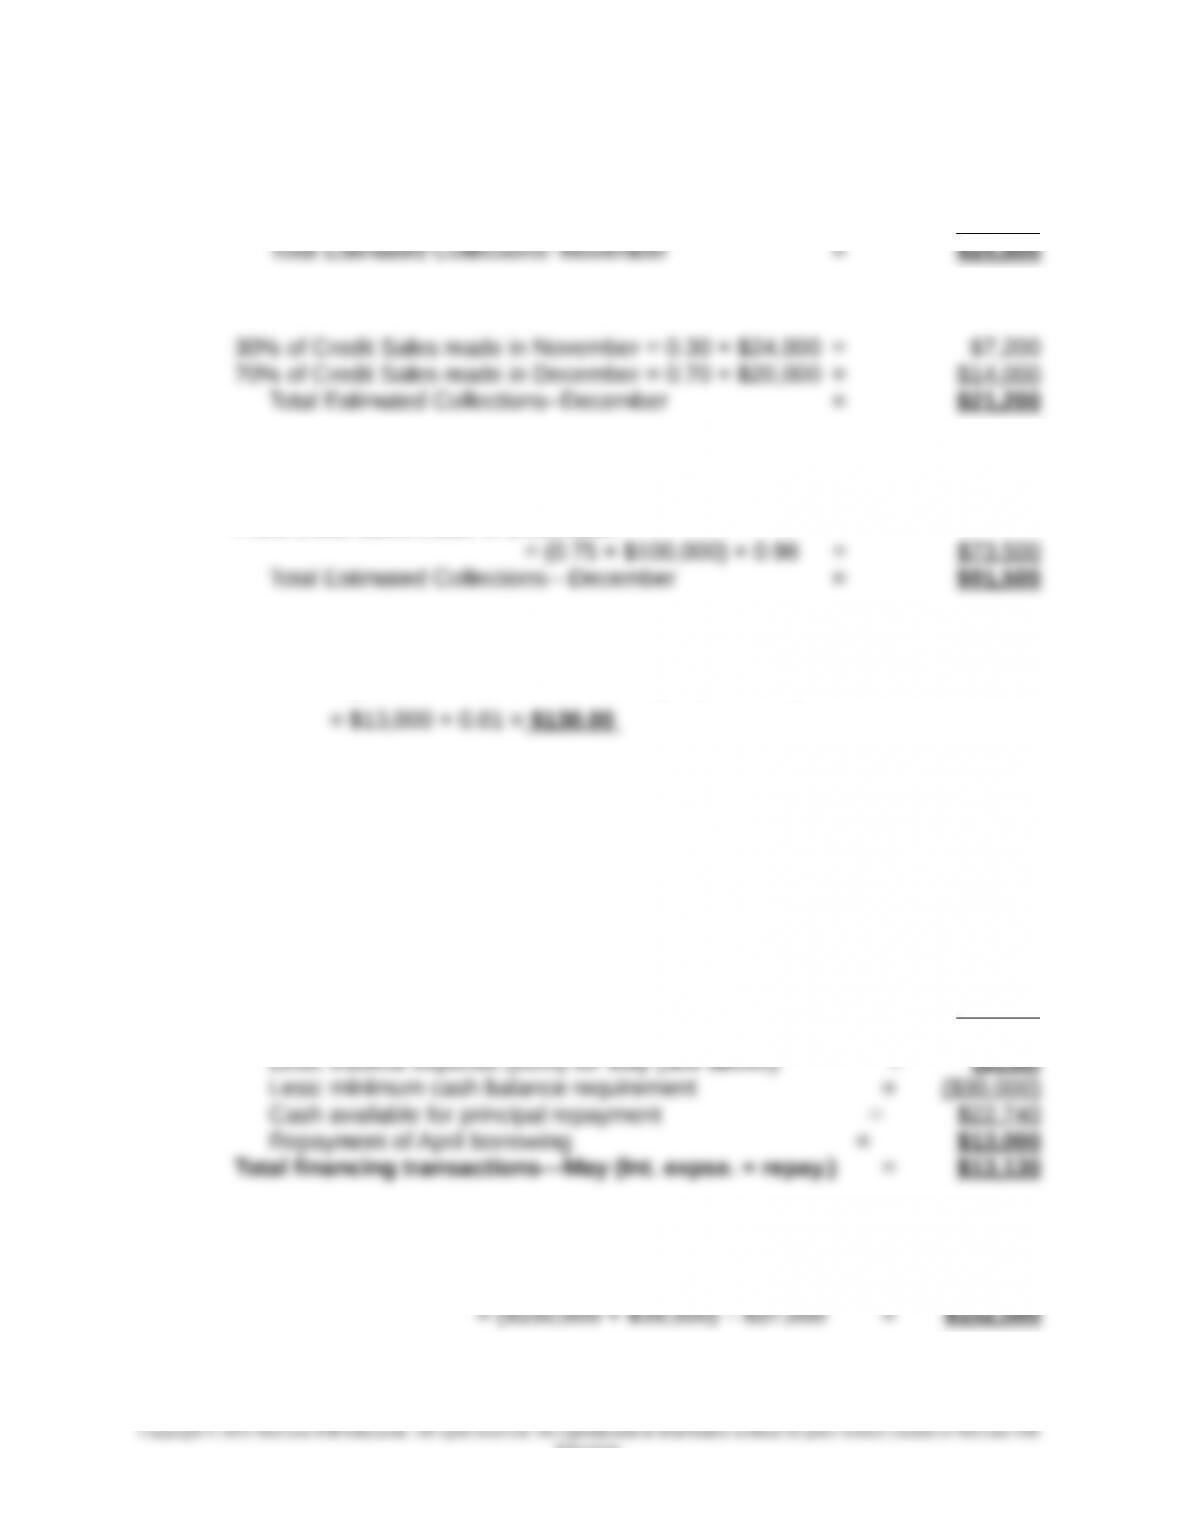
10-19 Collection of Credit Sales—November 2016:
30% of Credit Sales made in October = 0.30 × $30,000 = $9,000
70% of Credit Sales made in November = 0.70 × $24,000 = $16,800
Collection of Credit Sales—December 2016:
10-20 Collection of Credit Sales—December:
From credit sales made in November = 0.20 × $90,000 = $18,000
From credit sales made in December:
10-21 Estimated interest expense—April = borrowing in April × (annual rate ÷ 12)
= [($30,000 − $18,000) + $1,000] × (0.12 ÷ 12)
Note that, strictly speaking, to maintain a minimum cash balance of $30,000, the
company would have to borrow an extra $1,000 to be able to cover the interest
payment (eom) and still have at least $30,000 of cash.
Estimated financing transactions—May:
Interest expense (paid eom): $13,000 × 0.01 = $130
Principal repayment:
Beginning-of-month cash balance
= $18,000 + ($13,000 − $130) = $30,870
Plus: net cash flow in May, prior to financing = $22 ,000
Cash balance prior to financing transactions = $52,870
10-22 Direct Material (DM) Purchases, December = (DM issued to production +
ending DM inventory) – beginning DM inventory
10-7
Education.
Chapter 10 – Strategy and the Master Budget
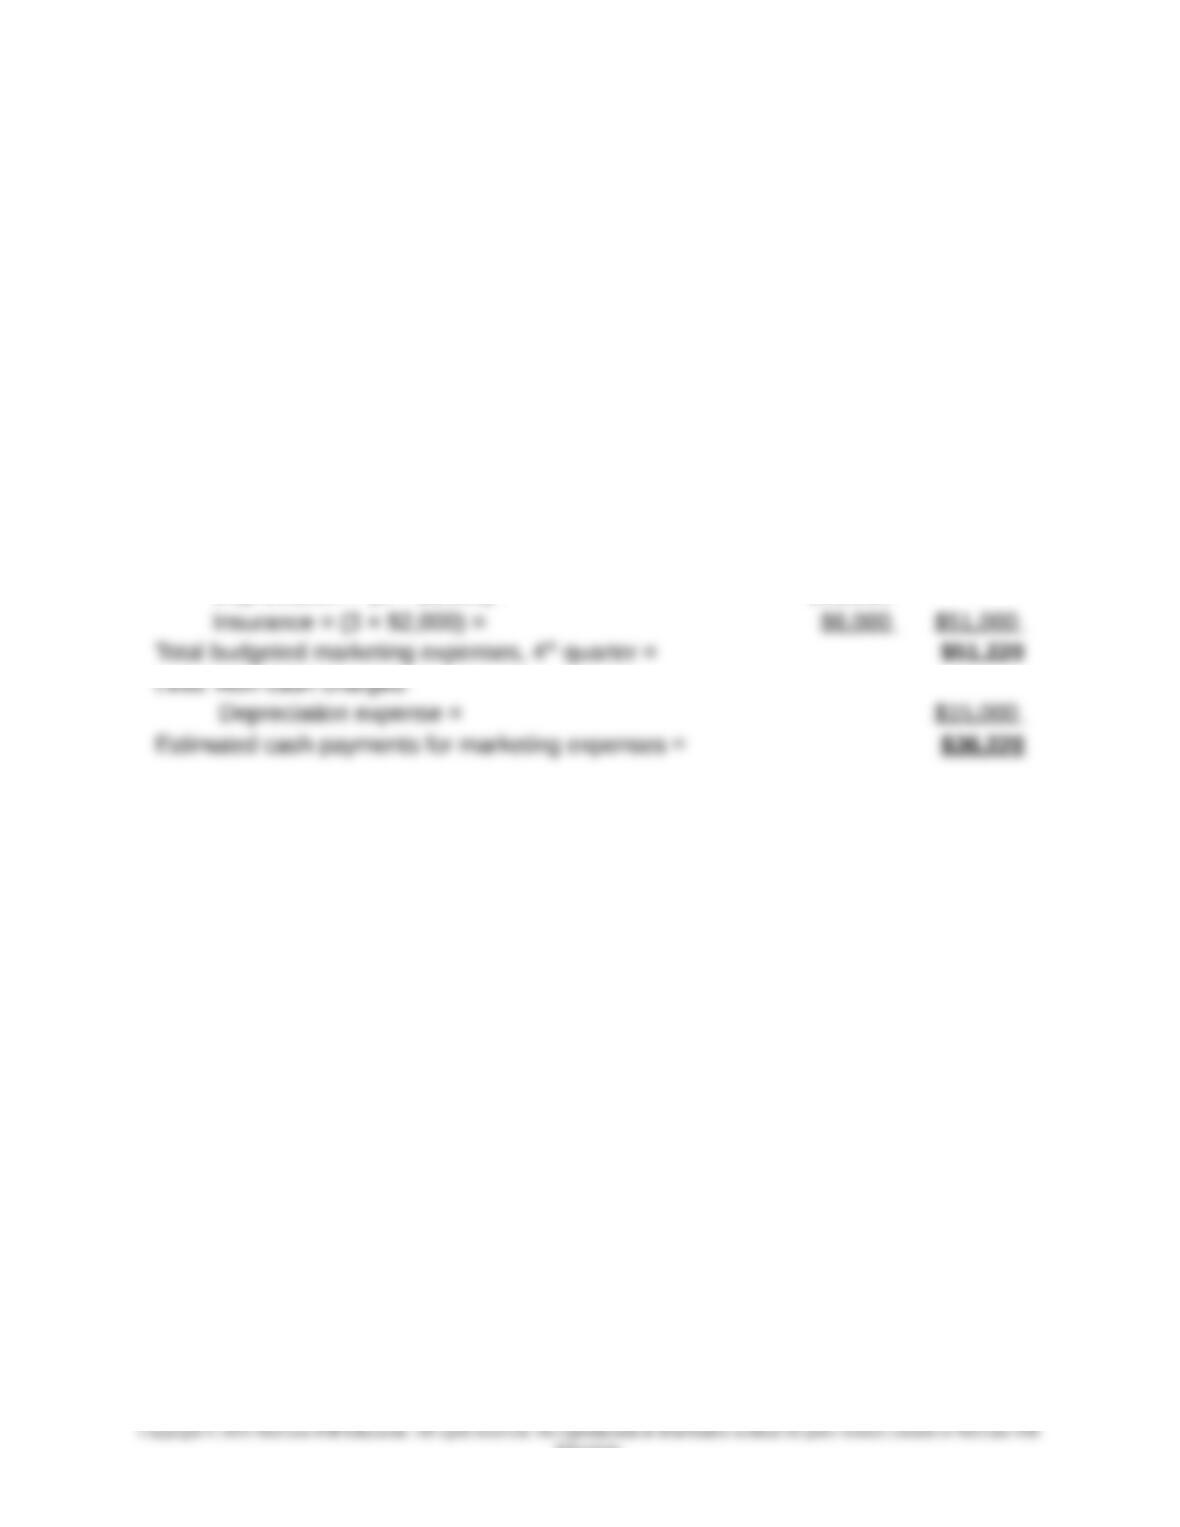
10-23 Total budgeted marketing expenses, 4th quarter:
Sales volume (units):
3rd Quarter (actual) = 4,000
Estimated 4th-Qtr. Increase = 10%
Variable marketing expenses, per unit sold = $0.05
Fixed marketing expenses, per MONTH:
Salaries (cash) = $10,000
Depreciation–delivery trucks = $5,000
Insurance (paid monthly) = $2,000
Total budgeted marketing expense and cash payments, 4th quarter:
Variable costs ($0.05 × [4,000 units × 1.10]) = $220
Fixed costs:
Salaries = (3 × $10,000) = $30,000
Depreciation = (3 × $5,000) = $15,000
10-8
Education.
Chapter 10 – Strategy and the Master Budget
EXERCISES
10-24 Purchase Discounts (25 minutes)
The financial cost of not taking advantage of the early-payment discount for
purchases made on credit can be approximated by the following formula (we use
the term “approximate” here to denote the fact that the estimate below does not
assume compounding of interest and as such provides a conservative estimate):
Opportunity cost (%) = [discount % ÷ (1 − discount %)] × [365 ÷ no. of
extra days allowed if discount is not taken]
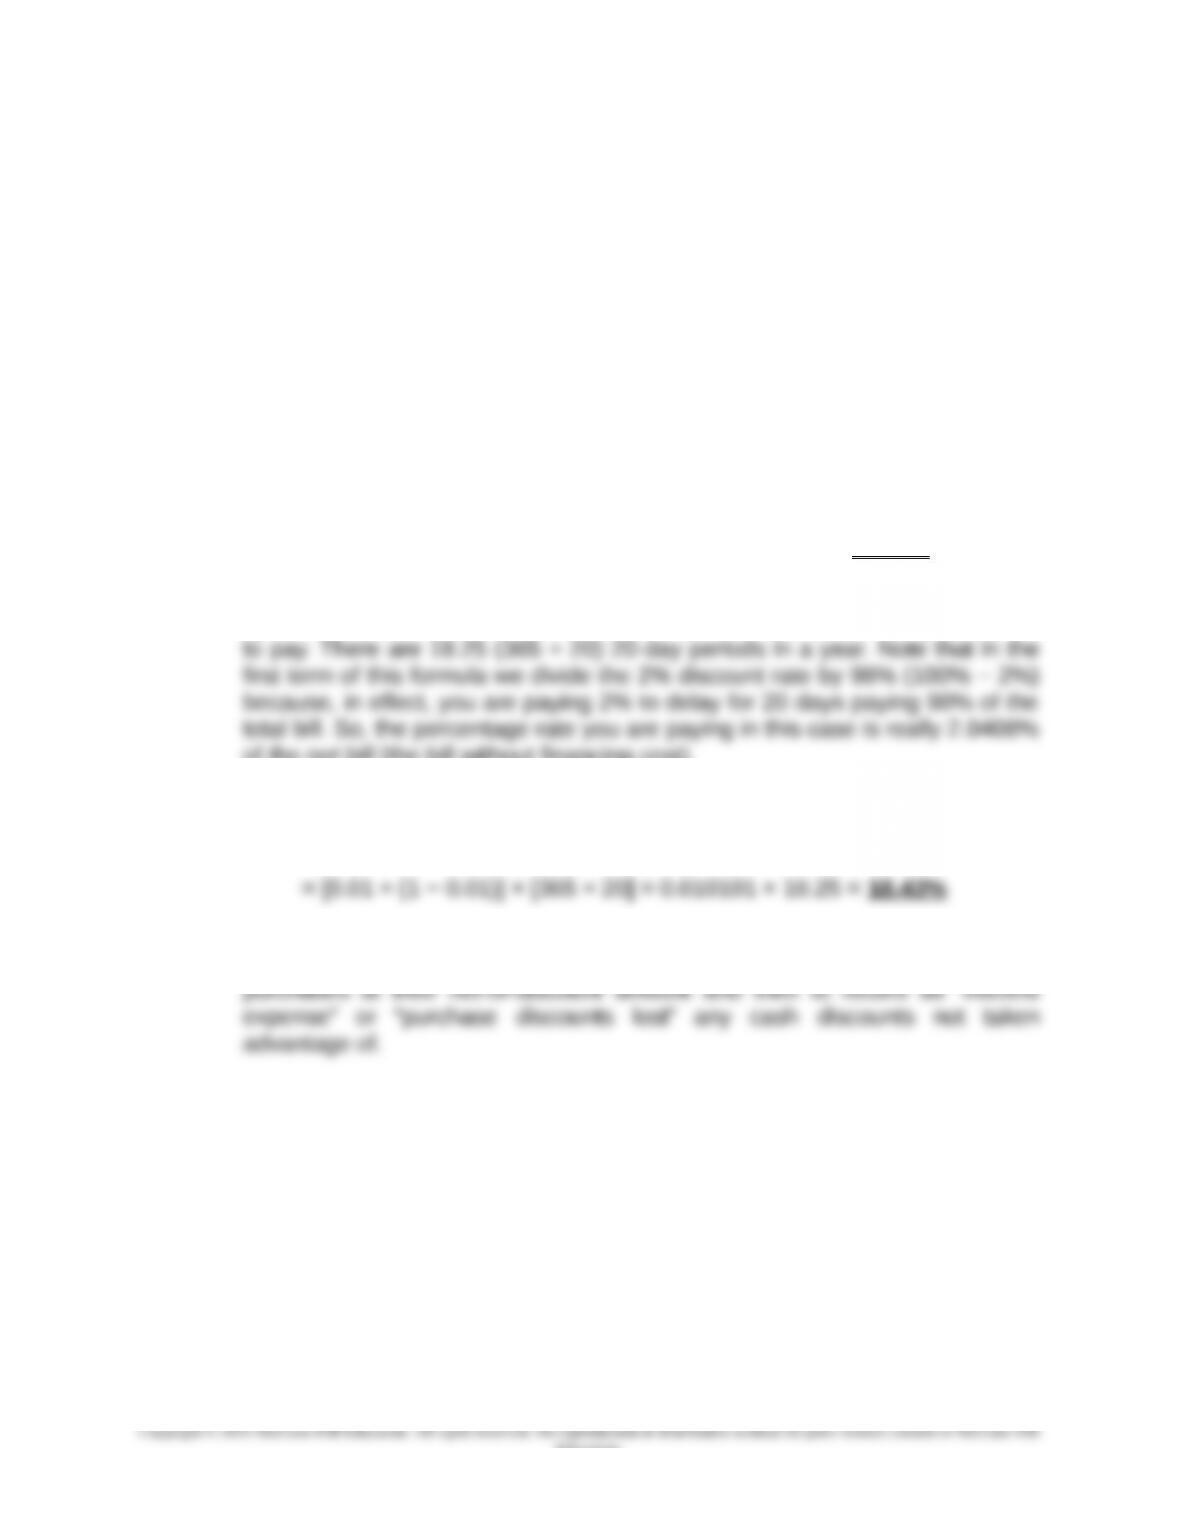
1. In the case of 2/10, n/30, the approximate economic cost of not taking
advantage of the early-payment discount is:
= [0.02 ÷ (1 − 0.02)] × [365 ÷ 20] = 0.020408 × 18.25 = 37.24%
Basically, if you choose not to take the early-payment discount, you are giving
up a 2% discount (on the net amount) in return for an extra 20 days in which
of the net bill (the bill without financing cost).
2. In the case of 1/10, n/30, the opportunity cost of not taking advantage of the
early-payment cash discount is:
3. Given the significant opportunity cost of not taking advantage of early-
payment cash discounts, good accounting practice would be to record
10-9
Education.
Chapter 10 – Strategy and the Master Budget
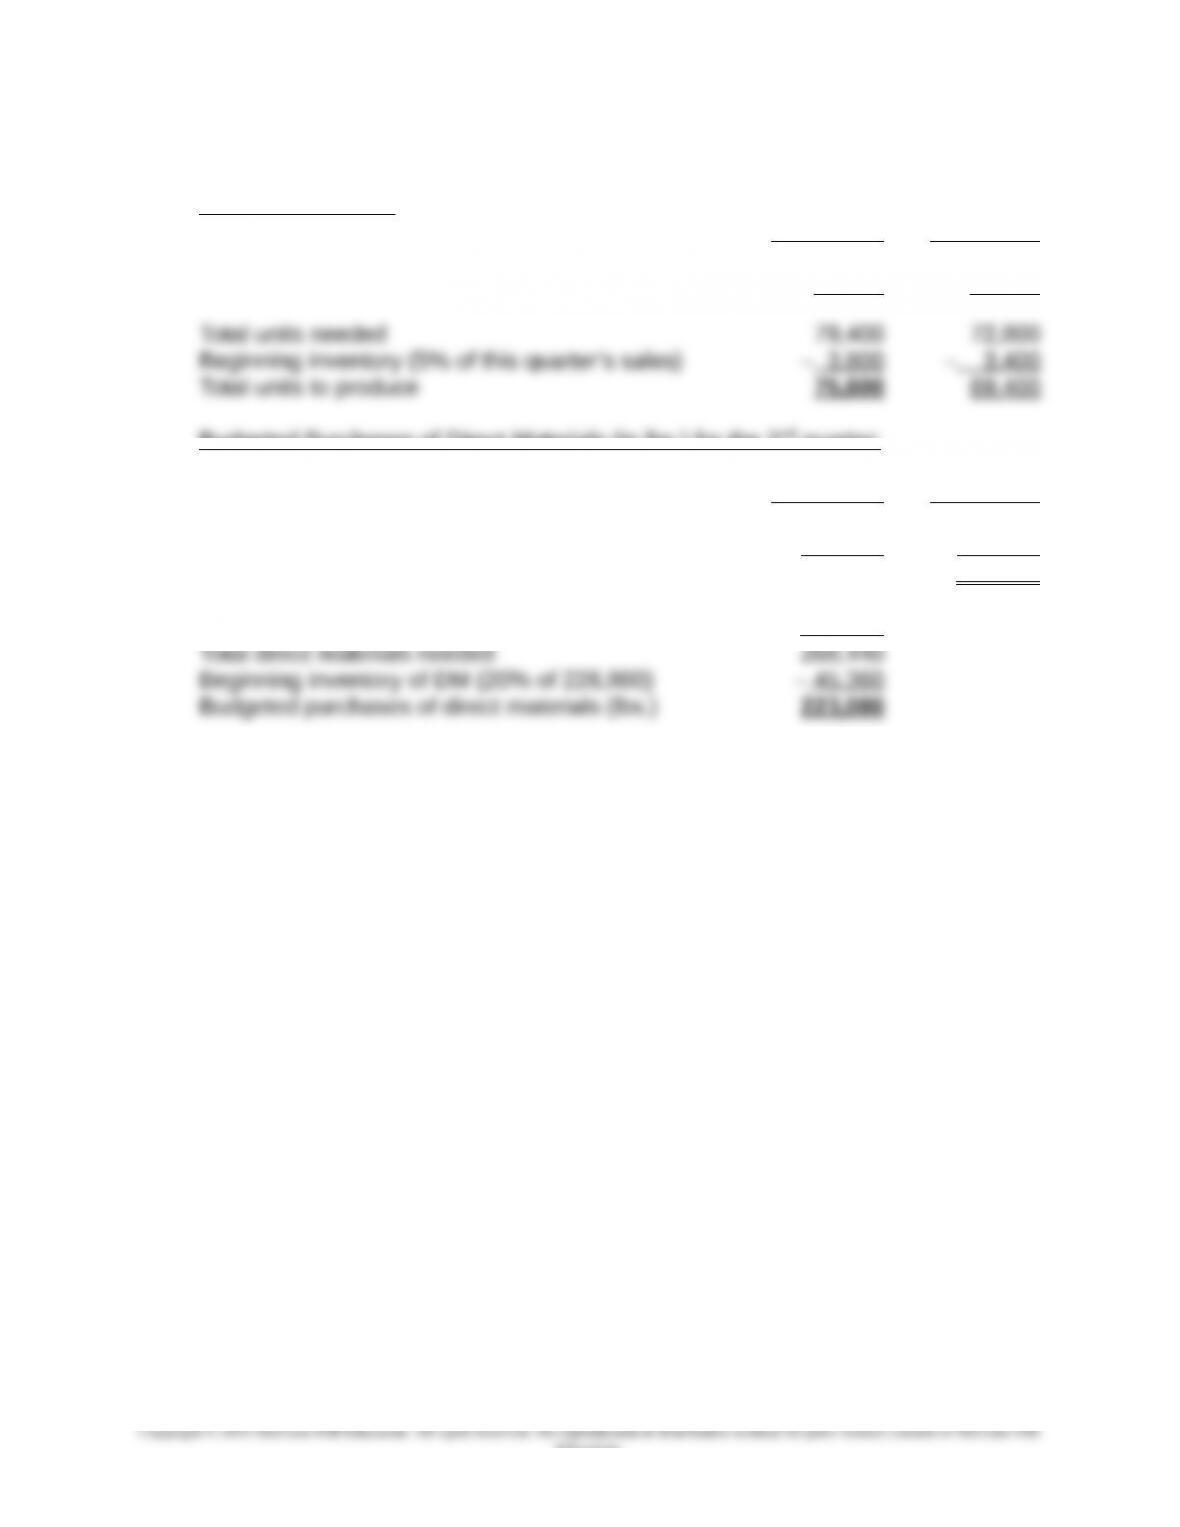
10-25 Production and Materials Purchases Budgets (20-25 minutes)
Production Budget:
2 nd
Quarter 3 rd
Quarter
Budgeted sales 76,000 68,000
Desired ending inventory (5% of next quarter’s sales) + 3,400 + 4,800
Budgeted Purchases of Direct Materials (in lbs.) for the 2 nd
quarter:
2 nd
Quarter 3 rd
Quarter
Budgeted production 75,600 69,400
Direct materials (lbs.) per unit produced × 3 × 3
Direct materials needed in production 226,800 208,200
Desired ending inventory of direct materials (lbs.)
(20% of 208,200 lbs.) + 41,640
10-10
Education.