
Chapter 10 – Strategy and the Master Budget
Students should identify activity-based costing and management (ABC/M) as an appropriate tool to
address many of these issues. They should recognize the need to use benchmarking data for comparison
once ABC is complete. Strategy mapping and creating benchmarks or a balanced scorecard may be
identified as useful. Finally, students should recognize that they must use their activity analysis plus their
knowledge of the line-item budget to suggest next year’s budget.
What activities does the advising department undertake, and how does COBAA spend its
resources on these activities?
Activity Analysis
To answer the questions regarding the activities performed and how resources are used, students should
transform COBAA’s base budget into an ABC format. Exhibit 1 summarizes the results of our activity
analysis. The details behind this are included in Exhibits 2 and 3. Exhibit 1 was derived by using Table 8
of the case and the procedures described below. Be aware that students can make reasonable assumptions
and follow procedures different from the ones outlined.
There are two types of resources that have to be allocated to activities. The first category includes direct
The second category of costs can’t be traced directly to activities, but they can be traced directly to the
people performing these activities. For example, each staff member working on advising needs a desk,
Using Table 8 from the case again, we created Exhibit 3 to show the consumption of resources by
activities.
Benchmarking COBAA’s operations against other advising offices
The activity-based budget gives a starting point for analysis. Exhibit 4 compares operations of COBAA to
the outside benchmark and to two “best in class” internal operations, AMC and Education.
Students should recognize and discuss the difficulties of using benchmark data.
To discuss benchmarking with students, it’s helpful to discuss different types of benchmarks that might be
used.
In general there are three kinds of benchmarks that could be used.
Specifically chosen benchmarks that represent known “best in class,” such as those provided by
the consultant
Data comparability is always an issue; nothing is perfect, and differences probably do
exist here.
10-21
Education.

Chapter 10 – Strategy and the Master Budget
– To use benchmarks, depending on the circumstances, you must consider differences
in the value proposition, size, product mix, production facilities age, and
customer demographics among other things.
No uniform activity dictionary exists across organizations. Benchmark universities, even
within the same system, may define things differently. Consider for instance, A2,
involving graduation checks. Is this activity the same for AMC and Education as it is for
COBAA? (This was deliberately left vague for students to discuss and identify as a
problem in using benchmarks. From the case, it appears that COBAA corrects rejected
graduation checks while AMC and Education are proactive and perform graduation
checks prior to the student requesting a formal one from the university.)
Resources assigned to activities may be different. (For instance, does every university
charge departments only for salary, as Bay State does, or do they also charge departments
for benefits?)
Assigning costs to activities may follow a different methodology or use different
assumptions. (Students may not create a fully-loaded salary to assign costs to activities.)
Cost of living adjustments may need to be made for cost factors. (Costs in a major
metropolitan center may differ from those in a rural environment.)
Generic benchmarks for some organization that is considered best in class at an activity or
function. These weren’t used in this case; this would involve analyzing an advising function in an
organization that isn’t part of a typical university. The examples we usually discuss in class are:
LL Bean for order fulfillment
VISA for invoice processing and payables
Theoretical benchmarks that exist given perfect standards.
Four-year degree in four years.
Graduating with 124 units earned.
Earning a perfect student satisfaction score.
The major problem that students should identify is that external data may not be comparable–even when
collected from other universities within the state system. Students don’t know if the student mix
(full-/part-time) is the same, if the costs for benchmark universities are similar to Bay State, what other
operations they may have in place to support students, and whether other advising offices define their
activities in the way that Bay State does. Further, studying the data in Table 1 of the case, it appears that
one of the benchmark universities has a much smaller FTE than Bay State. So students have to use this
data cautiously.
Students may spend time discussing whether or not the activity definitions are comparable. For instance,
it’s hard to believe that freshmen aren’t given any orientation to the enrollment process. The external
benchmark universities may include freshmen enrollment as a part of disseminating graduation
requirements or as a part of advising students. More than likely this activity is performed and classified
differently. Likewise the benchmark universities’ activity for monitoring academic progress probably
includes issuing readmission contracts–this procedure is fairly standard at all universities. Other detailed
activities may be merged into the broad activity descriptions in their data.
Regardless of the differences that students discuss, it’s hard to argue against the overwhelming facts. The
external data shows that COBAA performs more activities and at a greater cost per FTE than its
benchmarks. Benchmark universities in the system seem to focus on a few key activities: advising
students, disseminating graduation requirements, maintaining a website, and monitoring progress. Based
on their activities, they deliver advising services not only for less than COBAA does ($88 per FTE vs.
$141), but also with more student satisfaction, fewer units at graduation, and fewer years to graduation for
FTF.
10-22
Education.

Chapter 10 – Strategy and the Master Budget
Similarly, both AMC and Education perform fewer activities than COBAA. AMC, which is rated higher
in student satisfaction while its students take a few more units than Education’s students during their
undergraduate work, performs far fewer activities than COBAA. With the exception of “enrolling
freshmen,” their results line up closely with the external benchmark universities. If the external
benchmark includes the “enrolling freshmen” activity in “advising” (A9), then AMC looks very much like
the external benchmark. Comparing Education and AMC, it appears that AMC probably puts its “issuing
readmission contracts” activity into its “monitoring academic progress” activity. If that is the case, both of
these colleges are about the same except for reviewing waivers and substitutions and checking
prerequisites.
While no information is provided regarding why Education reviews waivers and substitutions prior to
approval by department chairs, it is known that Education has to check some prerequisites manually
because the computer registration system isn’t programmed to check for more than two prerequisites for
any class. Both reviewing waivers and substitutions and checking prerequisites are activities performed
by COBAA.
An important overall conclusion for students to reach is that regardless of differences in activities,
COBAA is spending a substantial portion of its resources on activities that no other advising operation in
the comparison group performs.
Why is COBAA’s performance poor relative to benchmarks?
We suggest you present a matrix classifying COBAA’s activities into cells based on whether the activity is
strategic for COBAA (i.e., aligns with the mission of COBAA, not the overall mission of the university)
and whether the activity is performed well.
Exhibit 5 contains the matrix (based on the forthcoming Management Accounting: A Strategic Focus, A
Modular Series by Shahid Ansari, Janice Bell, and Thomas Klammer, published by Houghton Mifflin
Company). Evaluating activities according to the matrix requires a great deal of judgment on behalf of
students. Not all students will agree how to classify items as strategic and nonstrategic. Students should
start with the mission of COBAA, which is:
To assist students with their degree requirements so they reach their educational goals in the most
efficient and timely manner possible.
There will probably be less debate about the level of performance of the activities; Table 9 in the case will
help students with this analysis.
Items that fit in Cell 1, performed well and strategic, should be continued without major redesign at this
time. Determining what to do about items in Cell 2, performed well but nonstrategic, requires creativity.
When an item is in Cell 2, students need to determine if the activity should be or is located elsewhere in
the university (it may be redundant of other university activities) or if an advising niche could be created.
Activities classified as Cell 3, strategic but not performed well, need to be observed at the benchmark
colleges so differences can be identified and so the activity can be redesigned to improve performance.
Cell 4 activities, performed poorly and nonstrategic, should be discontinued.
As a part of this analysis, students also may identify activities that are missing. Their study of benchmark
data or their own personal experiences may reveal activities that successful universities perform that
COBAA doesn’t. In that case, students may recommend that a new activity be added (such as providing
instructions on how to use the online enrollment system to all transfers as well as first-time freshmen).
Exhibit 6 provides a suggested analysis of the activities.
10-23
Education.

Chapter 10 – Strategy and the Master Budget
How can COBAA improve the college’s performance on units at graduation, FTF time to
graduation, and student satisfaction with advising?
Strategy Mapping
Students familiar with balanced scorecard and strategy maps may create a strategy map for advisement
and create balanced scorecard metrics. One suggested map is presented in Exhibit 7. Circles represent
activities; those marked with yellow (or shaded) belong to advising; others may or may not.
By disseminating detailed information about graduation requirements for each major or option to
students, training students to use the online enrollment process, providing advice as needed, and checking
to determine that proper prerequisites for classes are met, advisors assure that students enroll in classes
that fulfill their degree requirements and that they are academically prepared to take. This, in turn, should
lead to improved GPAs (reducing the need for special services and contracting) and steady progress
toward degree requirements.
By monitoring academic progress, advisors can identify students with problems (such as with their GPA)
and target them for special services. Finally, by performing accurate graduation checks to assure all
course requirements are documented prior to graduation, students’ transcripts will reflect their graduation
status promptly so they can pursue their career or future educational goals. The combination of these
activities should lead to greater student retention because students are succeeding; fewer classes taken
that don’t count toward graduation and, thus, fewer overall units at graduation; and graduations occurring
in fewer semesters.
Note that the strategy map doesn’t include some of COBAA’s activities. It isn’t that activities such as
recruiting or tutoring shouldn’t be performed somewhere in the university, it’s that they aren’t strategies
that cause fewer units at graduation, faster graduation, or increased student satisfaction with their advising
experiences.
Exhibit 8 is an example of what the students might come up with based on their analysis of activities in
Exhibit 6 and their ideas from strategy mapping in Exhibit 7.
Analyzing both benchmarking data and COBAA’s activities for strategic fit, it seems that COBAA should
immediately divest activities 6, 11, 12, and 13. A6 is a redundant activity being performed by department
chairs. It wastes resources if two different groups of people perform the same activity. A2, graduation
checks, should be kept until the university improves the graduation check process performed in the
registrar’s office. Improving the registrar’s process is beyond the control of COBAA, so COBAA must
continue to perform the activity for now. Since COBAA performs A2 poorly, the activity needs
improving. COBAA needs details of what tasks AMC and Education perform when they prepare
graduation checks. Perhaps COBAA can modify its procedures to improve its performance on graduation
checks. Activities A12 and 13, which COBAA performs well, don’t belong in the advising function and
should be properly located in other university offices. (As an aside, when this activity analysis occurred in
practice, the manager of advising left the advising office and joined another campus department
responsible for outreach to underrepresented populations and the success of underprepared student
populations.)
Should the COBAA’s new initiatives be funded?
Before leaving the topic of analyzing activities, ask students to analyze whether or not the initiatives
proposed by COBAA are strategic and should be considered. They are:
10-24
Education.

Chapter 10 – Strategy and the Master Budget
1. The hiring of an ombudsman to take students’ complaints and assist students in resolving their
issues. The primary focus would be on lost paperwork, failure to meet deadlines for adding and
dropping classes, ability to maintain financial aid with unit reductions, help in arranging
makeup work for missed classes, and finding space in open classes. The recurring cost of this
activity would be approximately $67,000, which includes salary, benefits, and office expenses
for another employee.
2. The development of glossy brochures for each option and major to be distributed to high school
and community college students to assist outreach activities. These brochures should cost
approximately $75,000 in the upcoming year to develop and print; afterwards the annual cost
should be between $25,000 and $30,000 to replenish stock.
3. Expansion of A1 activities by 25% to include group sessions on the substitution and waiver
process. This should benefit all students who are cross-enrolled in another university, attending
a study abroad program, or have transferred. This cost could be partially offset by eliminating
the review of special substitution and waiver activities, work that seems to be duplicated by
department chairs.
4. Coordinate with the Internship office to have firms offering internships attend the career fair
with information about internship positions. This would create additional event costs of
approximately $15,000. Students would benefit from the additional service.
Item 1, the ombudsman, seems to combine regular advising and quality control with activities expected to
be handled by students directly. We don’t recommend that students add this activity; redesign of work
activities should reduce things like lost paperwork and should free up additional time for advisors to work
with students individually with their problems.
Item 2, development of glossy brochures, is to assist outreach. Outreach isn’t a strategic objective of
advising, so students shouldn’t invest in this activity either.
Item 3, expansion of A1 activities, is strategic. It’s unclear if a 25% increase is necessary, but it is
important to improve group advising sessions. It appears that COBAA is spending a normal amount on
A1 compared to the benchmarks. COBAA should study the details of how AMC performs A1, as AMC
appears to be performing it with better performance metrics.
Item 4, coordinate with internship office, is not strategic for the advising center. Because the career fair
activities are being transferred out of advising to the career center, no plans to expand those items are
relevant.
Budgeting for COBAA
Students can take many different approaches to creating a budget for COBAA. The president has
requested a 15% cost reduction. Many students may take that 15% off the current cost and create a budget
that yields a cost per FTE of about $120 ($141 *.85). Others may shoot for a larger budget cut and
attempt to reduce COBAA’s spending to the amount spent by Education, approximately $89 per FTE.
This should create an interesting opportunity to discuss the political nature of the budget, the role of the
accountant (nested in the college or as a representative of upper administration), and the idea of
developing budgetary slack.
Regardless of which amount students choose to budget for in total, creating the budget should involve
more than just suggesting a cost per FTE. Students also need to realize that they can’t create a final
budget by simply adding together the cost of each activity that COBAA retains. This ignores the cost
factors involved and what action the manager will have to take to manage each.
10-25
Education.

Chapter 10 – Strategy and the Master Budget
Since salaries comprise the largest cost that advising incurs ($500,000 of the $874,500), students should
consider the headcount used by COBAA. Table 3 in the case shows that AMC has 850 FTEs per
headcount in advising while Education has 813. COB expects 6,200 FTEs, and using the Education’s
number or 813, COBAA should have a headcount of ~7.63. Using AMC’s FTE per headcount of 850,
COBAA should have ~ 7.3 employees.
Currently COBAA has a headcount of 10 people. This means that the function is overstaffed, which
seems illogical given the complaints and poor satisfaction scores. But existing resources are being
consumed by activities that aren’t relevant to the advising mission. Studying the details of the activities to
be eliminated, it appears that 85% of the manager’s time and 10% of advisors’ time should go away.
Students may suggest immediately laying off one advisor. Instead of laying off one advisor (students may
discuss the nature of these costs, fixed vs. variable), students can achieve the 15% budget reduction
requested by the president without an advisor layoff. Students may suggest that these employees be
redeployed to the activities that need improving. Then, if an advisor quits, the activity would “right size”
at that time if a replacement isn’t hired.
Since tutoring is being eliminated, 30% of staff time should go away. Another 10% goes away if activity
A6 is eliminated. Three equivalent staff positions exist, and some of these positions are from part-time
workers. Students should recognize that the Bay State students working in the office receive hourly wages
and could be given different work schedules without separating a permanent state employee. Further,
COBAA currently spends $33,000 on part-time student assistants, which is equivalent to 4,125 hours of
work. Cutting the part-time hours back by at least one-half cuts the equivalent of one headcount. The
remaining hours should be sufficient to provide office coverage during lunch and break times for the full-
time office staff while allowing for heavier coverage during peak work times. The manager of the
operation will have to schedule more carefully to make sure that bottlenecks don’t occur in the office.
Along with the reduction of one person from advising, all the costs driven by headcount will go down.
The other major cost reductions involve the discretionary spending for travel and hospitality. Since these
activities don’t really belong in advising, these budget items are cut. Exhibit 9 provides a budget that
achieves a 19% budget cut and should achieve better performance.
Students will probably make varying recommendations for the budget. Regardless of the budget they
develop, budget recommendations should be based on the students’ activity analysis and data. Hopefully,
they will support the existing level of effort on A3, A4, and A5, and recommend that additional resources
be deployed on activities that they identify as strategic in their strategy map. Further, students may
suggest other activities or improvements to existing ones. Most will identify improvements to the website
so that students can take care of many of their issues online. This will satisfy more students and reduce
reproduction costs, and it reflects the fact that most students are very active in an online environment.
Exhibit 9 contains an example of a proposed budget for 2008.
Balanced Scorecard
To make sure that all the employees in advising understand the strategy of COBAA, students may
recommend creating a balanced scorecard. Some students may also recommend it for control purposes.
Both are good reasons to create a scorecard. For logical consistency, if students create a scorecard, the
metrics they suggest should tie only to the activities that remain. It’s important that students think through
the strategic link between actions and results and suggest metrics that lead to proper behaviors. This may
be a good setting in which to explain strategy mapping, its link to ABM, and how the balanced scorecard
reveals what managers think must happen for success.

Chapter 10 – Strategy and the Master Budget
Exhibit 10 provides one suggestion for a scorecard for COBAA.
At the end of this case, when it is taught in the classroom, we encourage the instructor to ask students to
reflect on what is meant by adopting a customer’s perspective when strategically managing operations
and costs. Remind students how they reacted to different suggestions for eliminating activities, how
concerned and dismayed they were with descriptions of lost paperwork, postponed graduation postings,
and their frustration that advisors weren’t meeting with students to provide advising. Drive home that
taking the customer’s perspective in strategic cost management means that the accountant must
understand what customers want and how they interact with or experience organizational processes. Also
reinforce that strategic cost management isn’t about correctly computing the cost of activities performed
and then using that information to project what costs an operation should incur, but instead involves
looking at the situation from several analytical perspectives, considering the environment surrounding the
budgeting process, and then using sound judgment to make recommendations.
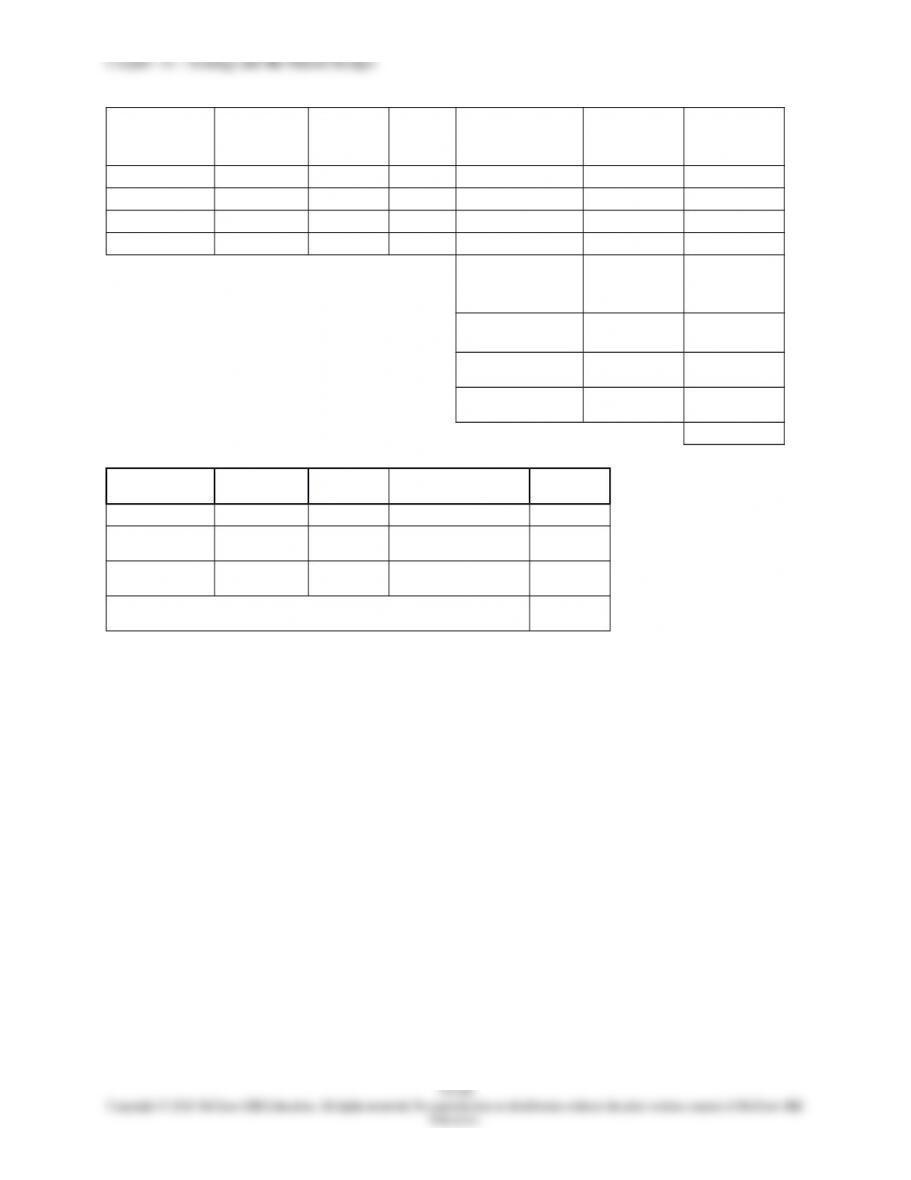
Exhibit 1
ABC Base Budget for COBAA(1)
$ per FTE
Activity Percent 6,200
A1
Disseminate graduation
requirements $ 135,653 16% $ 21.88
A2 Correct graduation checks
72,07
1 8% 11.62
A3 Monitor academic progress
40,93
6 5% 6.60
A4 Issue readmission contracts
32,74
8 4% 5.28
A5 Enroll freshmen
64,88
6 7% 10.47
A6
Review substitution and
waivers
51,60
3 6% 8.32
A7 Develop advising materials – 0 –
A8 Update website
21,43
0 2% 3.46
A9 Advise students
109,76
0 13% 17.70
A10 Check prerequisites
90,87
7 10% 14.66
A11 Recruit students
120,85
8 14% 19.49
A12 Tutor students
95,84
3 11% 15.46
A13 Arrange career fairs
37,83
4 4% 6.10
$874,500 100%
$141.0
5
(1) Details behind this costing are in Exhibits 2 and 3.
Exhibit 2
Computation of Fully-Loaded Salaries
Costs included in “Fully-Loaded Salaries”
10-27
Education.
Worker Headcount Salaries
Phone
(1)
Office supplies
(2)
Equipment
& Software
(3)
Fully-
Loaded
Salaries
Manager 1 $85,000 600 6,370 4,256 $ 96,226
Advisors 6 342,000 3,600 38,220 25,536 409,356
Office Staff 3 73,000 1,800 19,110 12,768 106,678
Total 10 $500,000 $6,000 $63,700 $42,560 $612,260
Equipment &
Software
15 stations
tutoring 63,840
Reproduction Usage 135,000
Travel
Direct Cost
A11 40,000
Hospitality
Direct Cost
A13 23,400
$874,500
Support Costs
Resource
Driver Tutoring Total
Per
Headcount
Phone (1) headcount 0 $ 6,000 $600
Office
Supplies (2) headcount 0 63,700 $6,370
Equipment &
Software (3) stations
15
stations 106,400
4,256
Support Cost per employee
$11
,226
(3) 15 stations go to Tutoring; remainder on Headcount
Chapter 10 – Strategy and the Master Budget
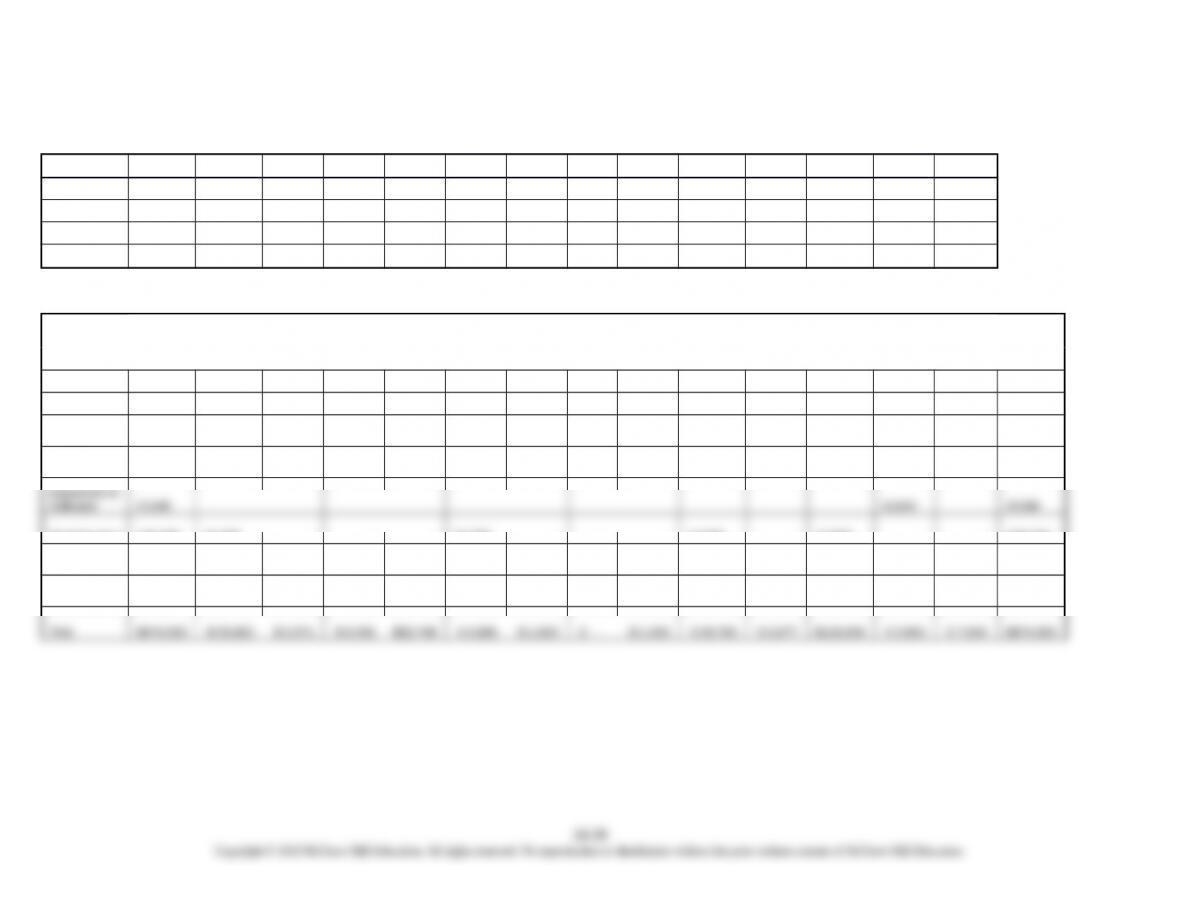
Exhibit 3
Use of Resource Drivers (time or usage) by Activities
A1 A2 A3 A4 A5 A6 A7 A8 A9 A10 A11 A12 A13 Total
Manager 1.00% 14.00% 70.00% 15.00% 100.00%
Advisors 15.00% 15.00% 10.00% 8.00% 5.00% 10.00% 5.00% 17.00% 15.00% 100.00%
Office Staff 10.00% 10.00% 10.00% 25.00% 15.00% 30.00% 100.00%
Reproduction 55.00% 25.00% 10.00% 10.00% 100.00%
Activity
Costing
Cost Item
Item Amount A1 A2 A3 A4 A5 A6 A7 A8 A9 A10 A11 A12 A13 Total
Manager $ 96,226 $ – $ – $ – $ – $ – $ – $ – $ 962 $ – $ 3,472 $ 67,358 $ – $ 4,434 $ 96,226
Advisors
409,356
61,403
61,403
40,936
32,748
20,468
40,936 –
20,468
69,591
61,403 – – –
409,356
Office Staff
106,678 –
10,668 – –
10,668
10,668 – –
26,670
16,002 –
32,003 –
106,678
Reproduction
135,000
74,250 – – –
33,750 – – –
13,500 –
13,500 – –
135,000
Travel
40,000
40,000
40,000
Hospitality
23,400
23,400
23,400
Chapter 10 – Strategy and the Master Budget
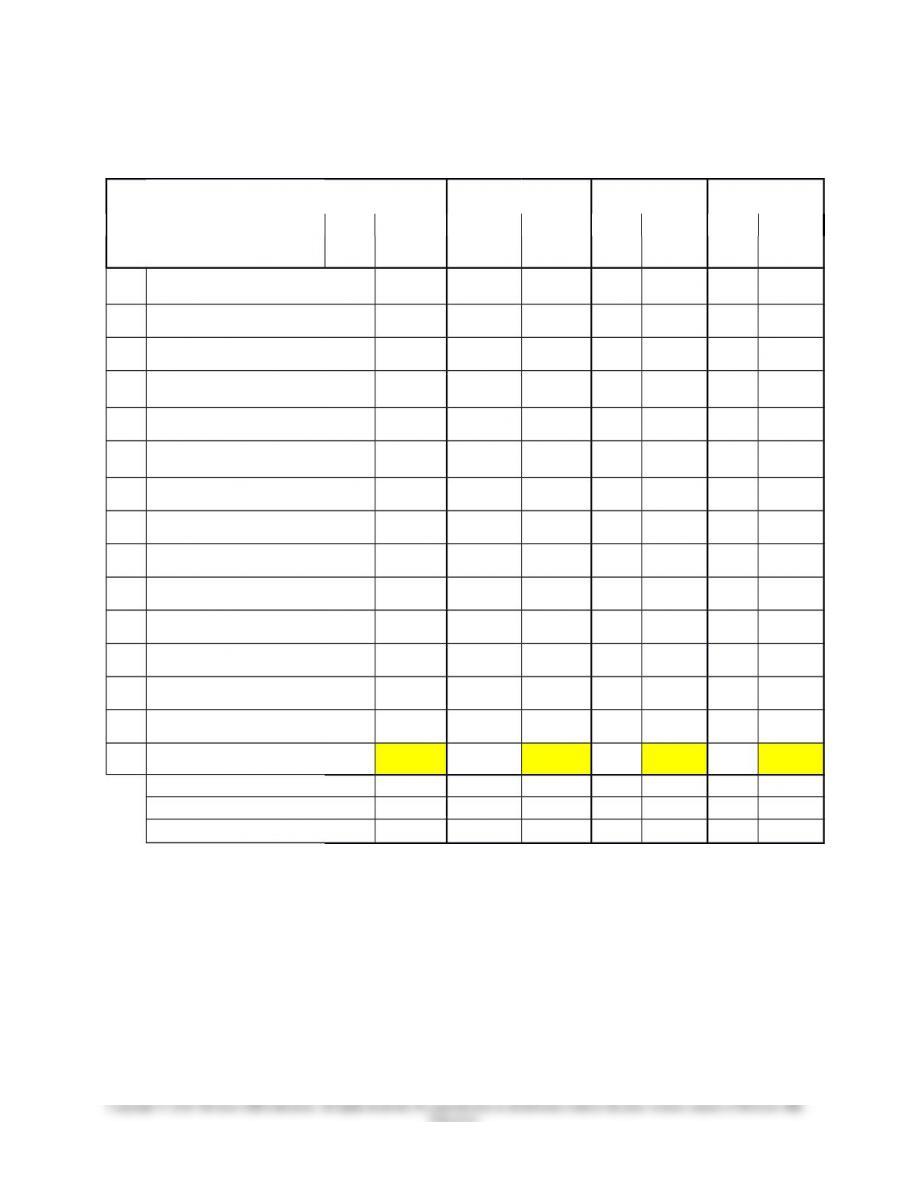
Exhibit 4
Benchmark
COBAA
E
xternal AMC EDUCATION
Activity Cost Comparisons $/FTE $/FTE $/FTE $/FTE
Activity % 6200 %
unknow
n % 3400 % 4875
A1
Disseminate graduation
requirements 16%
$
21.88 28% $ 25.00 25%
$
20.00 20%
$
17.80
A2 Correct graduation checks 8%
11.62 8%
6.40 7%
6.23
A3 Monitor academic progress 5%
6.60 12%
10.50 5%
4.00 2%
1.78
A4
Issue readmission
contracts 4%
5.28 3%
2.23
A5 Enroll freshmen 7%
10.47 12%
9.60 7%
6.23
A6
Review substitution and
waivers 6%
8.32 7%
6.23
A7 Develop advising materials 0
– 1%
1.25 5%
4.45
A8 Update website 2%
3.46 7%
6.00 18%
14.40 15%
13.35
A9 Advise students 13%
17.70 48%
42.00 32%
25.60 29%
25.37
A10 Check prerequisites 10%
14.66 6%
5.34
A11 Recruit students 14%
19.49
A12 Tutor students 11%
15.46
A13 Arrange career fairs 4%
6.10
Miscellaneous other 4%
3.25
Per FTE
100
% $141.05 100% $88.00 100% $80.00 100% $89.00
Student satisfaction Low High High High
Units at graduation 147 130 136 132
FTF years to graduation 6.8 4.4 5 5
10-30
Education.