Chapter 09 – Audit Sampling: An Application to Substantive Tests of Account Balances
9-13
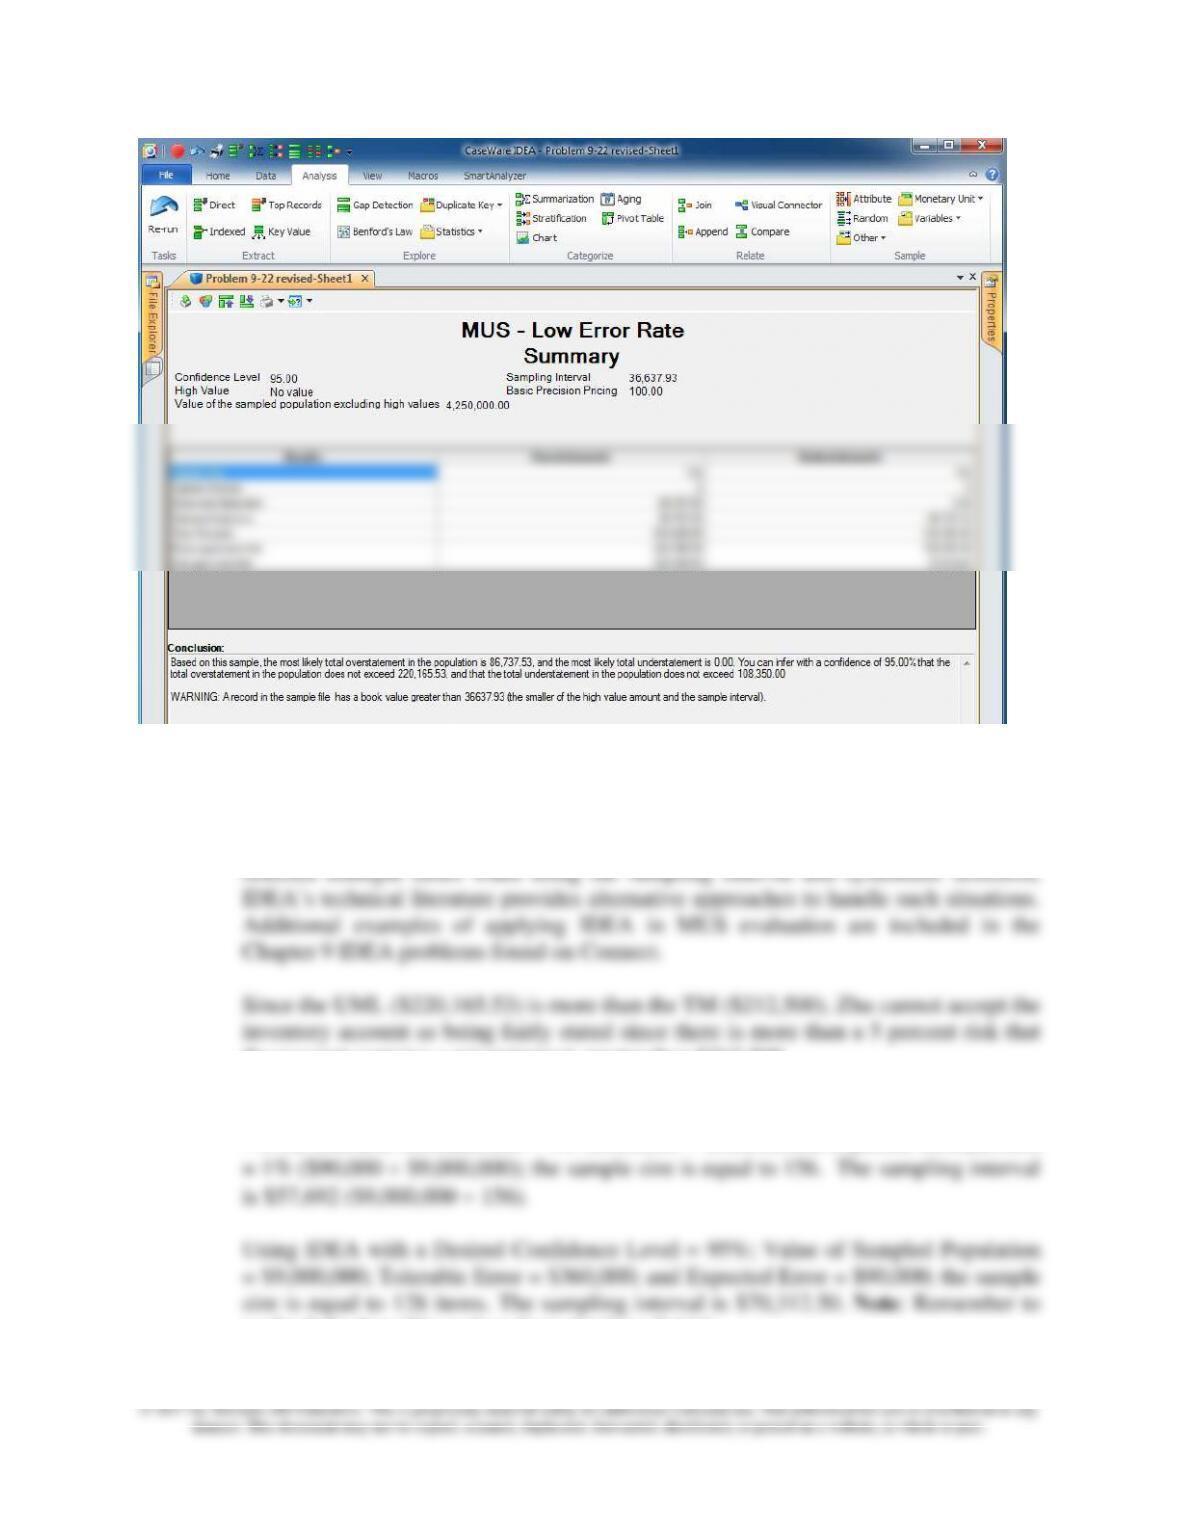
To compute the upper error limit in IDEA, follow the steps outlined in the Chapter 9
IDEA problems and solutions available on the book’s online learning center,
McGraw-Hill Connect. The warning at the bottom of the screen refers to the way
“High Value” items are handled in the evaluation. For very large items that can be
the account contains a misstatement greater than $212,500.
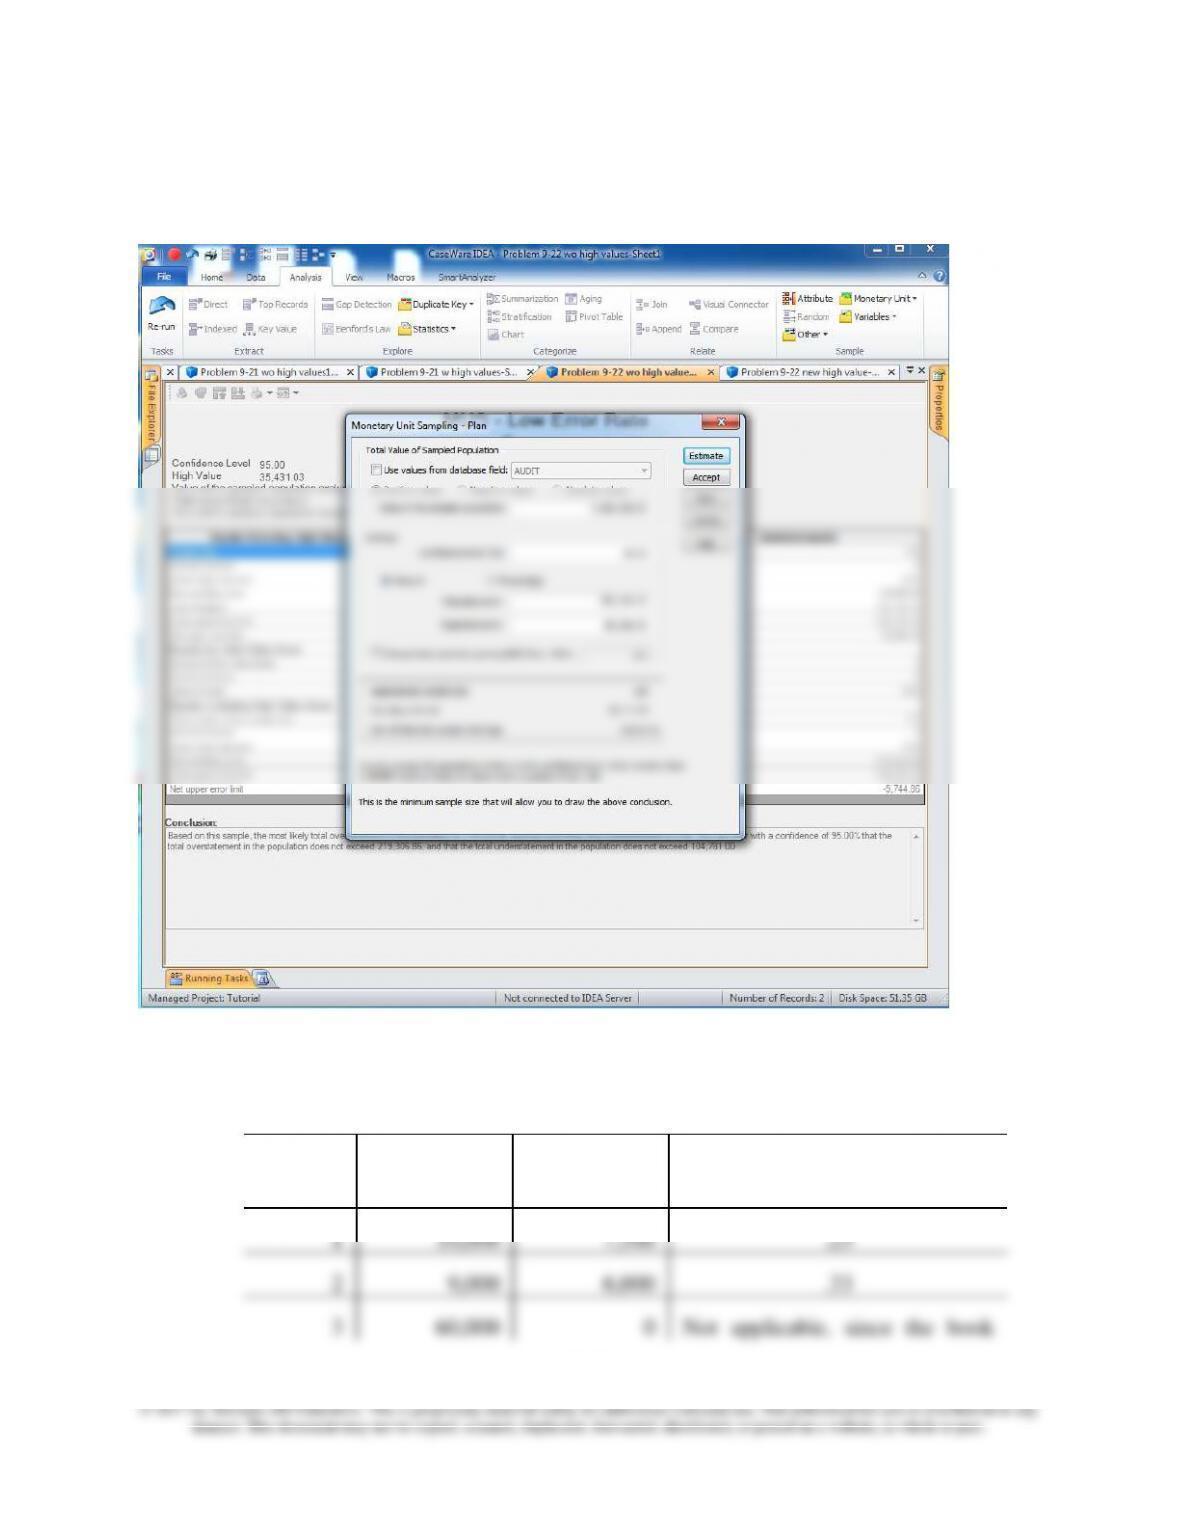
9-23 a. Using Table 8-5 with a desired confidence level of 95% (risk of incorrect acceptance
= 5%); tolerable misstatement = 4% ($360,000 $9,000,000); expected misstatement
uncheck the box “Use values from database field.”
Chapter 09 – Audit Sampling: An Application to Substantive Tests of Account Balances
9-14
The output from IDEA is provided below:
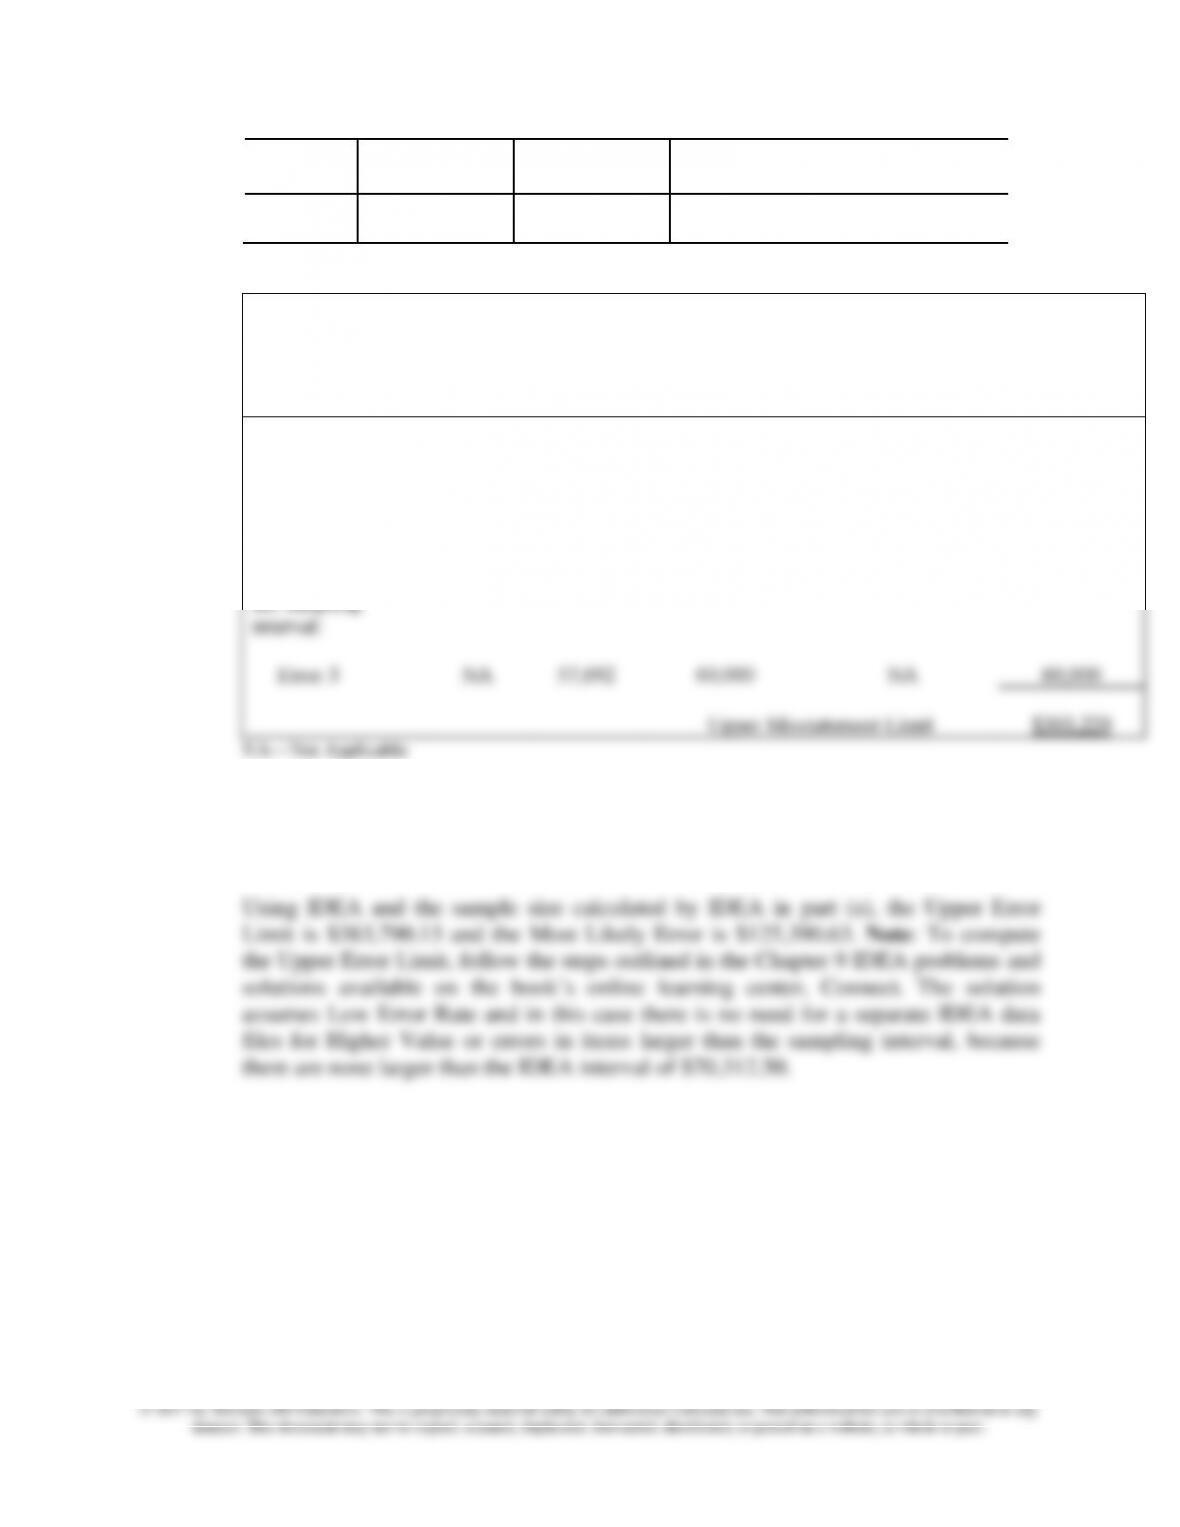
b. The upper misstatement limit is calculated as follows:
Overstatement Errors
Error
Number
Book Value
Audit Value
Tainting Factor
1
10,000
7,500
.25
2
9,000
6,000
.33
3
60,000
0
Not applicable, since the book
Chapter 09 – Audit Sampling: An Application to Substantive Tests of Account Balances
9-15
value exceeds the sampling
interval.
4
800
640
.20
Error Number
Tainting
Factor
Sampling
Interval
Projected
Misstatement
(column 2 x 3)
95%
Misstatement
Factor or
Increment (from
Table 9-3)
Upper
Misstatement
Limit
(column 2 x 3
x 5)
Basic Precision
1.0
$57,692
NA
3.0
$173,076
2
.33
57,692
19,038
1.7 (4.7 – 3.0)
32,365
1
.25
57,692
14,423
1.5 (6.2 – 4.7)
21,635
4
.20
57,692
11,538
1.4 (7.6 – 6.2)
16,153
Add misstatements
detected in logical
units greater than
the sampling
interval:
Error 3
NA
57,692
60,000
NA
60,000
Upper Misstatement Limit
$303,229
NA—Not Applicable
Since the UML ($303,229) is less than the tolerable misstatement ($360,000), Nancy
Van Pelt can accept the inventory account as being fairly stated since there is only a 5
percent risk that the account contains a misstatement greater than $360,000.
Chapter 09 – Audit Sampling: An Application to Substantive Tests of Account Balances
9-16
(IDEA refers to it as Total Precision). Mechanically, this problem also shows the
influence of the size of the sampling interval. Because the $60,000 item is smaller
than the sampling interval in the IDEA calculation, that error results in an error
projection (most likely error) and contributes to the upper error limit or allowance for
sampling risk more than just the known error in that sample item. On the other hand,
when using the tables, the sample size is larger and the sampling interval is $57,692.
As such, all items greater than the interval will be tested and therefore the known
error associated with the $60,000 item is added to the UML, but it requires no
additional margin for sampling risk when using the tables.
Chapter 09 – Audit Sampling: An Application to Substantive Tests of Account Balances
9-17
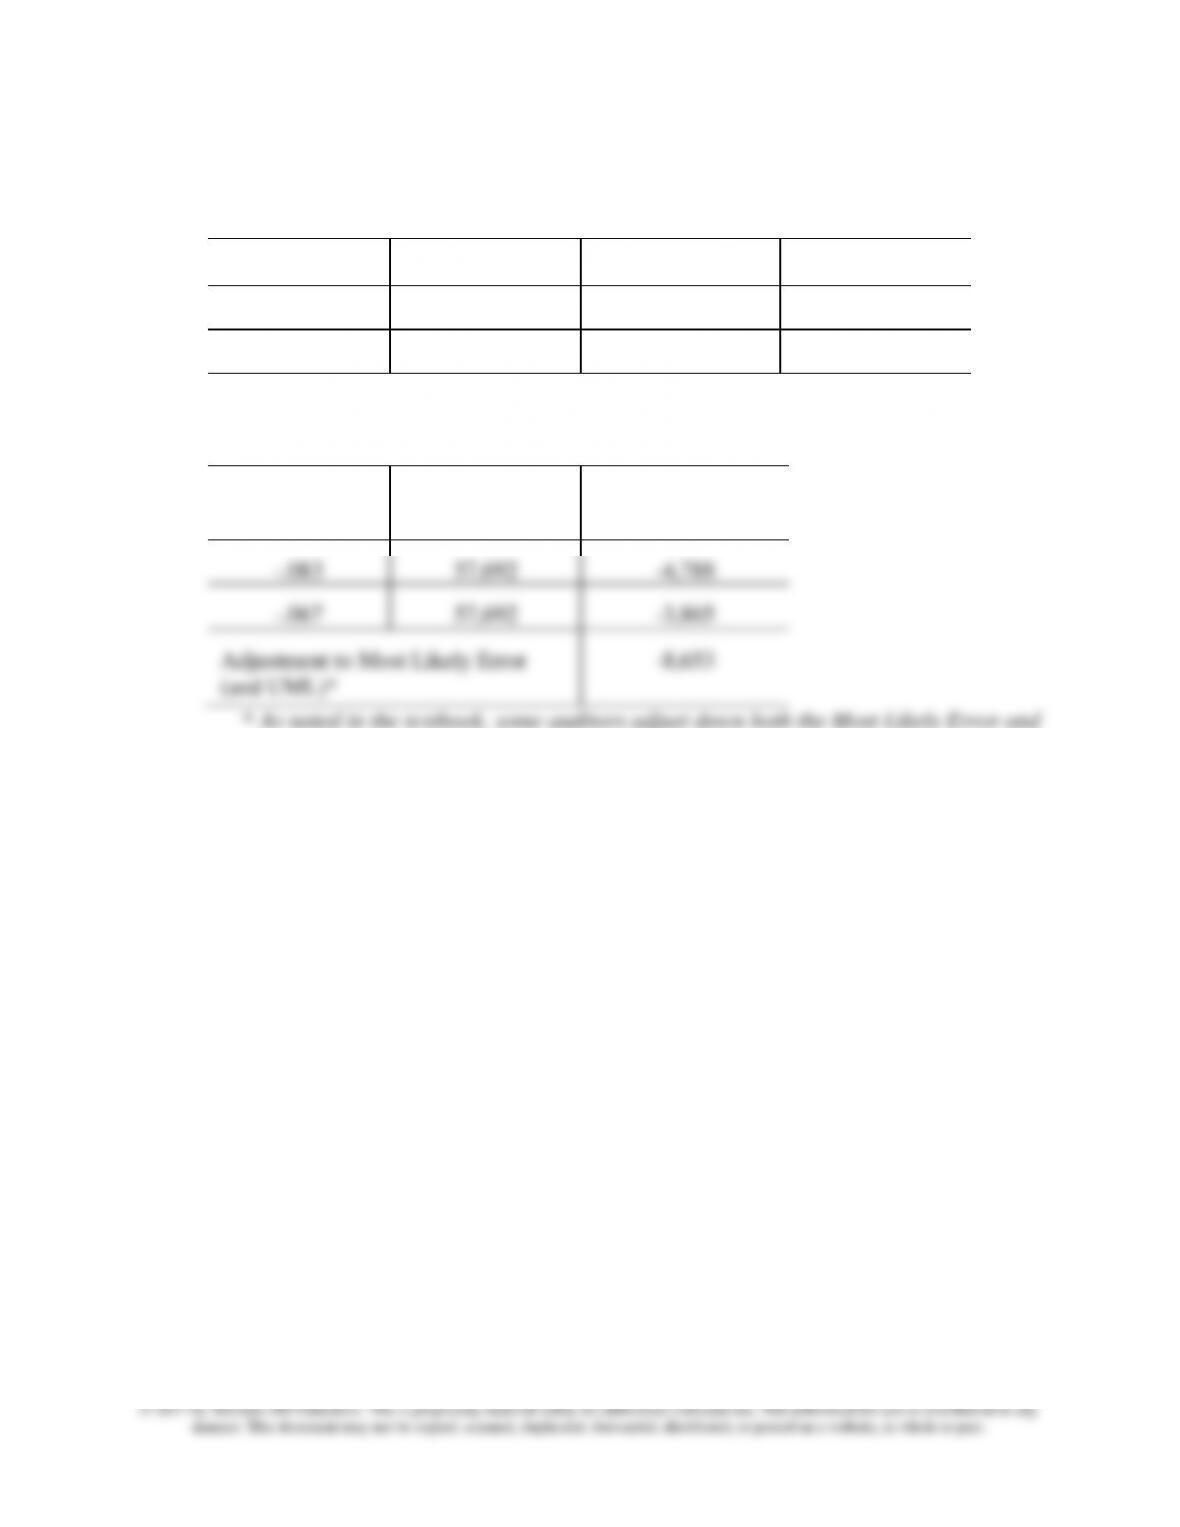
c. The calculation of the adjustment for the understatement errors is as follows:
Understatement Errors
Error Number
Book Value
Audit Value
Tainting Factor
5
6,000
6,500
-.083
6
750
800
-.067
Adjustment for Understatement Errors
Tainting
Factor
Sampling
Interval
Projected
Misstatement
-.083
57,692
-4,788
-.067
57,692
-3,865
Adjustment to Most Likely Error
(and UML)*
-8,653
* As noted in the textbook, some auditors adjust down both the Most Likely Error and
the UML. Note that IDEA reports both the unadjusted Gross Most Likely Error and
the adjusted Net Most Likely Error. Similarly, IDEA reports both the Gross Upper
Error Limit and the Net Upper Error Limit.
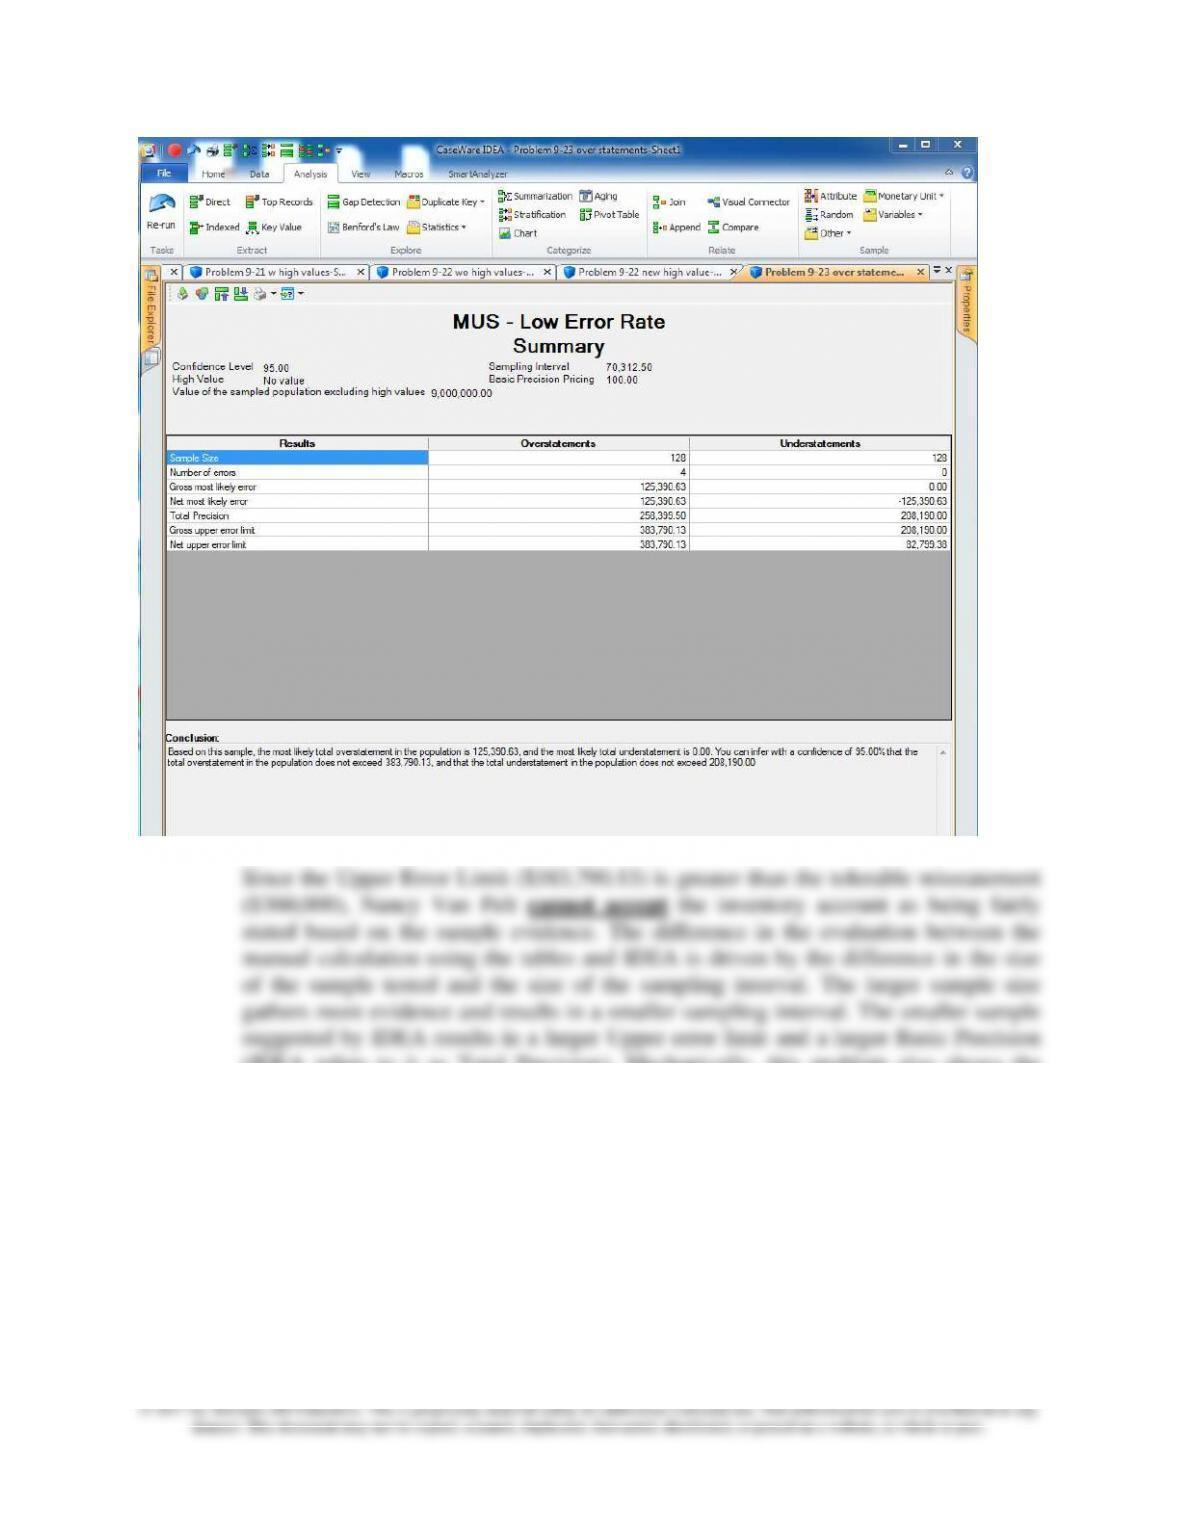
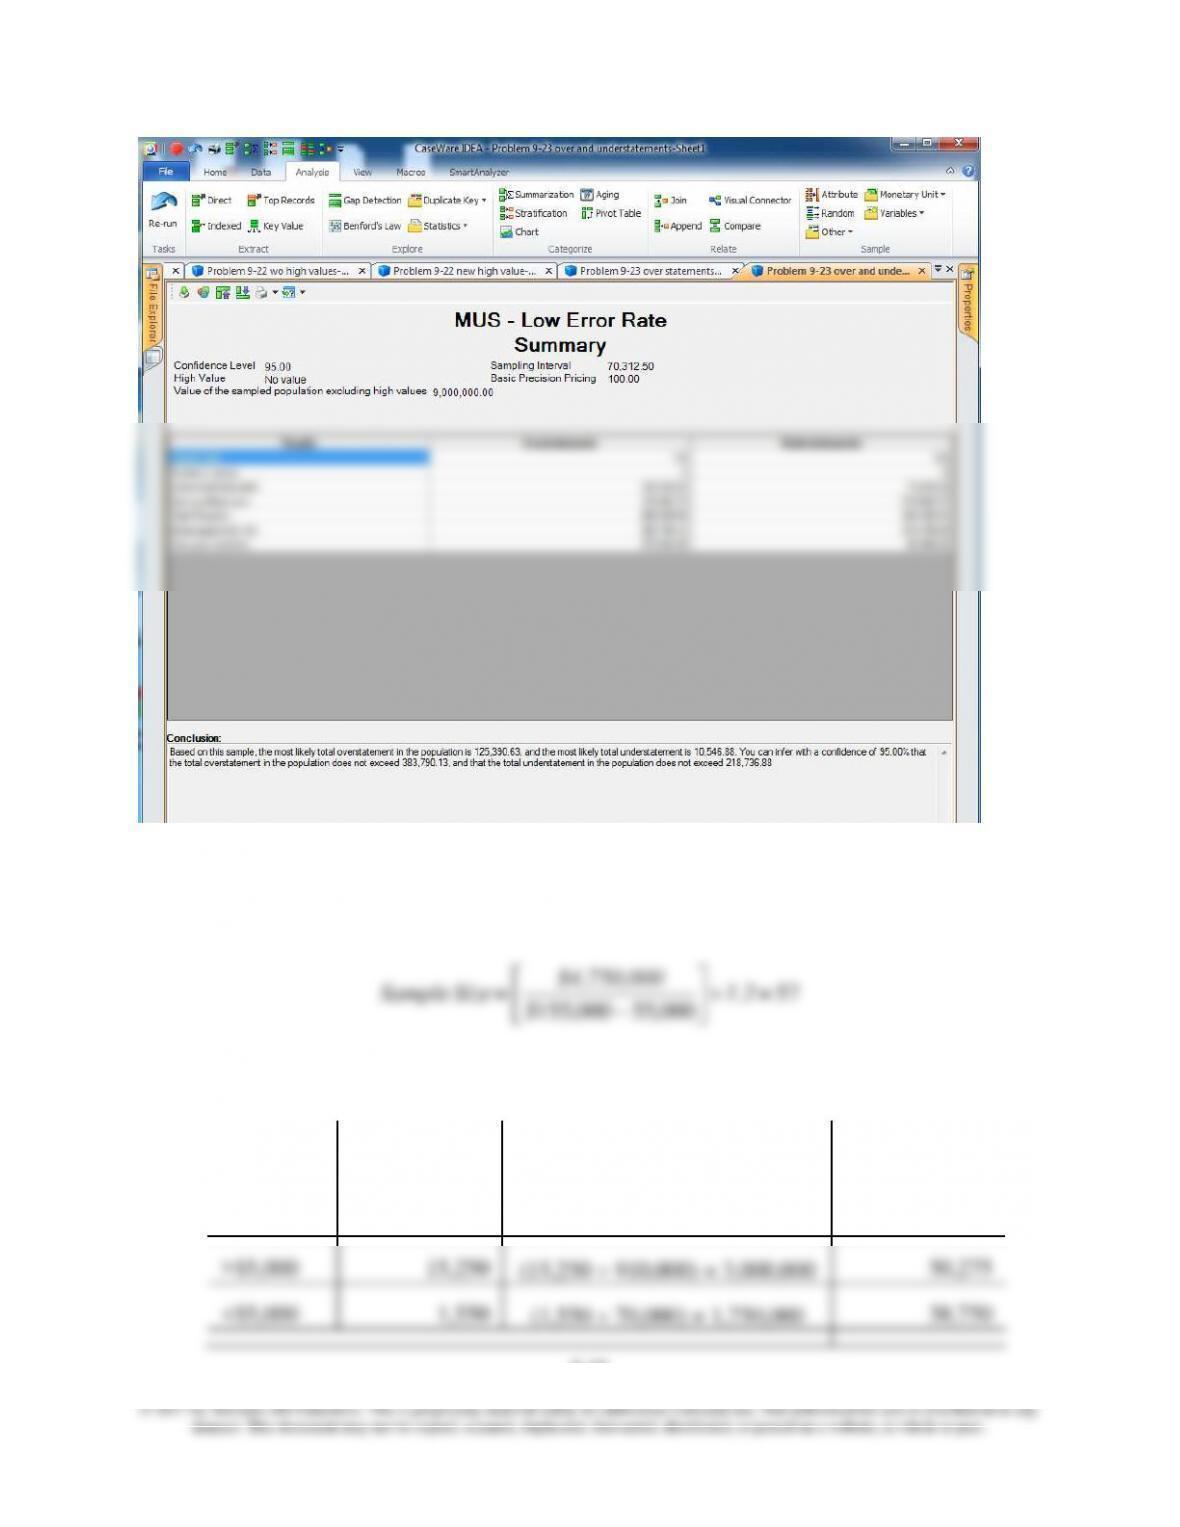
Using IDEA and the results from parts (a) and (b), the Gross Most Likely Error is
$125,390.63 and the Net Most Likely Error is $114,843.75. The Gross Upper Error
Limit is $383,790.13 and the Net Upper Error Limit is $373,243.25. Adjustment to
the most likely error is –$10,546.88 ($125,390.63 – $114,843.75) and the same
adjustment is made to the upper error limit.
The output from IDEA is provided below:
Chapter 09 – Audit Sampling: An Application to Substantive Tests of Account Balances
9-18
9-24 a. Remove the 10 accounts greater than $50,000 (total value $750,000) from the
sampling population because they will be the subject of 100% testing. Sample size is
calculated as follows:
b. The projected misstatement for the accounts receivable account is:
Strata
Amount of
Misstatement
Ratio of Misstatements in
Stratum Tested
Projected
Misstatement
>$50,000
$ 3,500
NA 100% of Strata Tested
$ 3,500
>$5,000
15,250
(15,250 910,000) × 3,000,000
50,275
<$5,000
1,550
(1,550 70,000) × 1,750,000
38,750
57
000,55000,155 = 1.2
$
$4,750,000
= SizeSample
−
Chapter 09 – Audit Sampling: An Application to Substantive Tests of Account Balances
9-19
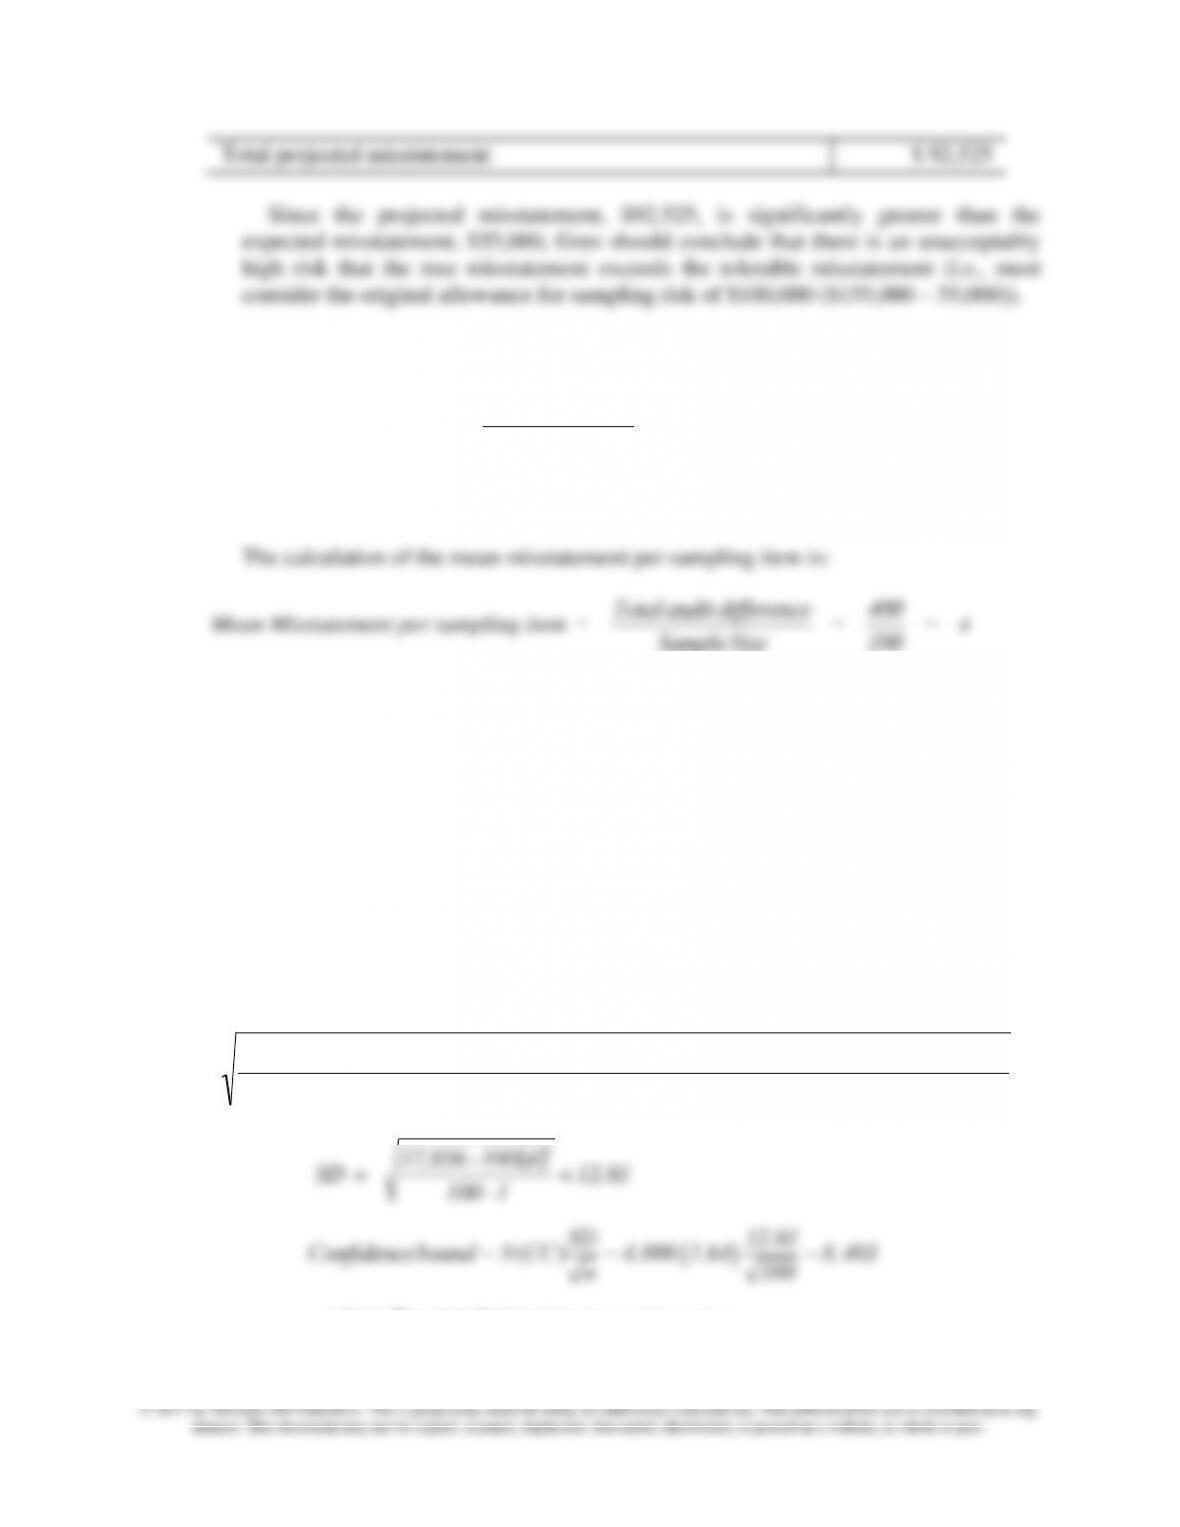
Total projected misstatement
$ 92,525
Since the projected misstatement, $92,525, is significantly greater than the
expected misstatement, $55,000, Gren should conclude that there is an unacceptably
high risk that the true misstatement exceeds the tolerable misstatement (i.e., must
consider the original allowance for sampling risk of $100,000 ($155,000 – 55,000)).
9-25 a. The calculation of the sample size for Wang’s test of Cougar Goldust is:
Sample size
43
000,10000,35
64.1000,4 =
–
25 xx
=
2
.03, round to 44
b. The calculation of the sample results is as follows:
Sample Size = 400
100 = 4
Thus, the average misstatement in a bin based on the sample data is an overstatement
of 4 ounces. Next, the mean misstatement is projected to the population:
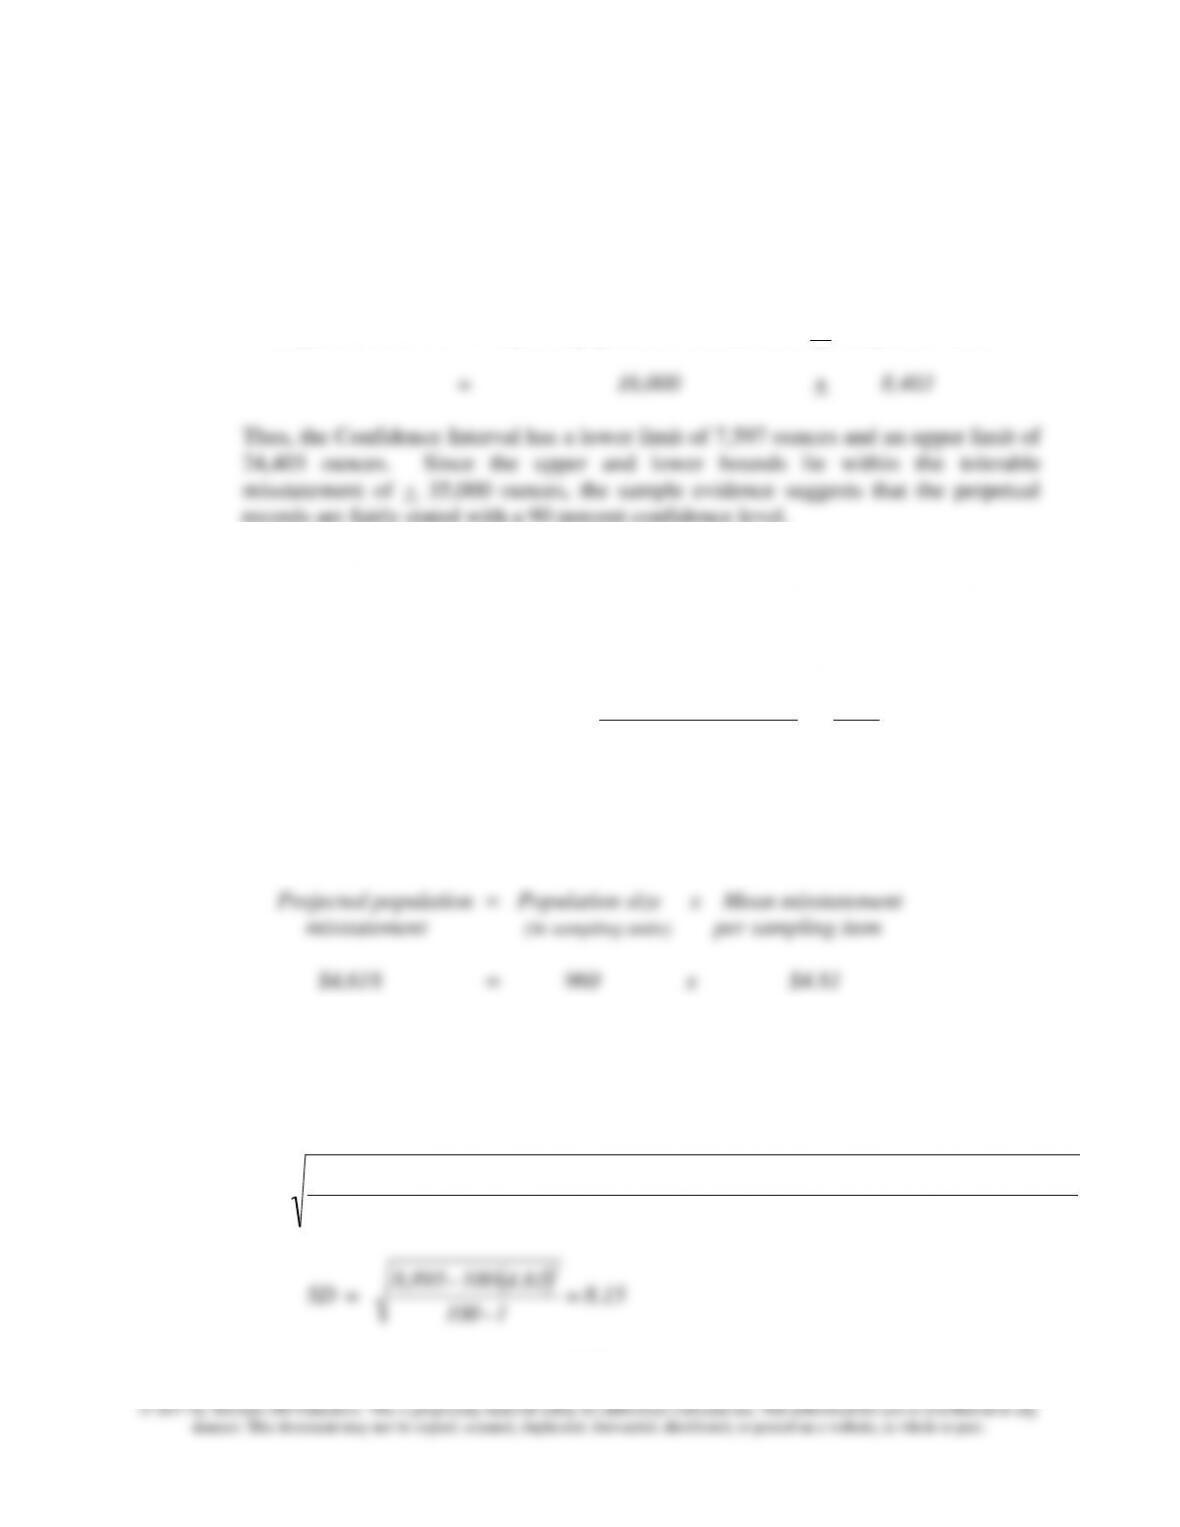
Projected population = Population size x Mean misstatement
misstatement (in sampling units) per sampling item
16,000 ounces = 4,000 x 4
The allowance for sampling risk is represented by the confidence bound. To calculate the
confidence bound, the auditor first calculates the standard deviation and then uses the
equation shown below, using the CC value for the level of desired confidence.
SD = Total squared audit difference – sample size x mean difference per samplingitem2
( )
sample size – 1
( )
4
100 – 17,856
2
where N = population size (in sampling units)
Chapter 09 – Audit Sampling: An Application to Substantive Tests of Account Balances
9-20
n = sample size
CC = Confidence Coefficient
SD = Standard Deviation of Audit Differences
For Cougar Goldust, the confidence bound is 8,403 ounces and the confidence
interval is calculated as follows:
Confidence interval = Projected population misstatement + Confidence bound
records are fairly stated with a 90 percent confidence level.
9-26 The calculation of the sample results for Hipp Supply Company is as follows:
The calculation of the mean misstatement per sampling item is:
Mean Misstatement per sampling item
= Total audit difference
SampleSize = $481
100 = $4.81
Thus, the average misstatement for an inventory item based on the sample data is an
overstatement of $4.81. Next, the mean misstatement is projected to the population as
follows:
The allowance for sampling risk is represented by the confidence bound. To calculate the
confidence bound, the auditor first calculates the standard deviation and then uses the
equation shown below, using the CC value for the level of desired confidence.
SD = Total squared audit difference – sample size x mean difference per samplingitem2
( )
sample size – 1
Chapter 09 – Audit Sampling: An Application to Substantive Tests of Account Balances
9-21
100
n
where N = population size (in sampling units)
CC = Confidence Coefficient
SD = Standard Deviation of Audit Differences
n = sample size
For Hipp Supply Company, the confidence bound is $1,283 and the confidence interval is
calculated as follows:
Confidence interval = Projected Population Misstatement + Confidence bound
Solutions to Discussion Cases
9-27 The incorrect assumptions, statements, and inappropriate applications of sampling are as
follows:
• Classical variables sampling is not designed for tests of controls.
• MUS uses each dollar in the population, not each account, as a separate sampling
unit.
• MUS is not efficient if many misstatements are expected because the sample size can
misstatement for this difference was actually $2,500 ($1,000/$4,000 x $10,000
sampling interval).
• The difference in the understated account (recorded amount of $1,900 and audited
Chapter 09 – Audit Sampling: An Application to Substantive Tests of Account Balances
9-22
was erroneous.
9-28 a. While Doug’s selection method is not random, judgmentally “targeting” items for
testing is acceptable under auditing standards and it may be preferable if there is
Chapter 09 – Audit Sampling: An Application to Substantive Tests of Account Balances
9-23
b. Because the items selected were not identified randomly, Doug cannot use statistical
sampling methods to quantify sampling risk or evaluate his results. His “sample”
accounts for 66% ($720,000/$1,090,000) of ending inventory and even though it isn’t
technically appropriate to project the results from the “sample,” in practice auditors
and are less likely to contain misstatements), it appears reasonable to conclude he has
sufficient evidence to consider the balance fairly stated.