Chapter 08 – Audit Sampling: An Overview and Application to Tests of Controls
8-1
CHAPTER 8
AUDIT SAMPLING: AN OVERVIEW
AND APPLICATION TO TESTS OF CONTROLS
Answers to Review Questions
8-1 Audit sampling is the application of audit procedures to less than 100 percent of the items
in a population of audit relevance selected in such a way that the auditor expects the
sample to be representative of the population and thus likely to provide a reasonable basis
for conclusions about the population. When the number of items or transactions in these
8-2 Type I and Type II errors are the two types of decision errors an auditor can make when
deciding that sample evidence supports or does not support a test of controls or a
substantive test based on a sampling application.
In reference to test of controls, Type I and Type II errors are:
• Risk of incorrect rejection (Type I): the risk that the assessed level of control risk based
on the sample is greater than the true operating effectiveness of the control. Also
commonly referred as the risk of assessing control risk too low or the risk of
overreliance.
In reference to substantive tests, Type I and Type II errors are as follows:
• Risk of incorrect rejection (Type I): the risk that the sample supports the conclusion
that the recorded account balance is materially misstated when it is not materially
misstated.
• Risk of incorrect acceptance (Type II): the risk that the sample supports the conclusion
8-2
8-3 Audit evidence types that do not involve audit sampling include:
• Analytical procedures
• Scanning
• Tests of automated information technology controls
8-4 Nonstatistical sampling is an approach in which the auditor uses a haphazard selection
technique or uses judgment in any or all of the following steps:
sampling risk for the purpose of reaching a conclusion about the population.
costs of (1) training auditors in the proper use of sampling technique, (2) added
complexity in designing and conducting the sampling application, and (3) lack of
consistent application across audit teams due to the complexity of the underlying concepts.
An advantage of nonstatistical sampling, particularly for large firms, which is indirectly a
disadvantage of a statistical sampling tool like IDEA, is that with a nonstatistical approach
a firm can develop firm-specific sampling tools and templates that are based on the
knowledge and expertise of national sampling experts. The tools and templates then
leverage the expertise of specialists and can make decisions and application associated
with audit sampling easier to use and the judgments more consistent for auditors in the
field.
8-5 Attribute sampling is used to estimate the proportion of a population that possesses a
specified characteristic. For tests of controls, the auditor wants to measure the deviation
8-6 The timing of testing often will determine the period to be covered by the test. For
example, interim testing may involve testing transactions from the first nine months of the
Chapter 08 – Audit Sampling: An Overview and Application to Tests of Controls
8-3
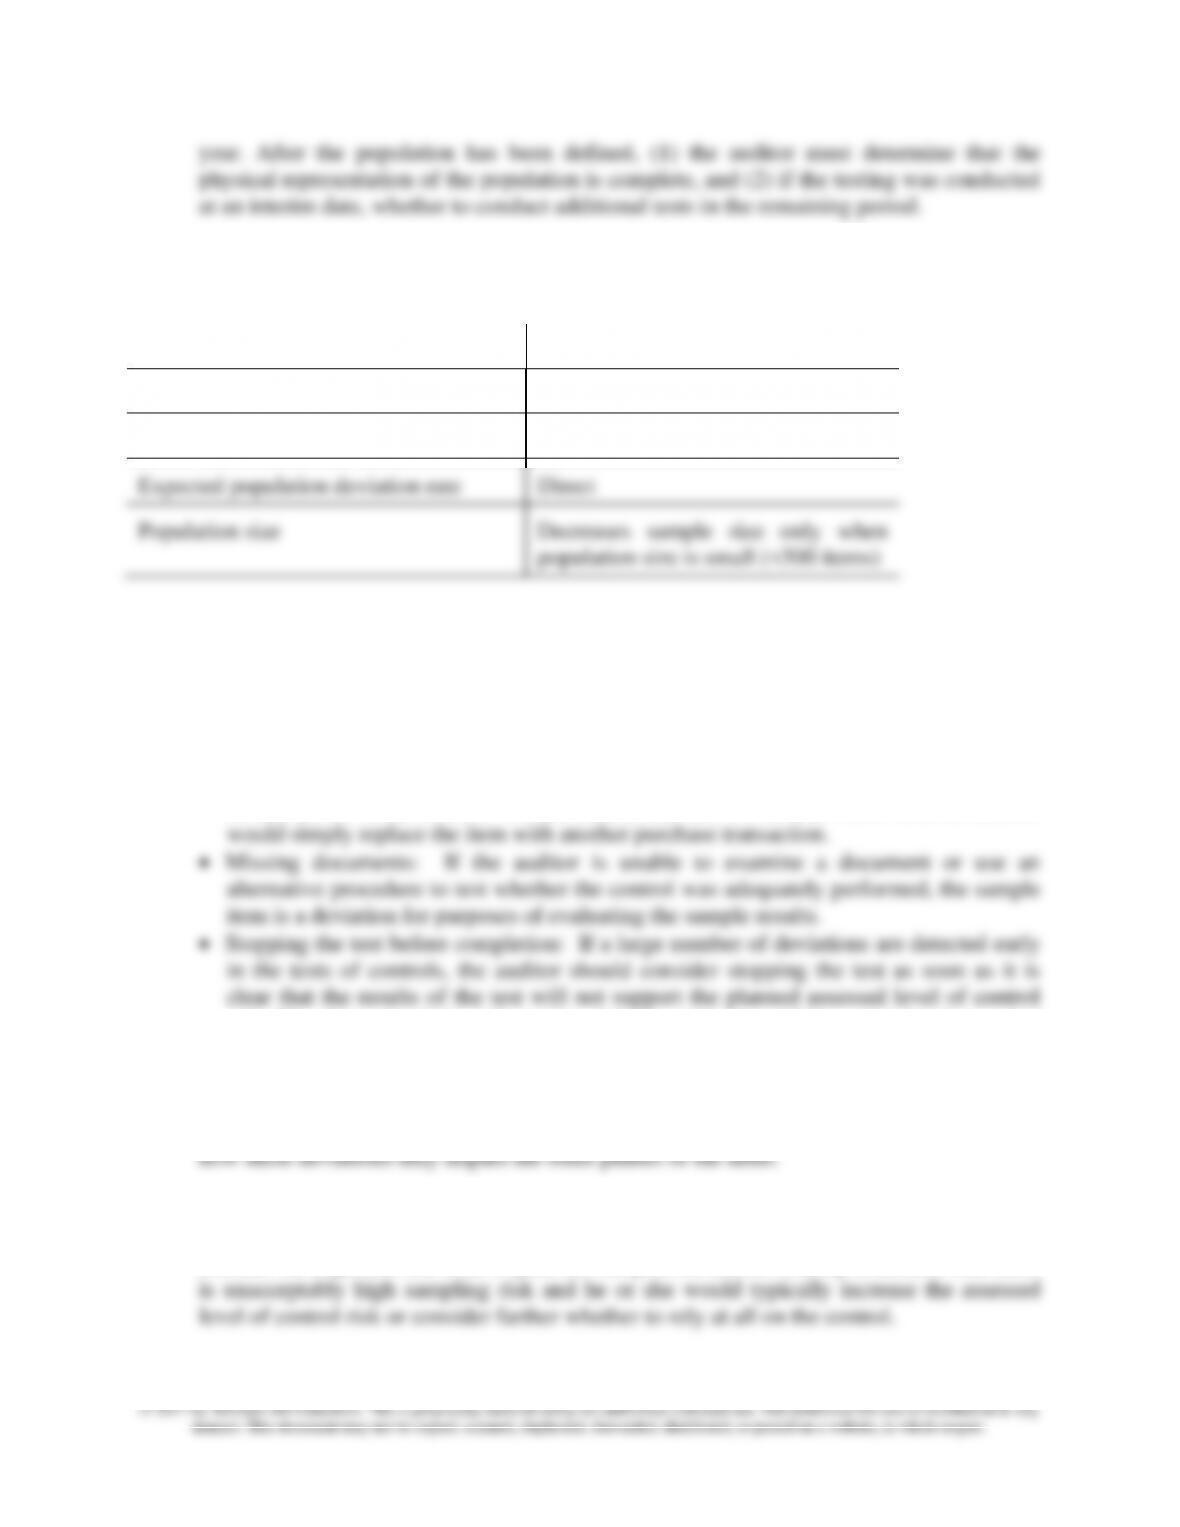
8-7 The four factors that enter into the sample size decision and their relationship with sample
size are:
Factor
Relationship to Sample Size
Desired confidence level
Direct
Tolerable deviation rate
Inverse
Expected population deviation rate
Direct
Population size
Decreases sample size only when
population size is small (<500 items)
8-8 In conducting the audit procedures for tests of controls, the auditor may encounter voided,
inapplicable, or missing documents. The auditor may also stop the test before completion.
Each of these situations should be handled in the following manner for an attribute-
sampling application:
• Voided documents: If the transaction has been properly voided, it does not represent a
deviation. The item should be replaced with a new sample item.
• Unused or inapplicable documents: Sometimes a selected item is not appropriate for
the definition of the control. In such a case, the item is not a deviation and the auditor
risk. The client should be informed and the exceptions would be considered a control
deficiency unless remediation and retesting are successful.
8-9 The auditor’s purposes in evaluating the qualitative aspects of deviations when performing
error analysis involves considering (1) the nature of the deviations and their causes and (2)
8-10 An auditor using nonstatistical sampling uses judgment to consider the allowance for
sampling risk. For example, when the rate of deviation from the prescribed control
exceeds the expected rate used to plan the sample, the auditor usually concludes that there
Chapter 08 – Audit Sampling: An Overview and Application to Tests of Controls
8-4
Answers to Multiple-Choice Questions
Solutions to Problems
8-21 a. The auditor’s justification for accepting the uncertainties that are inherent in the
sampling process are based upon the premise that (1) the cost of examining all of the
financial data would usually outweigh the benefit of the added reliability of a complete
component of the audit risk model, is composed of two risks or uncertainties: sampling
risk and nonsampling risk.
c. Sampling risk arises from the possibility that, when a test of controls or a substantive
test is restricted to a sample, the auditor’s conclusions may be different from the
conclusions he or she would reach if the test were applied in the same way to all items
in the population.
Nonsampling risk includes all the aspects of audit risk that are not due to
sampling and can occur because the auditor used an inappropriate audit procedure,
failed to detect a misstatement when applying an appropriate audit procedure, or
misinterpreted an audit result.
When performing a test of controls, the auditor can commit two types of decision
8-5
© 2017 by McGraw-Hill Education. This is proprietary material solely for authorized instructor use. Not authorized for sale or distribution in any
manner. This document may not be copied, scanned, duplicated, forwarded, distributed, or posted on a website, in whole or part.
8-22 a 6, b 5, c 7, d 1, e 4, f 2, g 3
8-23 1. In this scenario, the stratum of loans greater than $1 million is tested in total. Since
the entire population is tested, it does not involve sampling. Sampling is involved in
the second stratum because the auditor is only examining 15 of the 450 loans in the
stratum.
4. In this case, the auditor has decided not to audit the account because it is immaterial.
This approach does not involve sampling.
8-24 a. Table 8-2 provides 7 steps in attribute sampling. The list in Table 8-2 includes Jenny’s
step 3 within the second step of attributes sampling. The remaining steps of attribute
sampling are as follows:
2. Define remaining population characteristics—define the control deviation
conditions.
3. Determine sample size, using the following inputs.
• Determine the desired confidence level.
8-6
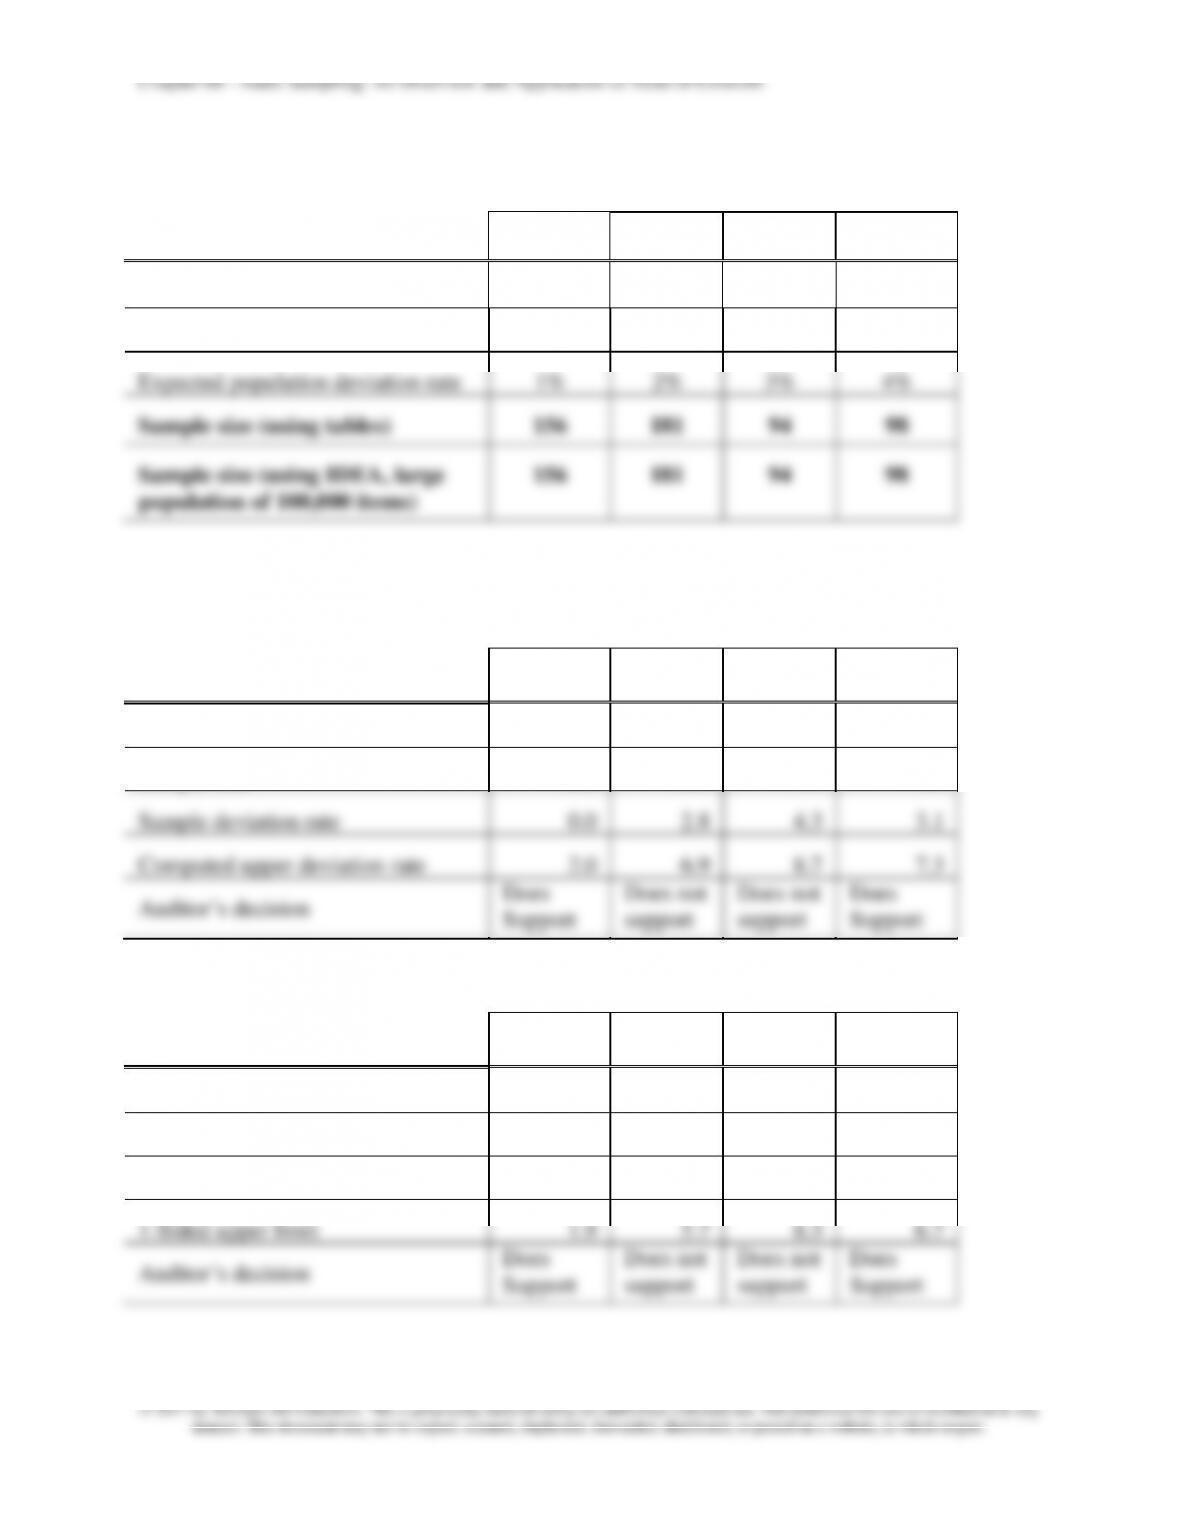
8-25 The sample size for each control procedure is:
Parameters
Control Procedure
1
2
3
4
Risk of incorrect acceptance
5%
5%
10%
10%
Tolerable deviation rate
4%
5%
7%
8%
Expected population deviation rate
1%
2%
3%
4%
Sample size (using tables)
156
181
94
98
Sample size (using IDEA, large
population of 100,000 items)
156
181
94
98
8-26 The computed upper deviation rate and the auditor’s decision for each control procedure
are:
Results Using Tables
Control Procedure
1
2
3
4
Number of deviations
0
5
4
3
Sample size
156
181
94
98
Sample deviation rate
0.0
2.8
4.3
3.1
Computed upper deviation rate
2.0
6.9
8.7
7.3
Auditor’s decision
Does
Support
Does not
support
Does not
support
Does
Support
Results Using IDEA (large
population of 100,000 items)
Control Procedure
1
2
3
4
Number of deviations
0
5
4
3
Sample size
156
181
94
98
Sample deviation rate
0.0
2.8
4.3
3.1
1-Sided upper limit
1.9
5.7
8.3
6.7
Auditor’s decision
Does
Support
Does not
support
Does not
support
Does
Support
Chapter 08 – Audit Sampling: An Overview and Application to Tests of Controls
8-7
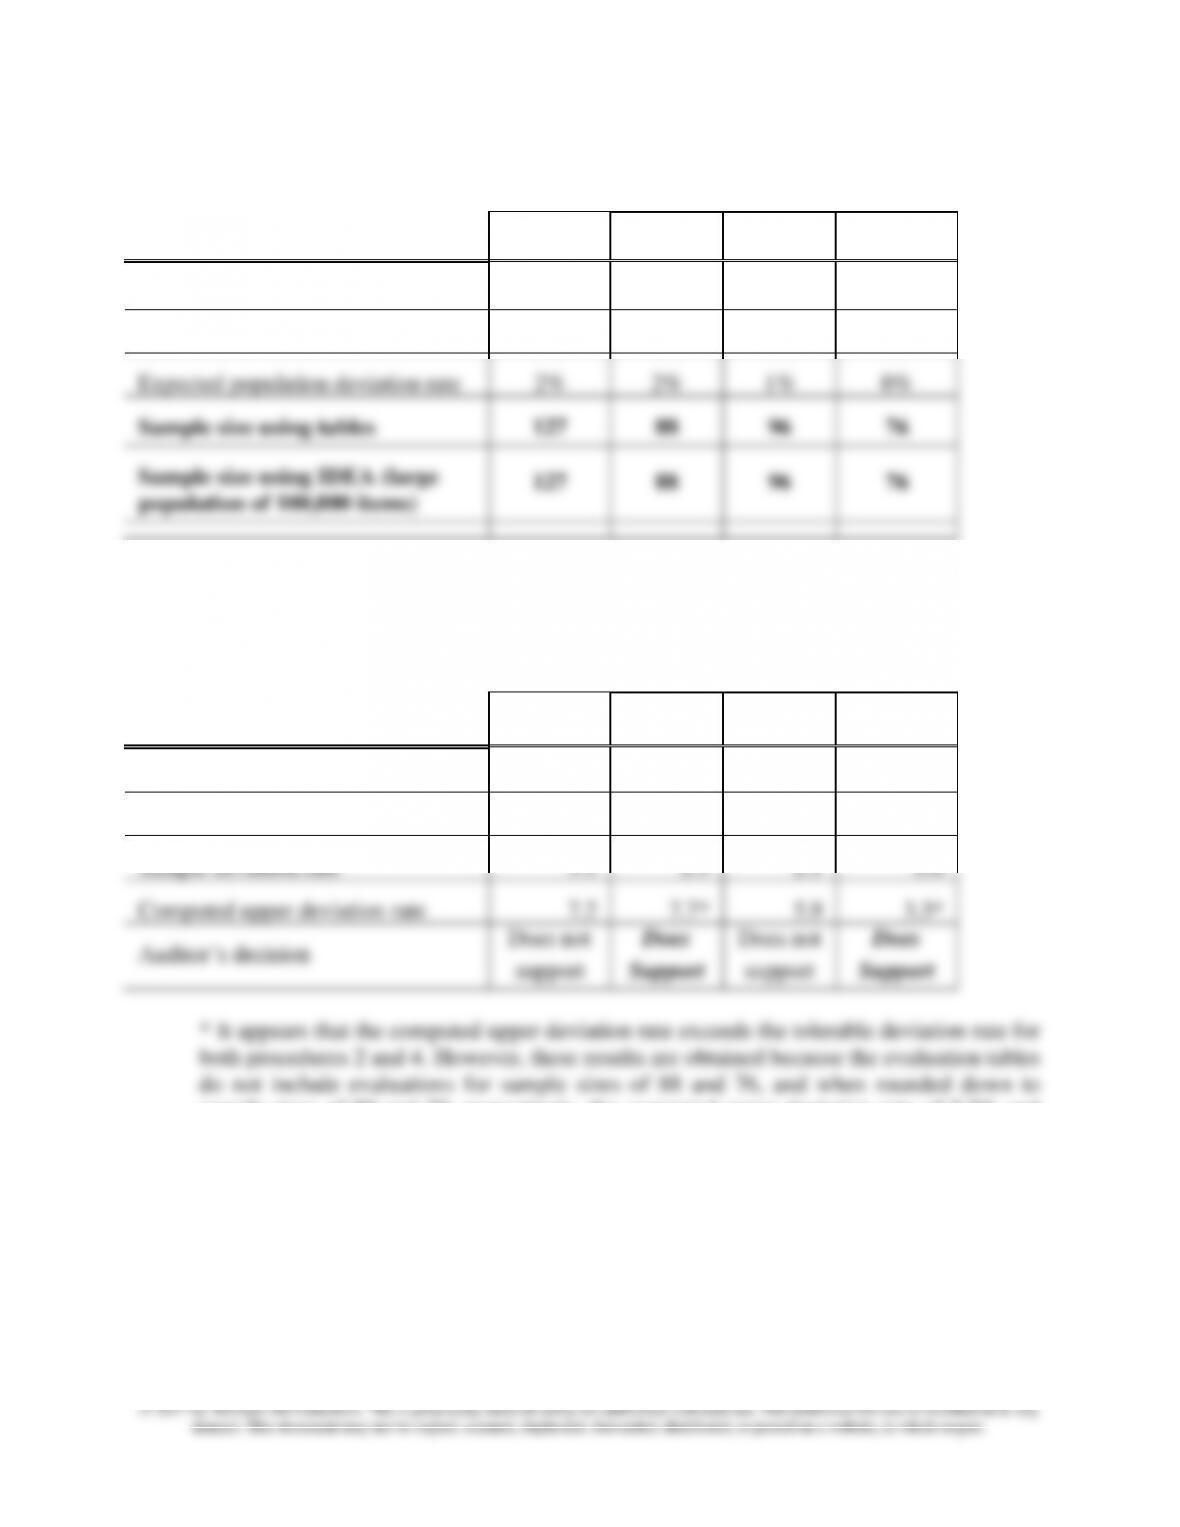
8-27 The sample size for each control procedure is:
Parameters
Control Procedure
1
2
3
4
Risk of incorrect acceptance
5%
5%
10%
10%
Tolerable deviation rate
6%
7%
4%
3%
Expected population deviation rate
2%
2%
1%
0%
Sample size using tables
127
88
96
76
Sample size using IDEA (large
population of 100,000 items)
127
88
96
76
8-28 The computed upper deviation rate and the auditor’s decision for each control procedure
are:
Results using Tables
Control Procedure
1
2
3
4
Number of deviations
4
2
2
0
Sample size
127
88
96
76
Sample deviation rate
3.1
2.3
2.1
0.0
Computed upper deviation rate
7.2
7.7*
5.9
3.3*
Auditor’s decision
Does not
support
Does
Support
Does not
support
Does
Support
* It appears that the computed upper deviation rate exceeds the tolerable deviation rate for
both procedures 2 and 4. However, these results are obtained because the evaluation tables
do not include evaluations for sample sizes of 88 and 76, and when rounded down to
sample sizes of 80 and 70, respectively, the computed upper deviation rate of 7.7% and
3.3% exceed the tolerable deviation rate. In reality, because a statistically derived sample
size was determined in problem 8-27 and because the allowed number of deviations was
found (see the number in parentheses in tables 8-5 and 8-6), the auditor is guaranteed that
the results are acceptable. Note that when using IDEA, rounding is not a potential source
for auditor error.
Chapter 08 – Audit Sampling: An Overview and Application to Tests of Controls
8-8
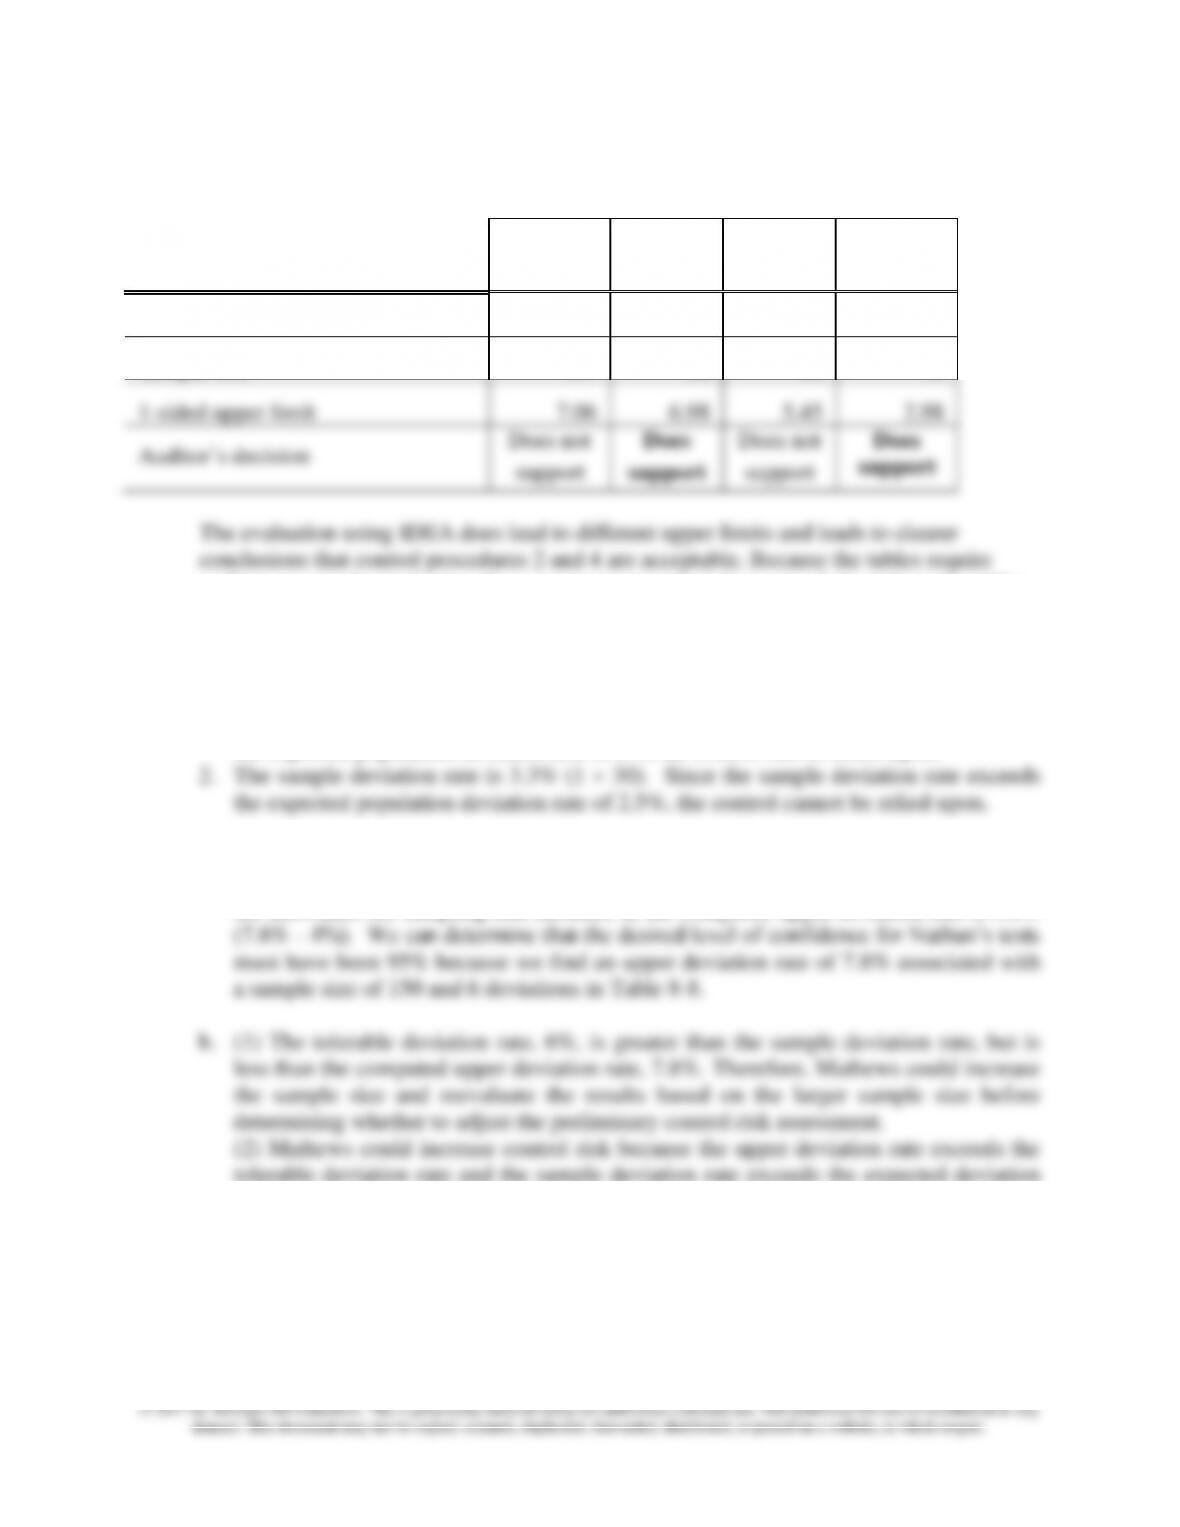
Using the IDEA, the 1- sided upper limit and the auditor’s decision for each control
procedure are:
Results using IDEA (large
population of 100,000 items)
Control Procedure
1
2
3
4
Number of deviations
4
2
2
0
Sample size
127
88
96
76
1-sided upper limit
7.06
6.98
5.45
2.98
Auditor’s decision
Does not
support
Does
support
Does not
support
Does
support
The evaluation using IDEA does lead to different upper limits and leads to clearer
conclusions that control procedures 2 and 4 are acceptable. Because the tables require
auditors to round sample size, the computed upper deviation rates derived from the tables
seem to initially suggest that 2 and 4 are not acceptable (see note above). IDEA provides
the advantage that exact sample sizes can be evaluated.
8-29 Austen’s conclusion on each item would be as follows:
1. The sample deviation rate is 1.3% (1 75). Since the sample deviation rate is less than
the expected population deviation rate of 2%, the control can be relied upon.
8-30 a. The allowance for sampling risk in this situation is the difference between the sample
deviation rate 4% (6/150) and the computed upper deviation rate of 7.8%. Therefore,
the allowance for sampling risk included in the computed upper deviation rate is 3.8%
tolerable deviation rate and the sample deviation rate exceeds the expected deviation
rate.
(3) Mathews could justify not adjusting the preliminary assessment because, even
though the upper deviation rate exceeds the tolerable rate, the sample deviation rate
from a relatively large sample is less than the tolerable rate and, upon further
consideration, Mathews may determine that he can accept a higher tolerable rate than
planned. However, he must recognize that this approach does not leave the allowance
for sampling risk he originally planned. Looking at Table 8-5, we see that the original

Chapter 08 – Audit Sampling: An Overview and Application to Tests of Controls
8-9
© 2017 by McGraw-Hill Education. This is proprietary material solely for authorized instructor use. Not authorized for sale or distribution in any
manner. This document may not be copied, scanned, duplicated, forwarded, distributed, or posted on a website, in whole or part.
sample size should have been 195 based on a tolerable deviation rate of 6% and an
Chapter 08 – Audit Sampling: An Overview and Application to Tests of Controls
8-10
expected population deviation rate of 3%.
8-31 Iceberge’s conclusion on each item would be as follows:
1. The sample deviation rate is 2.0% (1 50). Since the sample deviation rate is less
than the expected population deviation rate of 3%, the control can be relied upon.
Solution to Discussion Case
8-32 The following are the incorrect assumptions and statements and inappropriate applications
of attribute sampling in Baker’s procedures:
• Statistical sampling does not eliminate the need for professional judgment.
• The computed upper deviation rate is too high (20%) if Baker plans to assess control
• The allowance for sampling risk was incorrectly calculated.
• Baker’s reasoning concerning the decision that the sample supported a low assessed
level of control risk was erroneous.