Case 8 Teaching Note Cooper Tire & Rubber Company in 2014
377
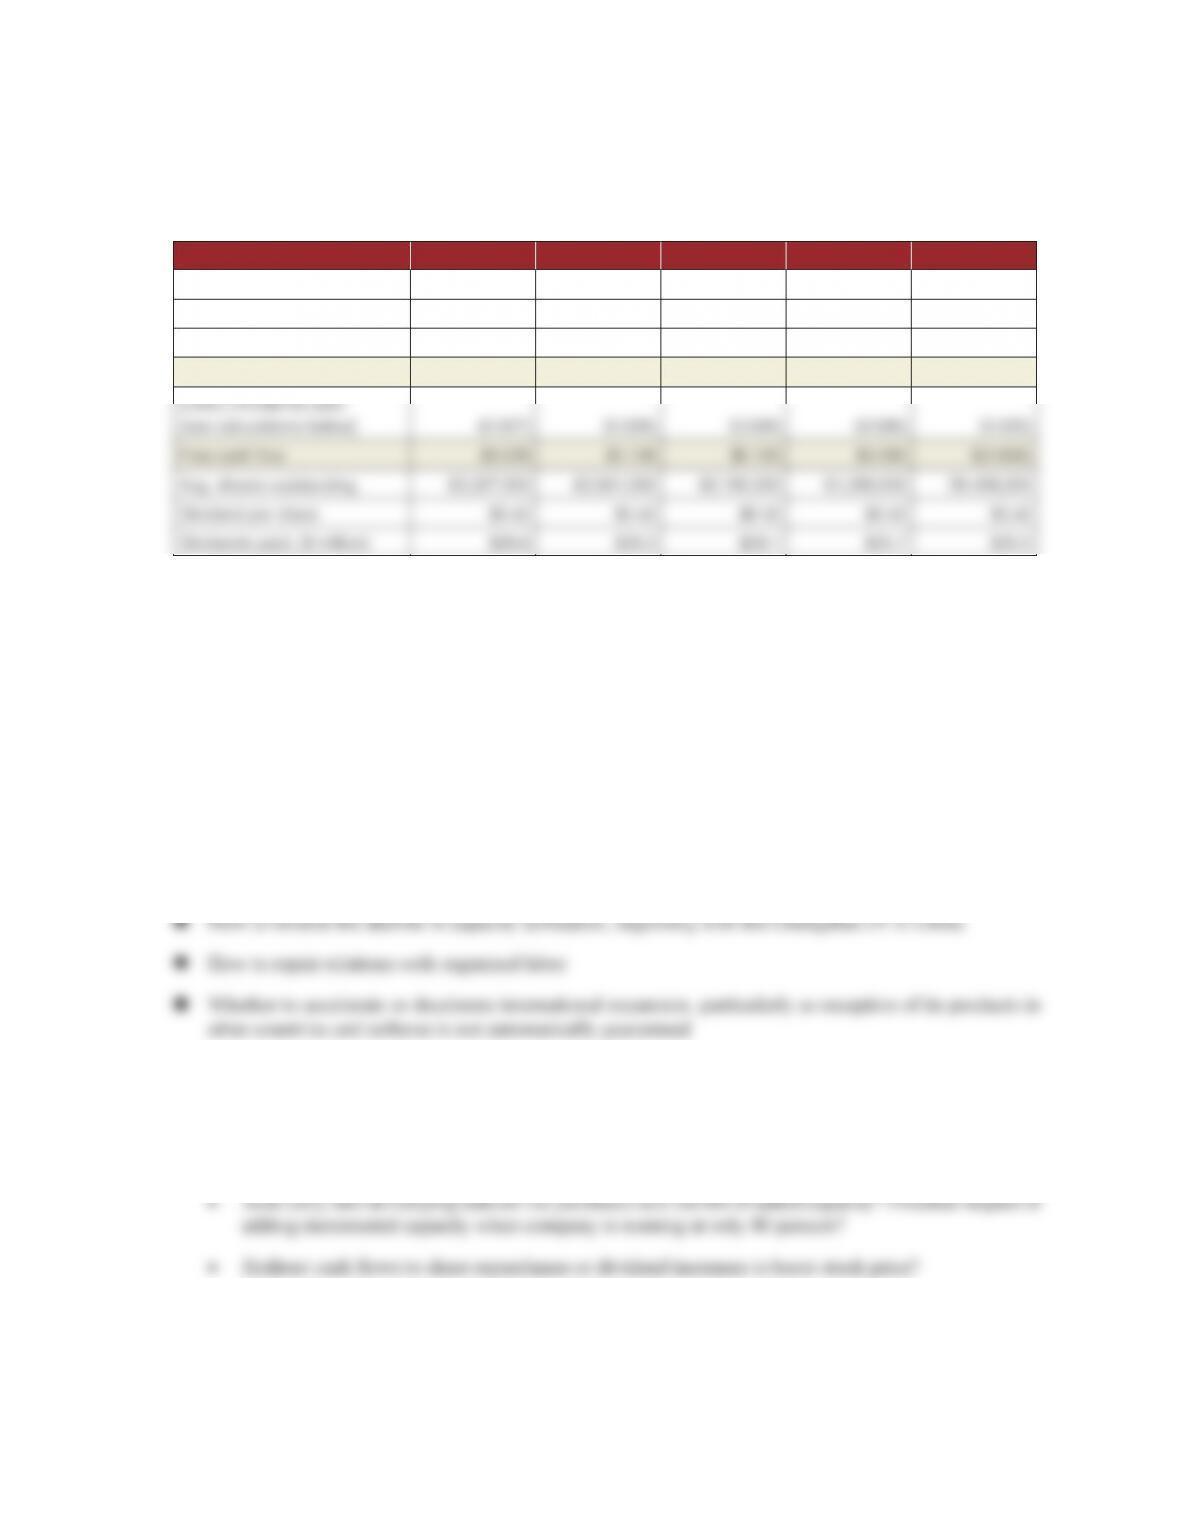
TABLE 8. Calculation of Cash Flows and Free Cash Flows
for Cooper Tire & Rubber Co.
2009–2013 ($ billions except where noted)
2013 2012 2011 2010 2009
Net income $0.111 $0.220 $0.254 $0.116 $0.089
Non-cash: Deprec. & amort. 0.135 0.129 0.123 0.124 0.124
(Less:) Capital expenditures (0.180) (0.187) (0.155) (0.120) (0.793)
Cash flow 0.065 0.162 0.221 0.120 (0.581)
Source: data in case Exhibit 1
7. What 3–4 top priority issues do CEO Roy Armes and Cooper Tire management need to
address?
We think it is always a good idea to push the class for their assessment of what issues management needs
to address before proceeding to ask for action recommendations. Issue identification (or compilation of a
“what I’d do if I were in her/his shoes” list) is a way for students to draw conclusions from all the preceding
analyses, plus it sets the stage for what actions need to be taken.
In Cooper Tire’s case, we see several high-priority issues meriting priority consideration:
n How best to put the failed merger in the “rear view mirror,” re-position Cooper Tires for long-term
growth, and rejuvenate interest and sales
n Where to direct future capital investment given strong cash ows, cash position, and unused debt
capacity
• Build on lucrative sales to the OEM markets (having begun with two Ford models)? Potential
impact of taking this action on current relationships with independent dealers worldwide?
Case 8 Teaching Note Cooper Tire & Rubber Company in 2014
378
8. What recommendations would you make to Cooper Tire CEO Roy Armes? At a minimum,
your recommendations should cover what to do about each of the top priority issues
identified in question 7.
n Forget about striving for market share (which drove the merger attempt with Apollo Tyres), and instead
make the focus a return to profitable growth
n Move upscale and continue introduction of premium tires emphasizing product differentiation
attributes—quality, performance, and safety
n Continue monitoring costs via:
• tight controls over capital spending,
• restructuring the organization,
9. [Optional question for adopters wishing to pair this case with materials in Chapter
6] How have Cooper Tire’s business strategy choices strengthened or weakened its
competitive position in the automotive tire industry? That is, what are the benefits and
drawbacks of the approaches taken to increasing Cooper Tire’s global scope?
Cooper Tire’s ability to achieving and sustaining a competitive advantage in the replacement segment of the
fiercely competitive automotive tire industry may well be confounded by the following factors:
n Chronic industry overcapacity, which has driven the wave of cross-border consolidation via acquisitions
by the largest producers
n Highly fragmented industry below the “top tier”—1,000 producers
n Prohibitive transportation costs—exacerbated if the points of sale are distant from the point of
manufacture
Case 8 Teaching Note Cooper Tire & Rubber Company in 2014
379
n Ease of buyers (independent dealers and vehicle owners) switching from one producer to another—
competition is based on price; most successful brands have a high price/performance ratio.
These are mitigated somewhat by the following factors:
n Industry maturity, exacerbated by unfavorable economic cycles for capital equipment
n Technological advances in production such as automation, robotics, ERP, GIS, and wireless technology
will in future not only lower costs of production and after-market service, but also lengthen product
lives, limiting replacement sales
n Lack of available mechanized substitutes that perform the same functions
On balance, due to the above factors, to achieve a competitive advantage, a producer of automotive tires
must compete via achieving economies of both scale (vertically) and scope (horizontally).
Vertical scale refers to the ability of a firm like Cooper Tire to capture higher value added across activities
such as investing in research and development (R&D) to improve product innovation and design; investing
Horizontal scope refers to the range of product and service segments that a firm like Deere serves within its
focal market, which is considerable due to its presence in nearly every sector of agricultural and construction
machinery. Increasing a company’s horizontal scope can strengthen its business and increase its profitability
Case 8 Teaching Note Cooper Tire & Rubber Company in 2014
380
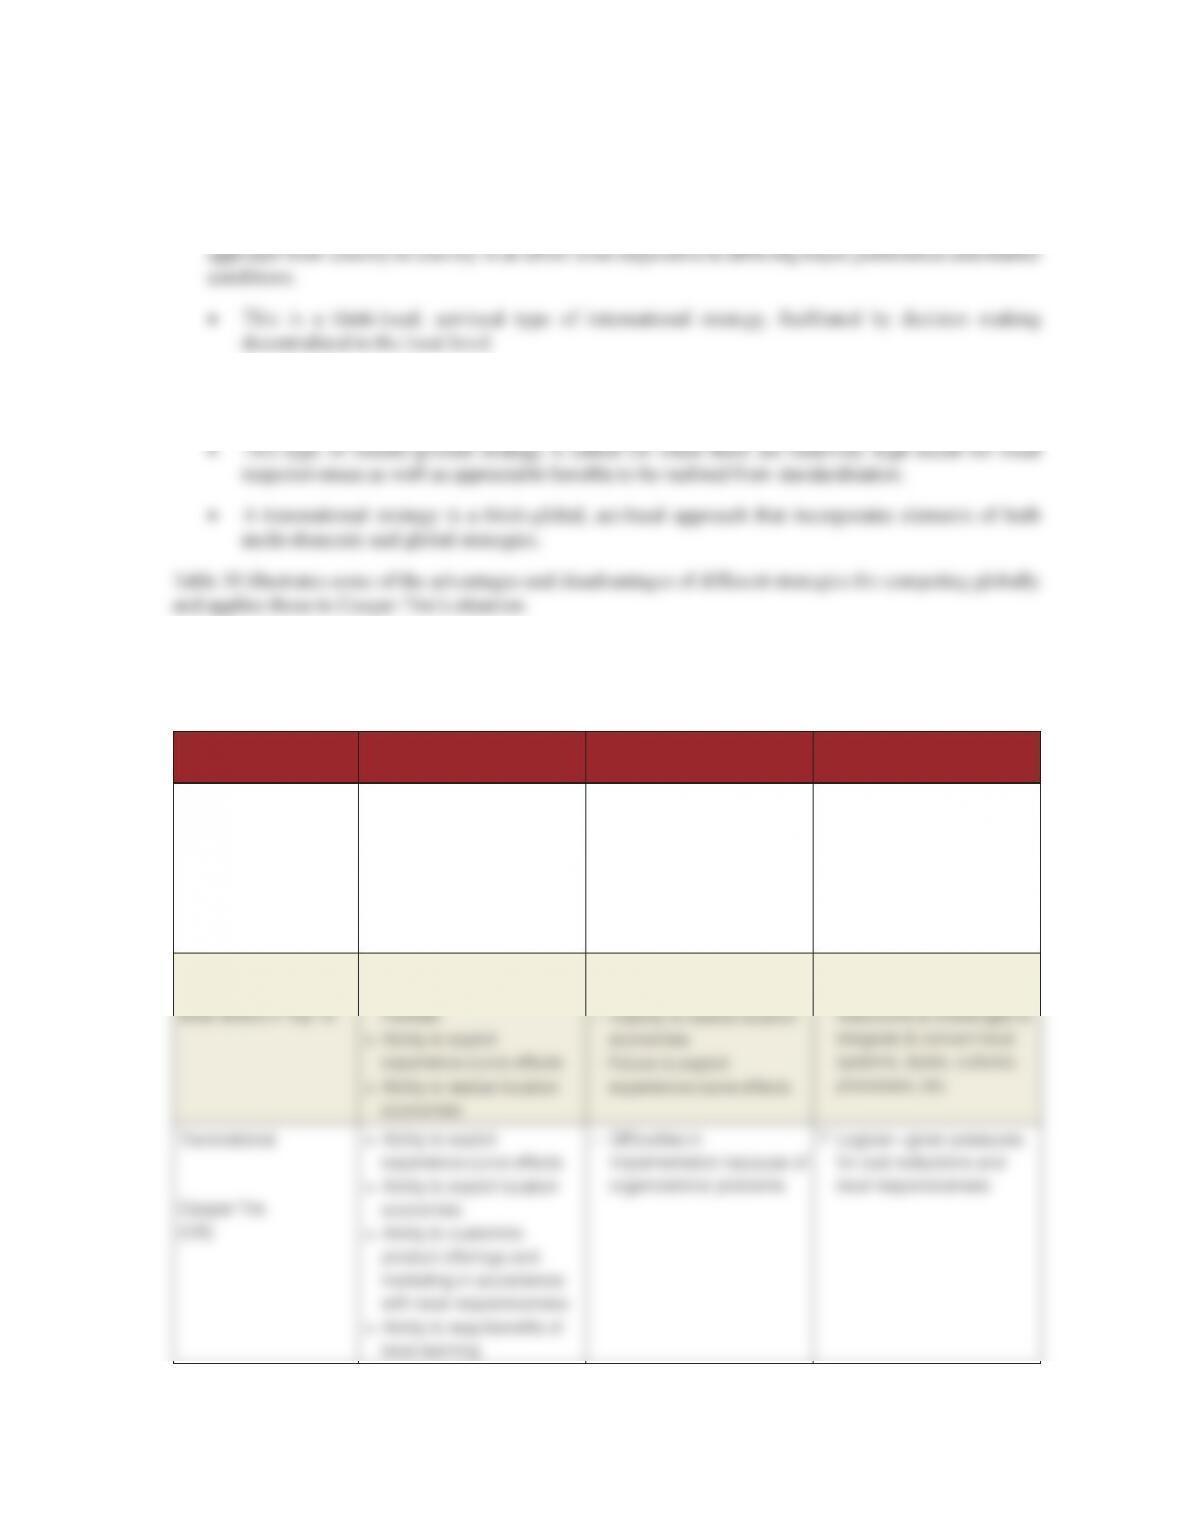
TABLE 9. Appraising Cooper Tire & Rubber Company’s Horizontal
Diversification Strategies
Strategic intent Plusses Minuses
Leverage global scale economies to
improve efficiency
Reduced transport costs, increased
effectiveness of dealerships &
aftermarket support, retailing-
financing division accounts for >90%
of sales across 40 countries
Highly dependent on favorable
balances of trade, weak U.S. dollar,
government subsidies & interest
rates
Heighten product differentiation via
Integrity & quality
Fundamental to strategy & to protect
global market leadership position
Unclear if culture & values will be
shared & implemented by operators
of manufacturing facilities in
emerging markets such as China,
Mexico, and Serbia
10. [Optional question for adopters wishing to pair this case with materials in Chapter
7] Is Cooper Tire’s international strategy best characterized as a multi-domestic
strategy, global strategy, or transnational strategy? What are the pros and cons of each
approach?
Any business contemplating globalization must make decisions regarding:
n The need to balance the cost of doing so with the multi-brand and multi-positioning (differentiation)
sides of its business model,
n The need to be responsive to local market vs. global market characteristics
Case 8 Teaching Note Cooper Tire & Rubber Company in 2014
381
Students should be directed to carefully review Figure 7.2 in the text:
n An international/global strategy is a strategy for competing in two or more countries simultaneously.
n A multi-domestic strategy is one in which a company varies its product offering and competitive
n A transnational strategy (sometimes called “glocalization”) incorporates elements of both a globalized
and a localized approach to strategy making.
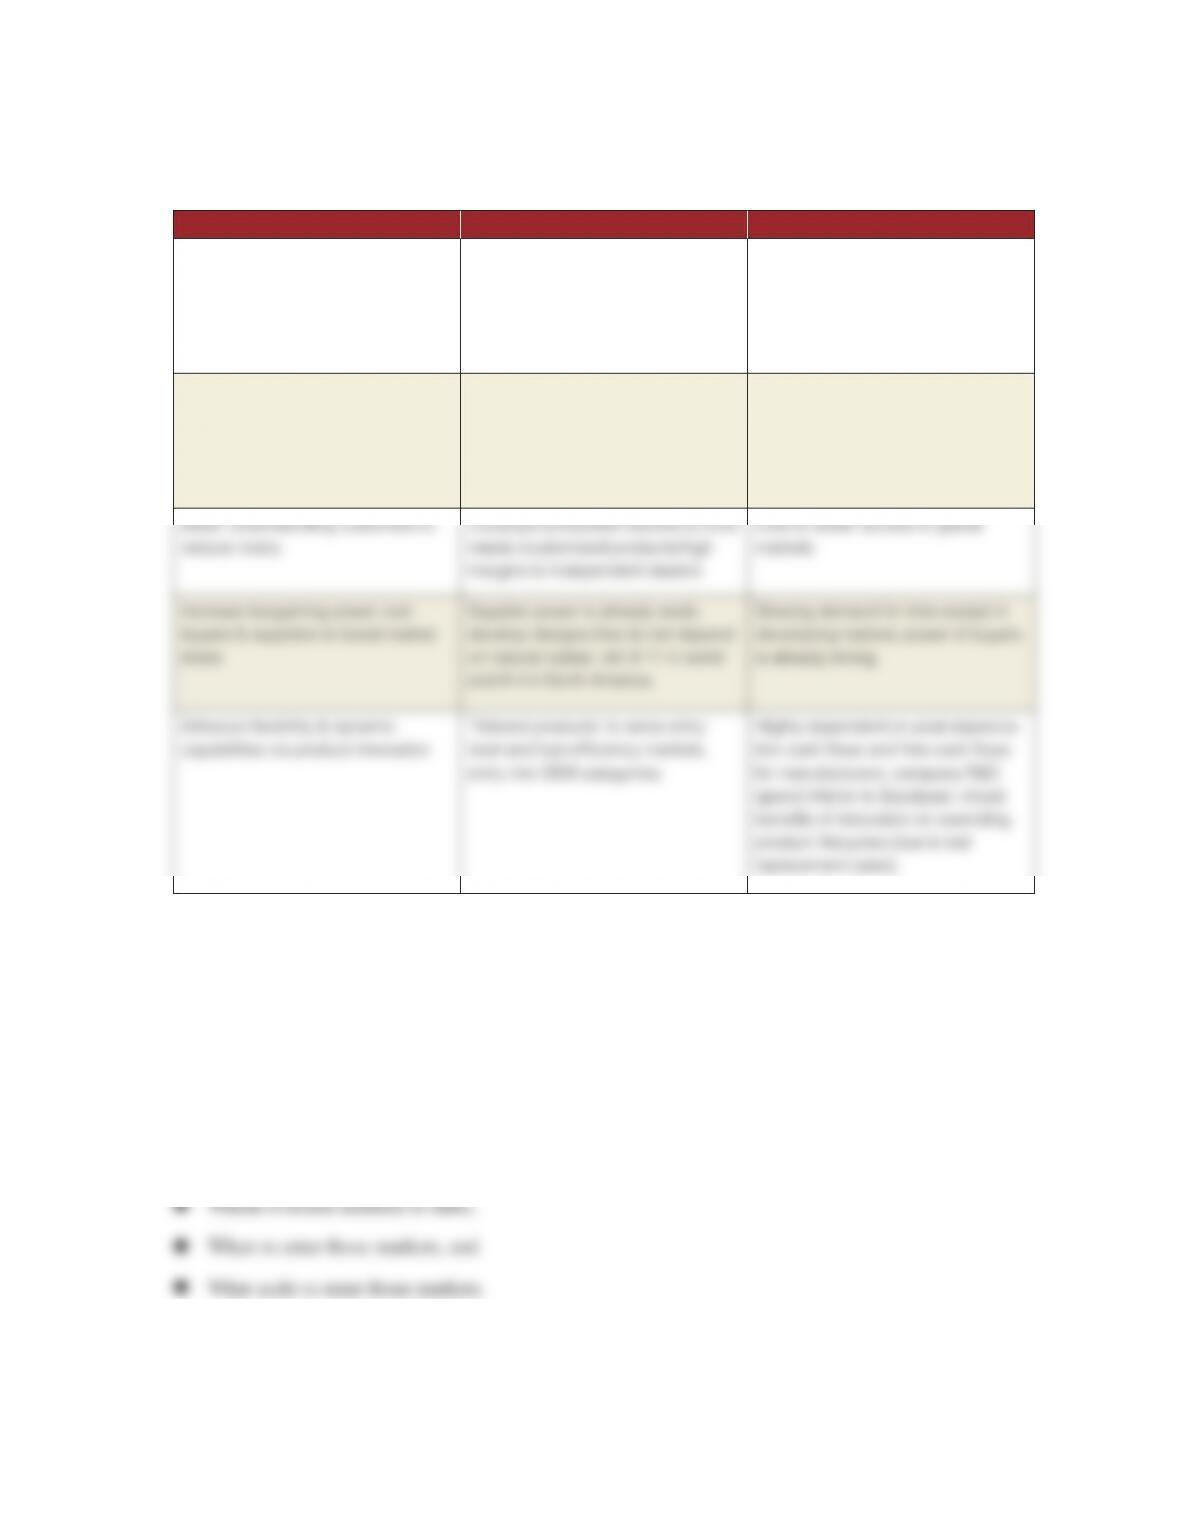
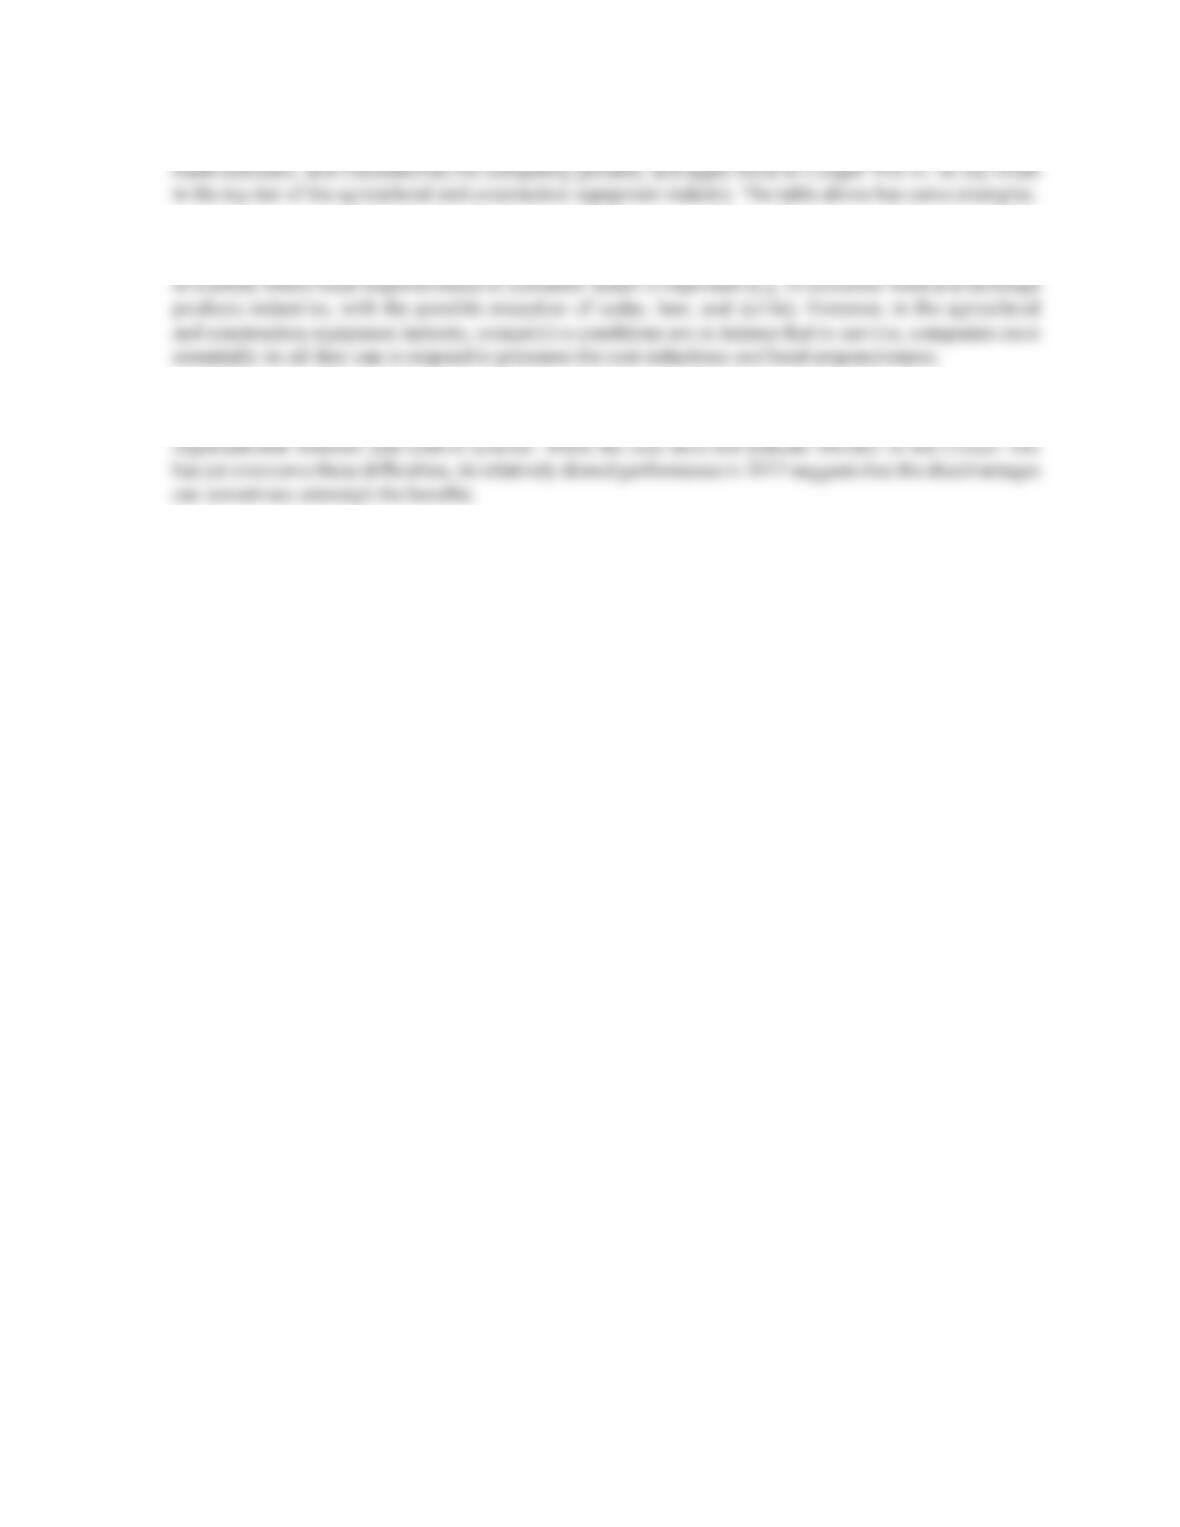
TABLE 10. Globalization Strategies of Key Rivals in Agriculture &
Construction Equipment
Strategy/
Company (HQ)
Potential
Advantages Potential Disadvantages Challenges for Rival
Multi-domestic
Bridgestone
(JP)
Groupe Michelin, (FR)
+
Ability to customize
product offerings and
marketing in accordance
with local responsiveness
–
Inability to realize location
economies
–
Failure to exploit
experience-curve effects
–
Failure to transfer
distinctive competencies
to foreign markets
?
JV and alliances meet
needs for localization in
emerging markets but do
not address need for cost
reductions
Global/International
+
Transfer of distinctive
competencies to foreign
–
Lack of local
responsiveness
?
Continuously driven
by pressures for cost
Case 8 Teaching Note Cooper Tire & Rubber Company in 2014
382
Superior students should weigh the advantages and disadvantages of various strategies (international/global,
The appropriateness of those strategies varies from industry to industry, depending upon the extent of pressures
for cost reductions and local responsiveness. International and global strategies tend to be least appropriate
Students should be reminded that building an organization capable of supporting a transnational strategy is
a complex and challenging task: implementation problems are often associated with creating the requisite
Epilogue
According to an August 7, 2014 report in the Wall Street Journal, Cooper Tire said its second-quarter profit
climbed 7.6% as the company benefited from strong increases in volume across most regions and a decline in
some expenses. The company’s revenue far outpaced analysts’ expectations.
“We continued our strong performance in what is usually a seasonally weak quarter, posting very good volume
growth in most geographic regions,” Chief Executive Roy Armes said. He added the lower raw material costs
results in decreased pricing, but the company experienced global unit growth of 10%.
Separately, the company also unveiled an accelerated share repurchase program with J.P. Morgan Chase Bank.
Under the agreement, Cooper said it would buy back $200 million of its shares, and will receive about 5.6
million shares at the beginning of the program.
In May 2014, Cooper Tire said it was aiming for annual net sales of $5 billion to $6 billion in the long term,
though the future ownership of its Chinese joint venture may affect some of the details of how and when it will
reach its goals.
In January, Ohio-based Cooper Tire reached an agreement with the joint venture and its labor union to begin the
process to determine whether Cooper Tire or Chengshan Group Company Ltd. will take control of the venture.
The Chinese venture was a hurdle in Cooper Tire’s failed sale to Indian suitor Apollo Tyres Ltd. last year. In
December 2013, Cooper Tire officially terminated its sale to Apollo after months of delay during which Apollo
sought to reduce the price.
During the second quarter of 2014, net sales from Cooper Tire’s international tire operations slid 8% to $327
million, despite higher unit volume in Asia and Western Europe, which was offset in part by weakness in Russia
and Eastern Europe .North America tire operations net sales rose 3% to $639 million, as shipments jumped 9%
year-over-year. Overall, Cooper Tire posted a profit of $38.2 million, or 59 cents a share, up from $35.5 million,
or 55 cents a share, a year earlier. Selling, general and administrative expenses fell 12% to $71.3 million. Net
sales ticked up 0.5% to $888.7 million. Analysts surveyed by Thomson Reuters had projected revenue of $863
million a share. Raw material prices fell 1% during the second quarter, and Cooper Tire expected them to be at
during the third quarter of fiscal 2014.
On August 23, 2014, the Wall Street Journal reported that Cooper Tire had unveiled the valuation of its joint
venture with Chengshan Group Company Ltd., marking a step forward as the companies seek to resolve its
future ownership. The venture, known as Cooper Chengshan Tire Company Ltd., was valued at about $440
million by an independent firm responsible for determining a fair market value for the venture on a stand-alone
basis, Cooper Tire said.
Case 8 Teaching Note Cooper Tire & Rubber Company in 2014
383
“We look forward to final resolution of the ownership of CCT as Cooper Tire continues to pursue our growth
plans for China,” said Cooper Tire Chief Executive and Chairman Roy Armes.
The venture’s facility in Rongcheng, China, was a source of contention in Cooper Tire’s failed $2.2 billion
merger with Indian suitor Apollo Tyres Ltd. The merger fell apart in December after the factory in eastern China
revolted, with workers going on strike soon after the merger was originally announced in June.
With the valuation of the venture, Chengshan now has 45 days to decide to purchase Cooper Tire’s 65% interest
or opt to sell its own 35% interest to Cooper Tire. If it doesn’t move on either option, Cooper Tire has said it
had the right to purchase Chengshan’s 35% interest. In the event that neither company makes a move, the joint
venture will continue as currently structured, Cooper Tire has said. Even if Chengshan did buy its stake in the
joint venture, Cooper Tire has said CCT still would produce Cooper Tire-brand products for a minimum of three
years.
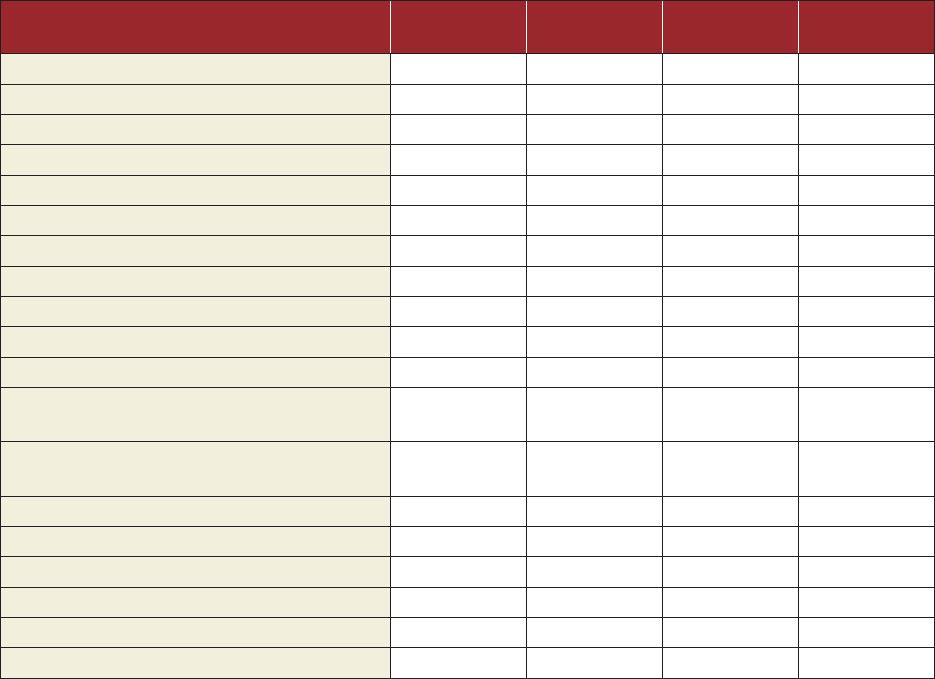
Table 11 presents a Financial Summary for Cooper Tire & Rubber Company for the first six months of 2014
compared to the first six months of 2013.
TABLE 11. Financial Summary for Cooper Tire & Rubber Company
First Six Months 2013 and First Six Months 2014
All figures in $000 except per share data
06/30/2014
2nd Quarter
06/30/2013
2nd Quarter
03/31/2014
1st Quarter
03/31/2013
1st Quarter
Net sales $888,685 $884,126 $796,458 $861,681
Cost of products sold 740,816 733,966 649,116 703,763
Gross profit (loss) 147,869 150,160 147,342 157,918
Selling, general & administrative expense 71,280 80,994 66,431 61,254
Operating profit (loss) 76,589 69,166 80,911 96,664
Interest expense 6,792 7,231 7,118 7,101
Interest income 270 141 513 296
Other income (expense) 477 -834 -11 595
Income (loss) before income taxes 70,544 61,242 74,295 90,454
Income tax expense (benefit) 25,786 19,642 22,567 27,617
Net income (loss) 44,758 41,600 51,728 62,837
Net loss (income) attributable to noncontrolling
interests -6,576 -6,114 -6,294 -6,757
Net income (loss) attributable to Cooper Tire &
Rubber Company 38,182 35,486 45,434 56,080
Weighted average shares outstanding—basic 63,537 63,342 63,399 63,226
Weighted average shares outstanding—diluted 64,481 64,142 64,338 64,184
Year end shares outstanding 63,594 63,313 63,457 63,313
Net income (loss) per share—basic $0.60 $0.56 $0.72 $0.89
Net income (loss) per share—diluted $0.59 $0.55 $0.71 $0.87
Dividends per share $0.11 $0.11 $0.11 $0.11