Case 8 Teaching Note Cooper Tire & Rubber Company in 2014
369
Factors that act to weaken competitive pressures from customers for manufacturers of automotive tires:
• Evidence of increasing consolidation among global tire manufacturers suggests that the number
• Some car owners are reluctant to replace the OEM tires (those that came with their vehicle) with
• The likelihood of an individual vehicle owner integrating backwards into design, procurement, and
Therefore, we believe that bargaining power of buyers of automotive tires, from intermediate reseller
to end-user (car owner) is a strong force, with the possible exceptions of the truly budget-conscious
Conclusions regarding the Overall Strength of All Five Competitive Forces in Automotive
Tires: The collective strength of the five competitive forces facing Cooper Tire and its ten primary rivals
in automotive tires is moderately strong but not yet so fierce as to prevent incumbent rivals from earning
attractive profits in a slow-growth, mature market. Innovation, globalization, and consolidation trends
2. What do you see as the key success factors in the global automotive tire industry?
Listing industry Key Success Factors (KSFs) should be an enjoyable part of the class discussion—we like to
have students help generate the list and then remind them that they are unlikely to remember more than three
Key Success Factors in the Automotive Tire Industry
n Relative price
n Product quality
n Product performance
Narrowing down the list of priority factors is often subject to debate, but students tend to agree that relative
Case 8 Teaching Note Cooper Tire & Rubber Company in 2014
370
3. What does a SWOT analysis reveal about the overall attractiveness of Cooper Tire’s
situation?
Cooper Tire’s Resource Strengths and Competitive Capabilities
n Employee incentive system, stock ownership, and training programs
n Consistent track record of high growth and profitability through 2012
Cooper Tire’s Resource Weaknesses and Competitive Liabilities
n Severely declining sales and profit and EPS growth
n Relatively small size and asset base for a global competitor
n Possible serious misstep in attempted merger with Apollo Tyres in 2013—impacted profits, caused labor
External Market Opportunities
n Strong consumer demand for Zeon and Discoverer brand tires
n Increasing traction in the OEM tire segment, beginning with 2013 selection as standard equipment on
Ford Focus Titanium and SE models
Case 8 Teaching Note Cooper Tire & Rubber Company in 2014
371
External Threats to Cooper Tire’s Future Well-Being
n Increasingly fierce competition exacerbated by global consolidation
n China’s lowest cost producer status and probable entry into branded tire market
n Lower than anticipated growth in demand for automotive tires in emerging economies
Conclusions regarding the attractiveness of J. Crew’s overall situation:
On balance, Cooper Tire’s future outlook for growth and profitability is a mixed bag. On the plus side,
Cooper Tire has enjoyed an impressive track record to 2012, so 2013 may turn out to be an anomalous year
in the company’s recent history—due to the failed merger and general industry downturn—and upticks
in growth and profitability can be assured. There are, however, many question marks as to whether or not
one year’s decline in operating results was a sufficient demonstration of Cooper Tire’s inability to compete
globally as well as the beginning of the end of its longevity and resiliency as a rival in the global automotive
4. What are the primary components of Cooper Tire’s value chain?
Three primary components of Cooper Tire’s value chain stand out:
1. Product design and process innovation via R&D
2. Inbound logistics via global raw materials procurement and sourcing
Case 8 Teaching Note Cooper Tire & Rubber Company in 2014
372
5. What are the key elements of Cooper Tire’s strategy? Which one of the five generic
competitive strategies discussed in Chapter 5 most closely approximates the
competitive approach that Cooper Tire is employing?
Class members should be expected to identify several key elements of Cooper Tire’s strategy:
n Rebrand Cooper Tires via introduction of premium tires emphasizing product differentiation attributes—
quality, performance, and safety
n Drive down costs via:
• tight controls over capital spending,
• restructuring the organization,
n Purchase majority stakes to assume control over joint ventures in China and Mexico
n Enhance capabilities via shifting the culture at Cooper Tires to a continuous improvement mindset, using
n Create a less hierarchical and more cooperative, at organization via more effective recruiting and
employee empowerment in decision-making
Based on the above strategy elements, the class is likely to make valid arguments on both sides regarding
whether Cooper Tire is pursuing:
— or —
A best-cost provider generic strategy: giving customers more value for the money by offering upscale
product attributes at a lower cost than rivals. Being the “best-cost” producer of an upscale product
To underscore some of the key points about the pitfalls of a differentiation strategy (discussed in Chapter
5), Cooper Tire must seek out sources of uniqueness that are either time-consuming or burdensome for its
automotive tire rivals to match, if it hopes to achieve a sustainable competitive edge. While Cooper Tire’s
Case 8 Teaching Note Cooper Tire & Rubber Company in 2014
373
A best-cost generic strategy works well in recessionary times when great masses of buyers become value-
conscious and are attracted to economically priced products, and it is evident that Cooper Tire benefited
during the 2008–09 recession from adopting many of the elements of such a strategy. As stated in Chapter
5, in order to be successful, a best-cost provider has to achieve significantly lower costs—lower labor costs,
or via higher volume and more efficient production—while bringing a brand upscale. Cooper Tire has
So, there is a case to be made that the intent of Cooper Tire’s strategy is to become a best-cost provider,
focused primarily on the replacement segment of the automotive tire market. However, Cooper Tire is not
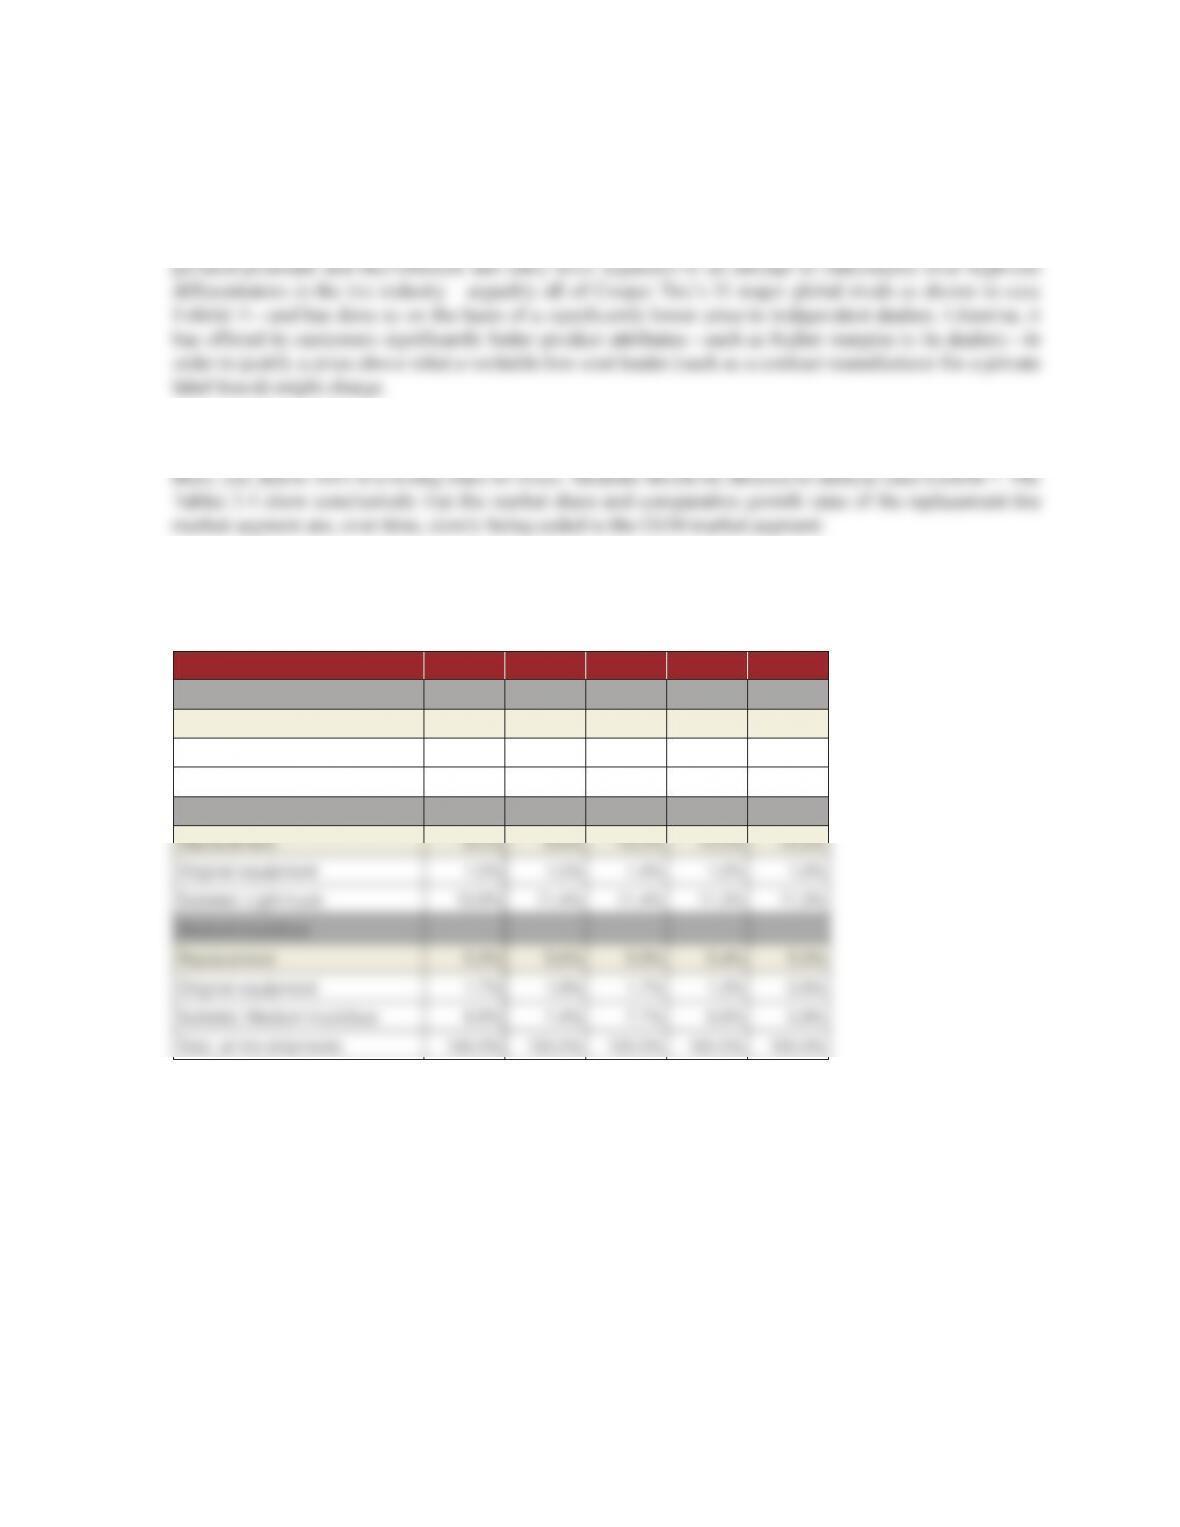
TABLE 2. Market Share Percentage by Segment, U.S. Tire Shipments,
2009–2013
2013 2012 2011 2010 2009
Passenger
Replacement 67.4% 67.1% 68.3% 70.0% 72.9%
Original equipment 14.7% 14.1% 12.6% 12.2% 9.9%
Subtotal, Passenger 82.1% 81.2% 80.9% 82.2% 82.8%
Light truck
Source: data in case Exhibit 7
Case 8 Teaching Note Cooper Tire & Rubber Company in 2014
374
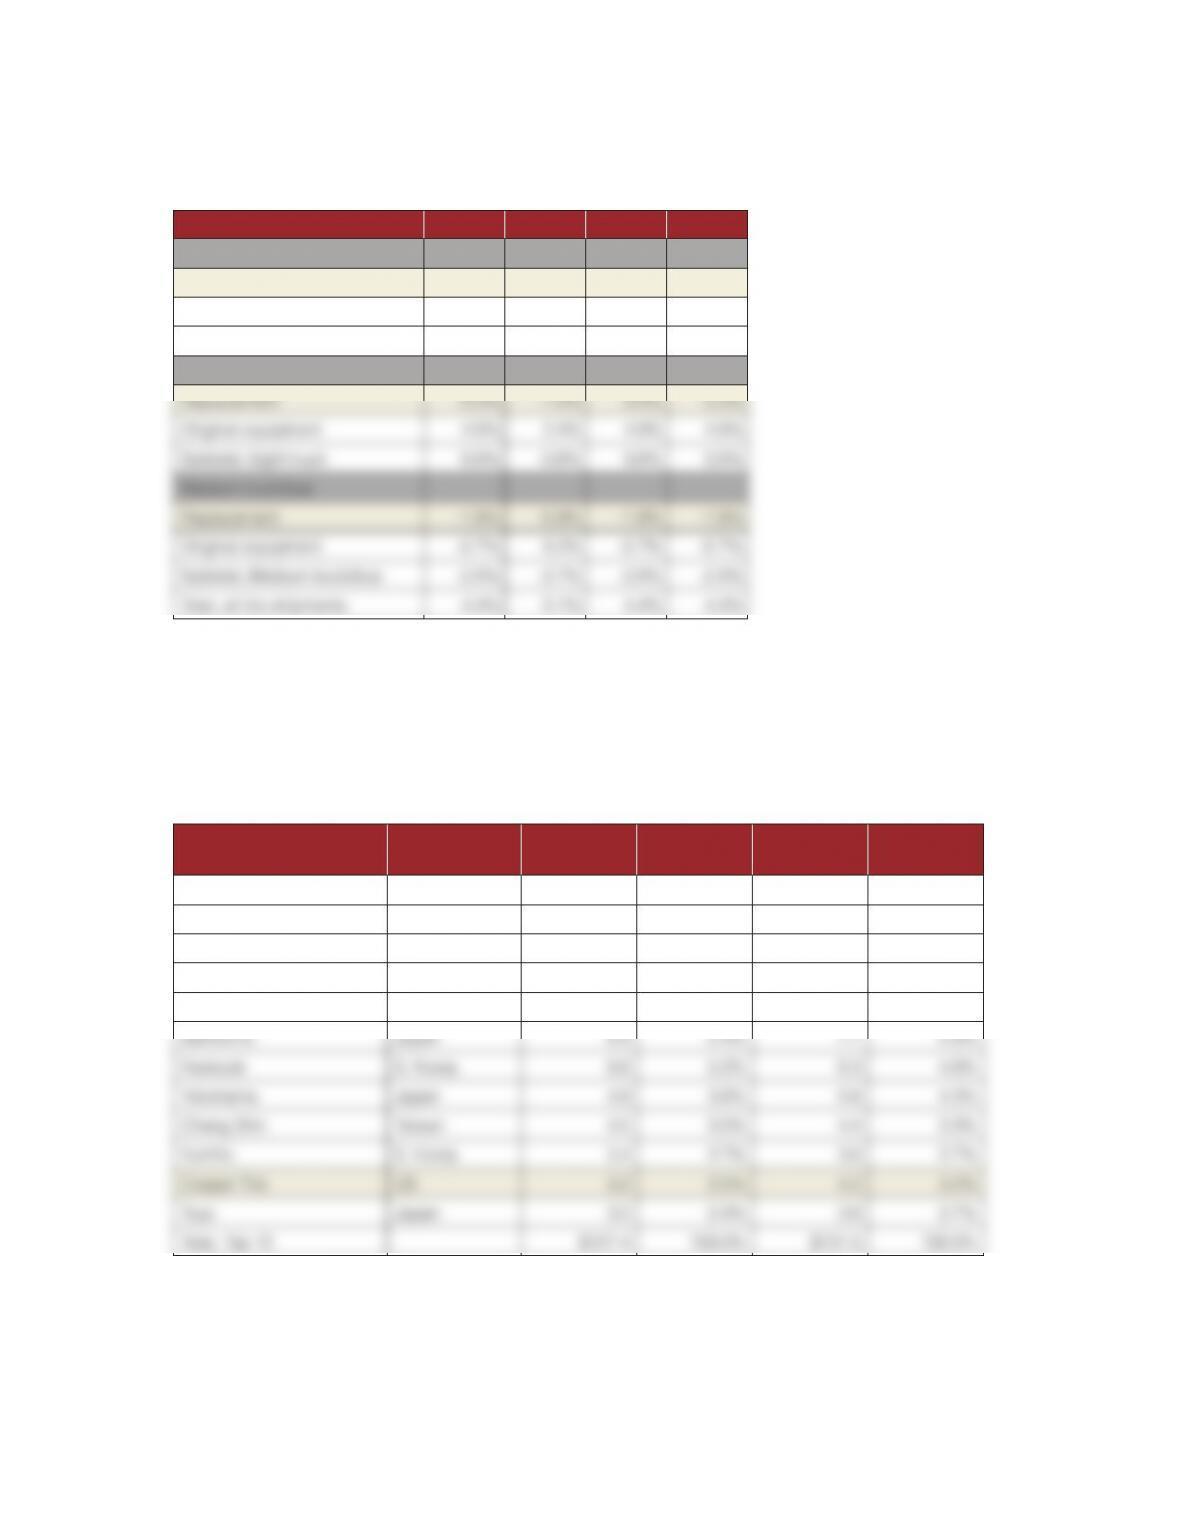
TABLE 3. Year-on-Year Growth Rate by Segment, U.S. Tire Shipments,
2010–2013
2013 2012 2011 2010
Passenger
Replacement 5.0% -1.8% 5.0% 5.0%
Original equipment 8.6% 12.5% 8.6% 8.6%
Subtotal, Passenger 5.6% 0.4% 5.6% 5.6%
Light truck
Source: data in case Exhibit 7
Careful inspection of case Exhibit 5 should reveal Cooper Tire’s eroding market share among the top 12
global automotive tire manufacturers:
TABLE 4. Market Share of Leading Sellers of New Tires Worldwide,
2012–2013 ($ in Billions)
Company Country 2013
% Share
of Top 12 2012
% Share
of Top 12
Bridgestone Japan $31.2 24.5% $32.0 24.3%
Groupe Michelin France 26.8 21.0% 27.4 20.8%
Goodyear US 18.9 14.8% 20.2 15.4%
Continental Germany 13.0 10.2% 12.4 9.4%
Pirellli Italy 8.0 6.3% 7.7 5.9%
Source: data in case Exhibit 5
Case 8 Teaching Note Cooper Tire & Rubber Company in 2014
375
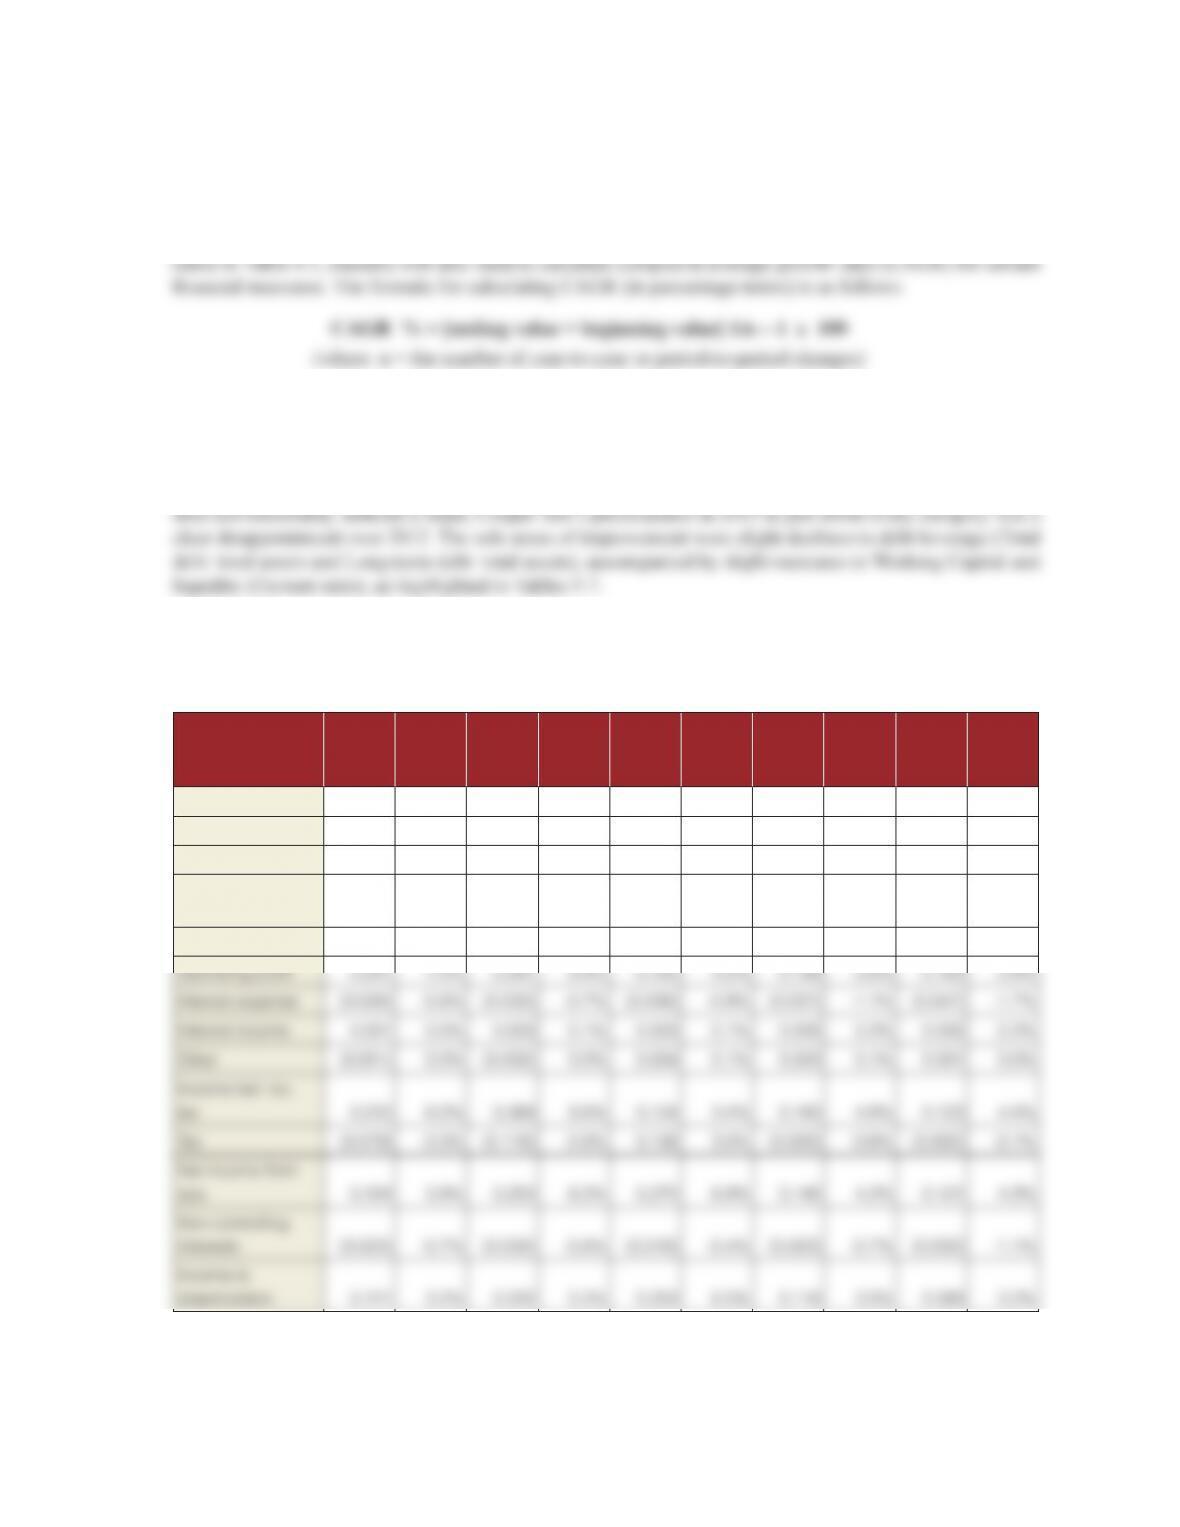
6. What do the data in case Exhibit 1 reveal about Cooper Tire’s financial and operating
performance?
You should expect class members to use the financial ratios in Table 4.1 of Chapter 4 in performing
calculations to illustrate trends in Cooper Tire’s key operating and financial metrics. In addition to the
The tables on the next pages summarize and highlight Cooper Tire’s most significant income statement and
balance sheet relationships over the five fiscal years, 2009–2013.
Students should observe that Cooper Tire’s 36 percent CAGR in both sales and profits have been remarkably
robust over the four-year period from 2009 to 2013. That said, however, although one year’s performance
TABLE 5. Common Size Income Statements for Cooper Tire &
Rubber Co., 2009–2013
FYE—all amounts
in billions except
EPS) 2013
% of
Total 2012
% of
Total 2011
% of
Total 2010
% of
Total 2009
% of
Total
Net revenues $3.439 100.0% $4.201 100.0% $3.908 100.0% $3.343 100.0% $2.779 100.0%
Cost of Goods sold 2.923 85.0% 3.547 84.4% 3.563 91.2% 2.940 88.0% 2.360 84.9%
Gross profit 0.516 15.0% 0.654 15.6% 0.345 8.8% 0.402 12.0% 0.419 15.1%
Sell., Gen., &
Admin. 0.276 8.0% 0.257 6.1% 0.182 4.6% 0.193 5.8% 0.207 7.4%
Restructuring 0.021 0.6% 0.049 1.8%
Source: data in case Exhibit 1
Case 8 Teaching Note Cooper Tire & Rubber Company in 2014
376
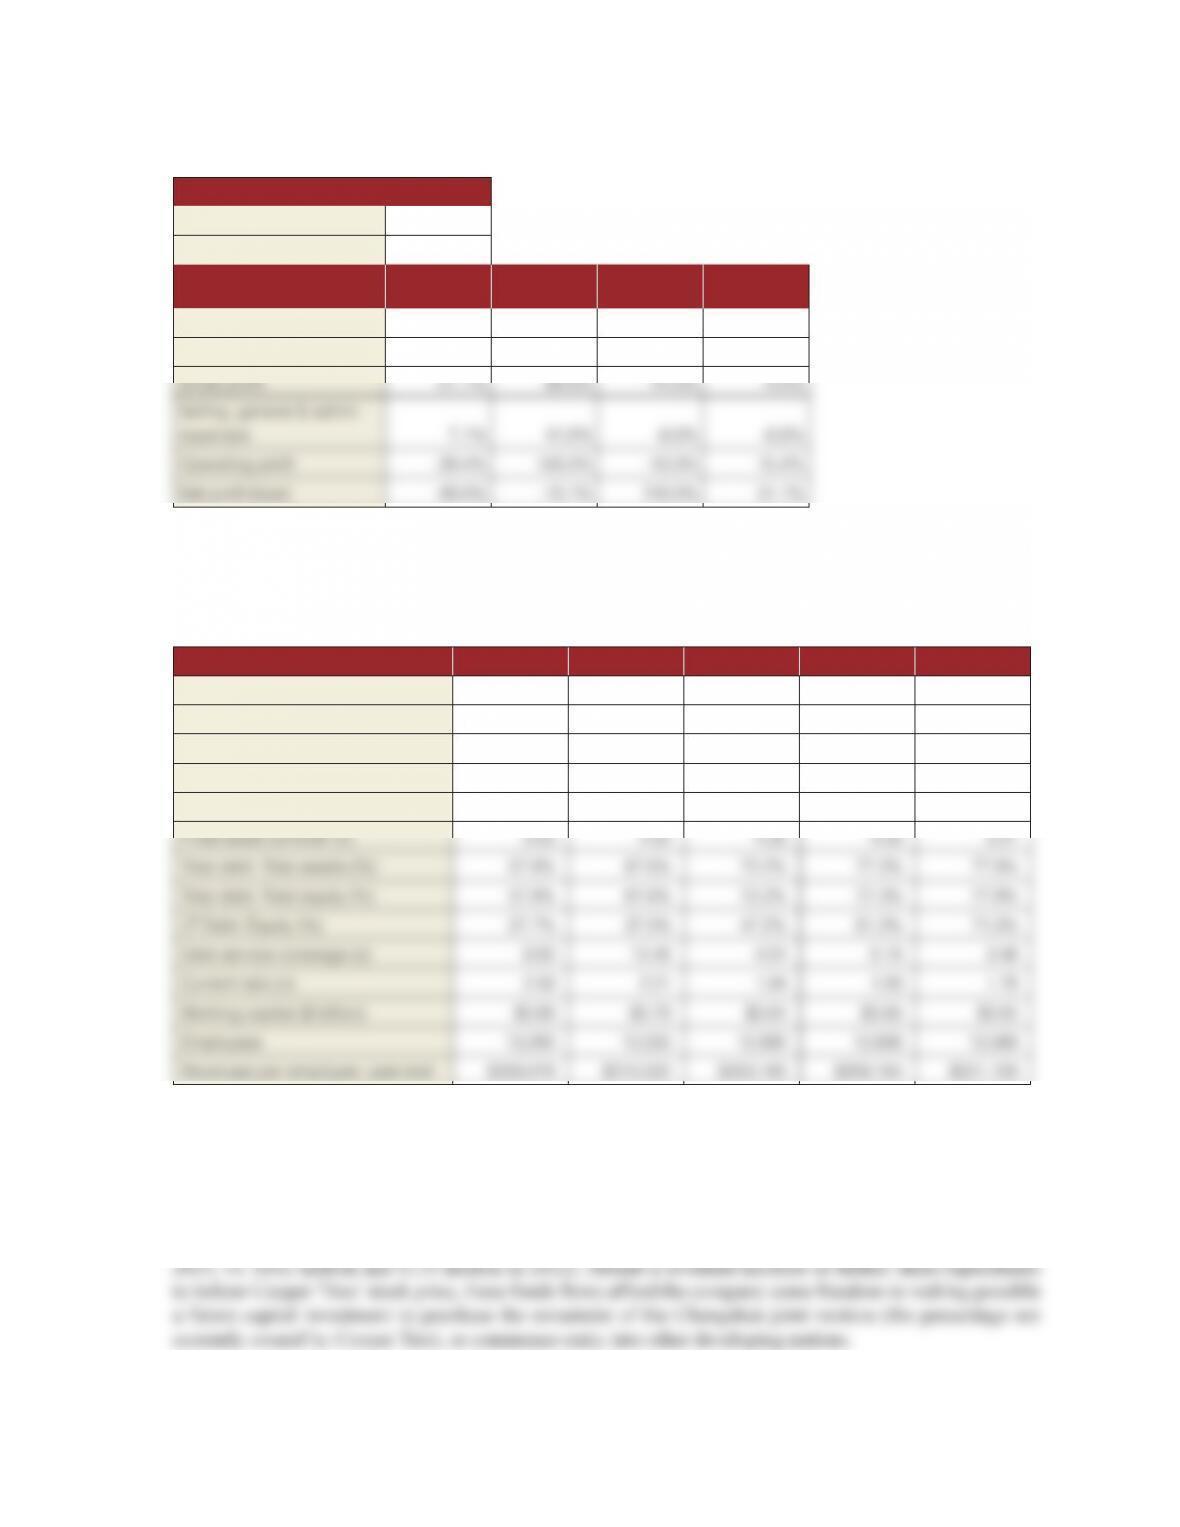
TABLE 6. Growth Rate Analysis for Cooper Tire, & Rubber Co., 2009–2013
4Y CAGR%
Net revenues 36.2%
Net income 36.6%
Year-on-Year Growth, % 2013 2012 2011 2010
Net revenues -18.1% 7.5% 16.9% 20.3%
Cost of Goods sold 83.2% 100.6% 122.4% 126.6%
Source: data in case Exhibit 1
TABLE 7. Financial Ratio Analysis for Cooper Tire & Rubber Co.,
2009–2013
2013 2012 2011 2010 2009
Return on sales, % 3.2% 5.2% 6.5% 3.5% 3.2%
Return on assets, % 4.1% 7.9% 10.1% 5.0% 4.2%
Operating return on assets, % 8.8% 14.2% 6.5% 8.2% 7.8%
Return on equity % 9.6% 24.3% 36.3% 22.2% 19.1%
Total asset turnover (x) 1.26 1.50 1.56 1.45 1.32
Source: data in case Exhibit 1
Advanced or superior students will use data from case Exhibit 1 to perform calculations of Cooper Tire’s
cash ows and free cash ows, which have been steadily improving over the four-year period from 2009
to 2013—see Table 8. Although FY 2013 was not a typical operating year due to the failed merger with
Apollo Tyres, both cash ows and free cash ows are positive ($65 million and $39 million, respectively, in