Case 21 Teaching Note PepsiCo’s Diversification Strategy
566
There’s ample room for judgmental differences regarding selection of the factors, the weights, and the
ratings used to draw a 9-cell GE matrix depicting PepsiCo’s portfolio. Therefore you should expect that
student opinions will vary and the matrices they come up with will vary. In this instance, however, the
variations should not be very great since it is clear that the industries represented in PepsiCo’s portfolio are
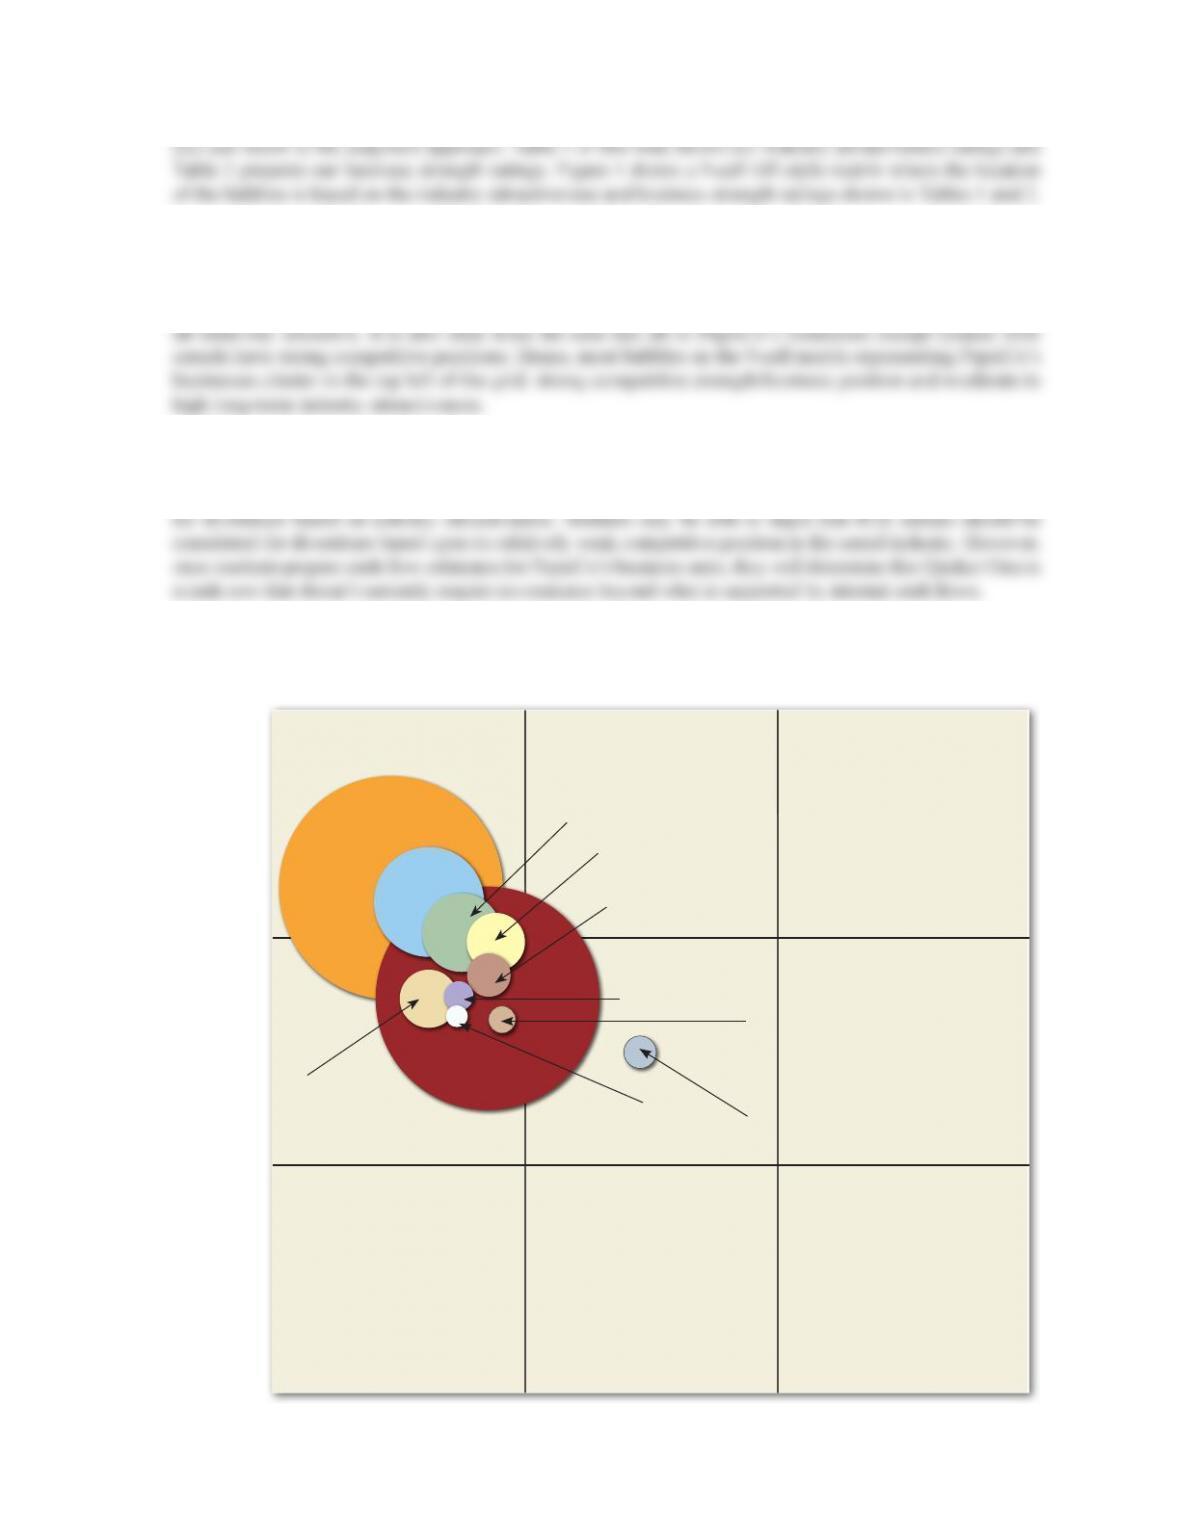
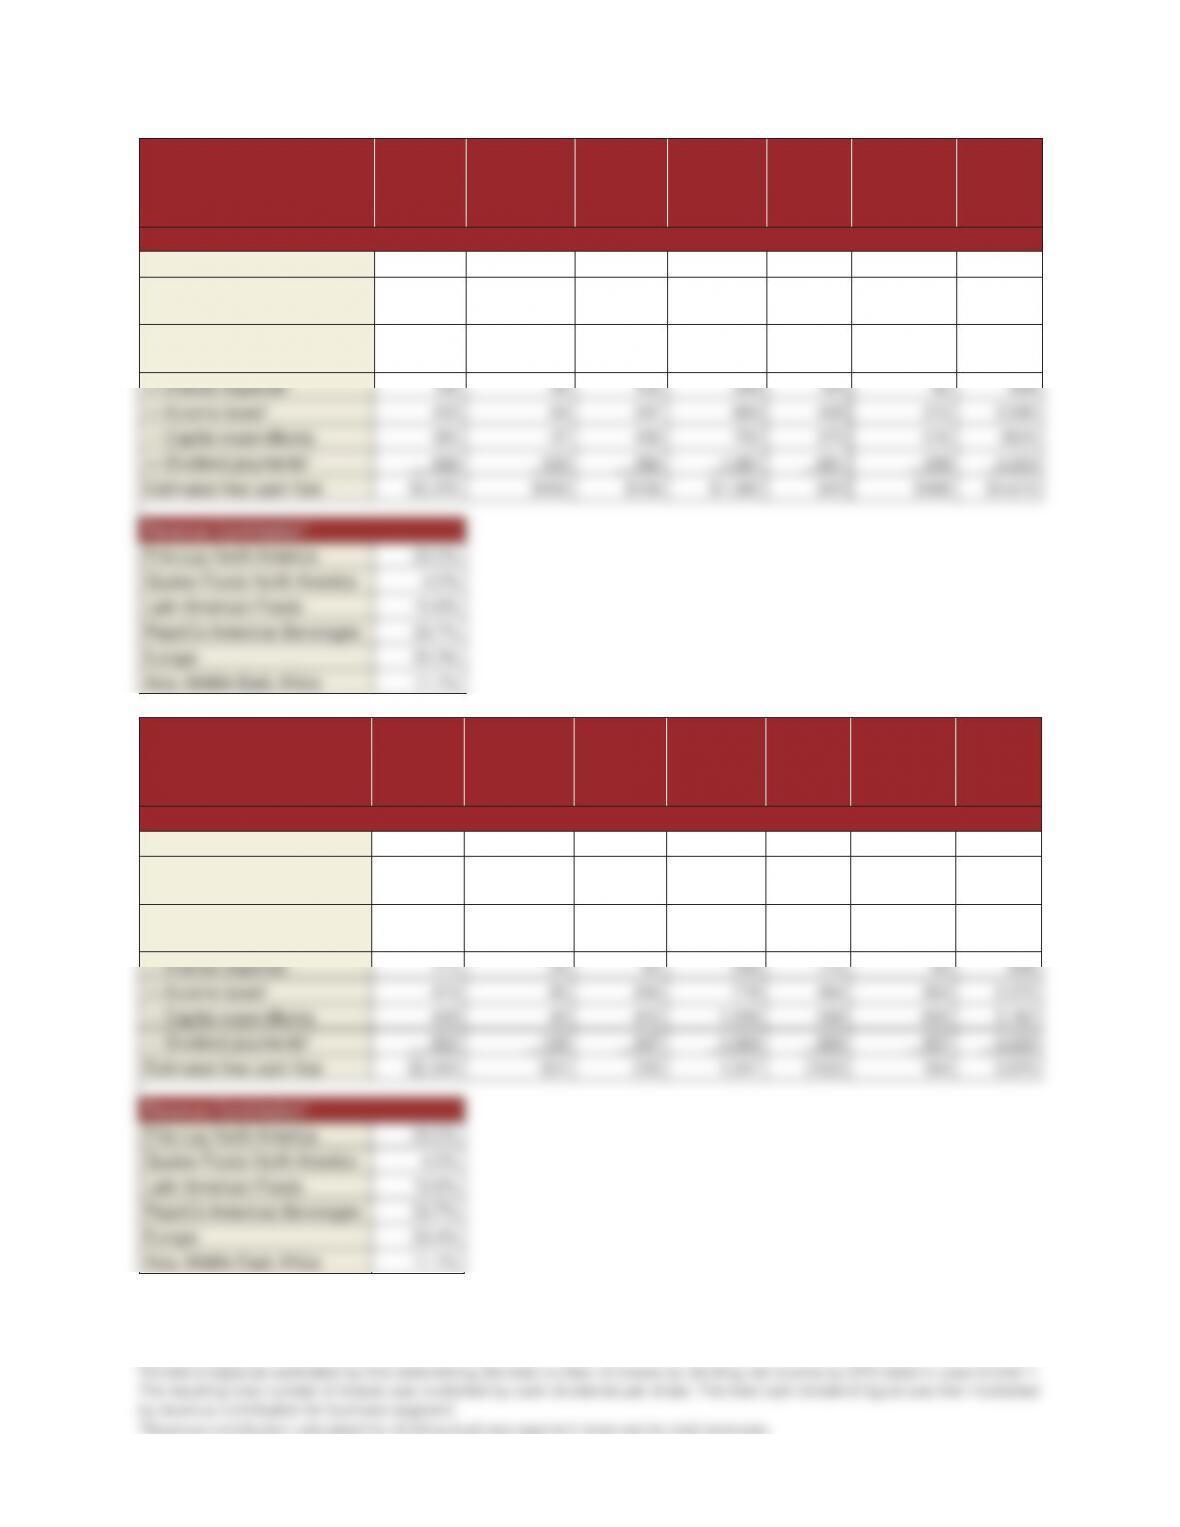
The 9-cell GE-style matrix analysis (Figure 1) indicates that PepsiCo’s portfolio consists chiey of “grow
and build” businesses that should be given a high priority for investment. Students should conclude that RTE
cereals should be given a medium investment priority. None of PepsiCo’s business units need to be considered
FIGURE 1. Assessment of Strategic Fit Potentials Between
PepsiCo’s Business Units
Frito-Lay
Strong Weak
Competitive Strength/Business Position
Long–Term Industry Attractiveness
High
Pepsi-Cola
Gatorade
Aquana
Tropicana/
Dole/SoBe
Lipton/
SoBe Teas
Quaker
Oatmeal
Rice-A-Roni
Starbucks
Frappucino
Quaker Cereal
Aunt Jemima
Medium
Low
6.7
3.3
6.7 3.3
Case 21 Teaching Note PepsiCo’s Diversification Strategy
567
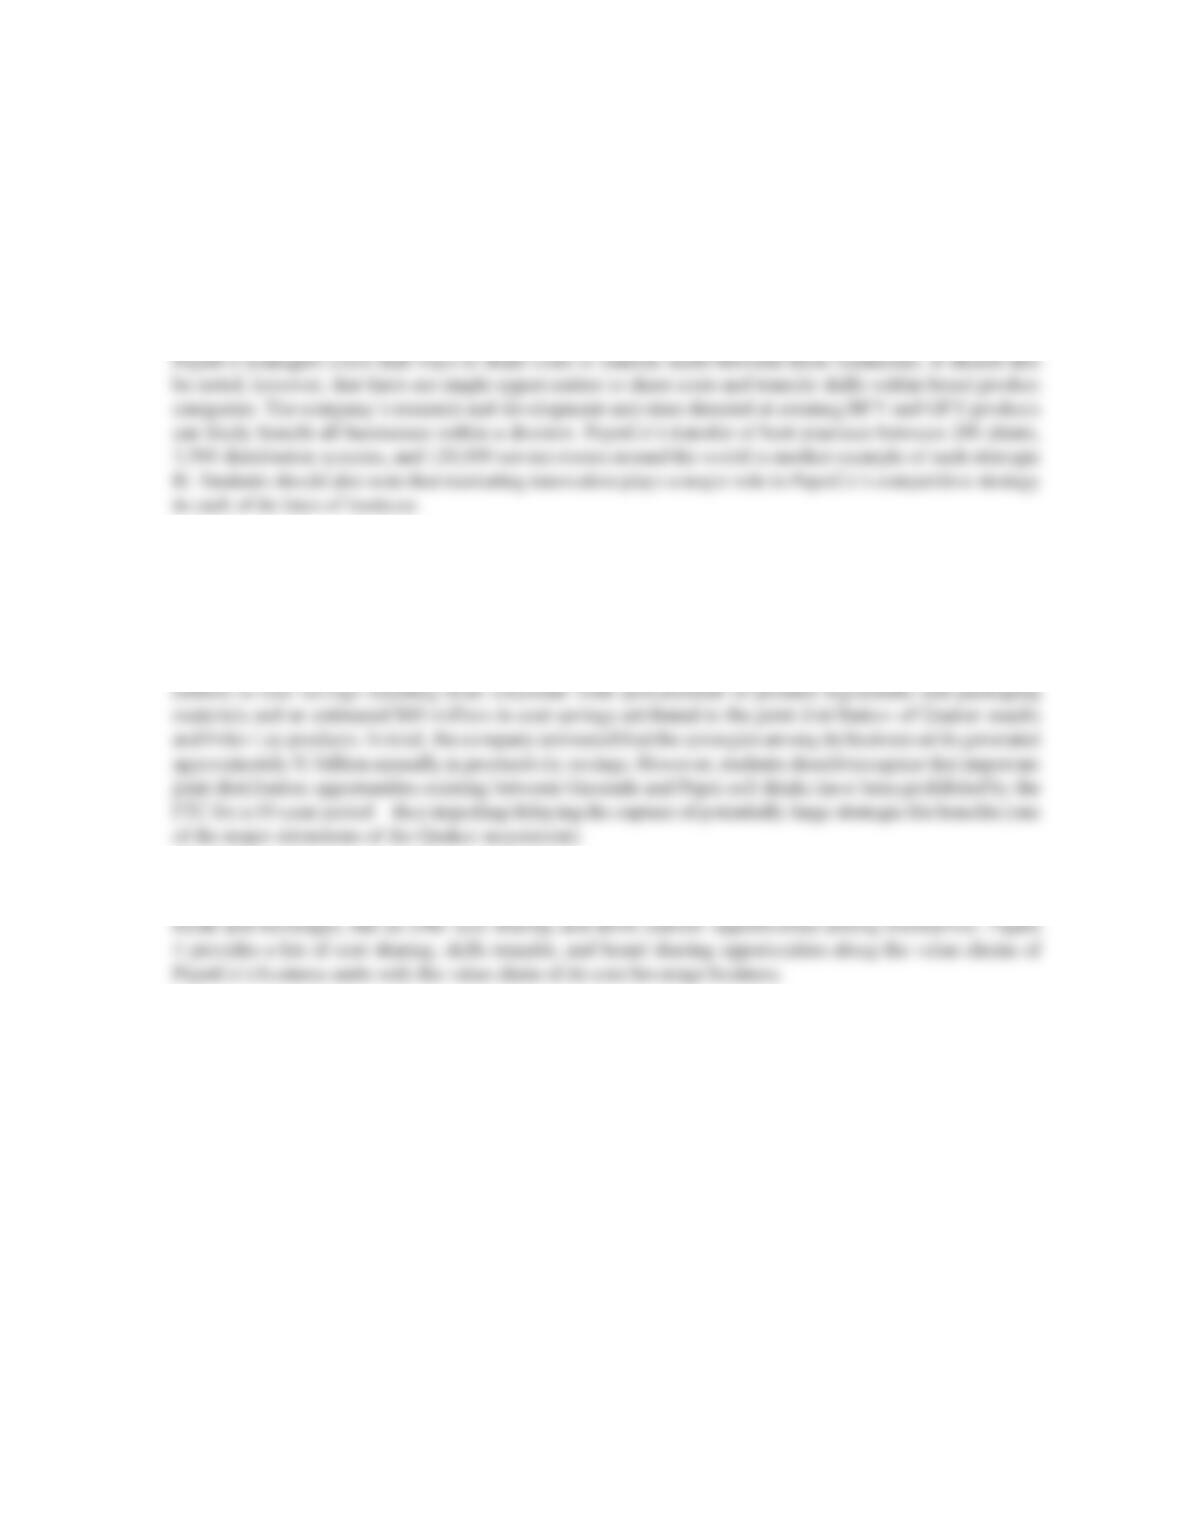
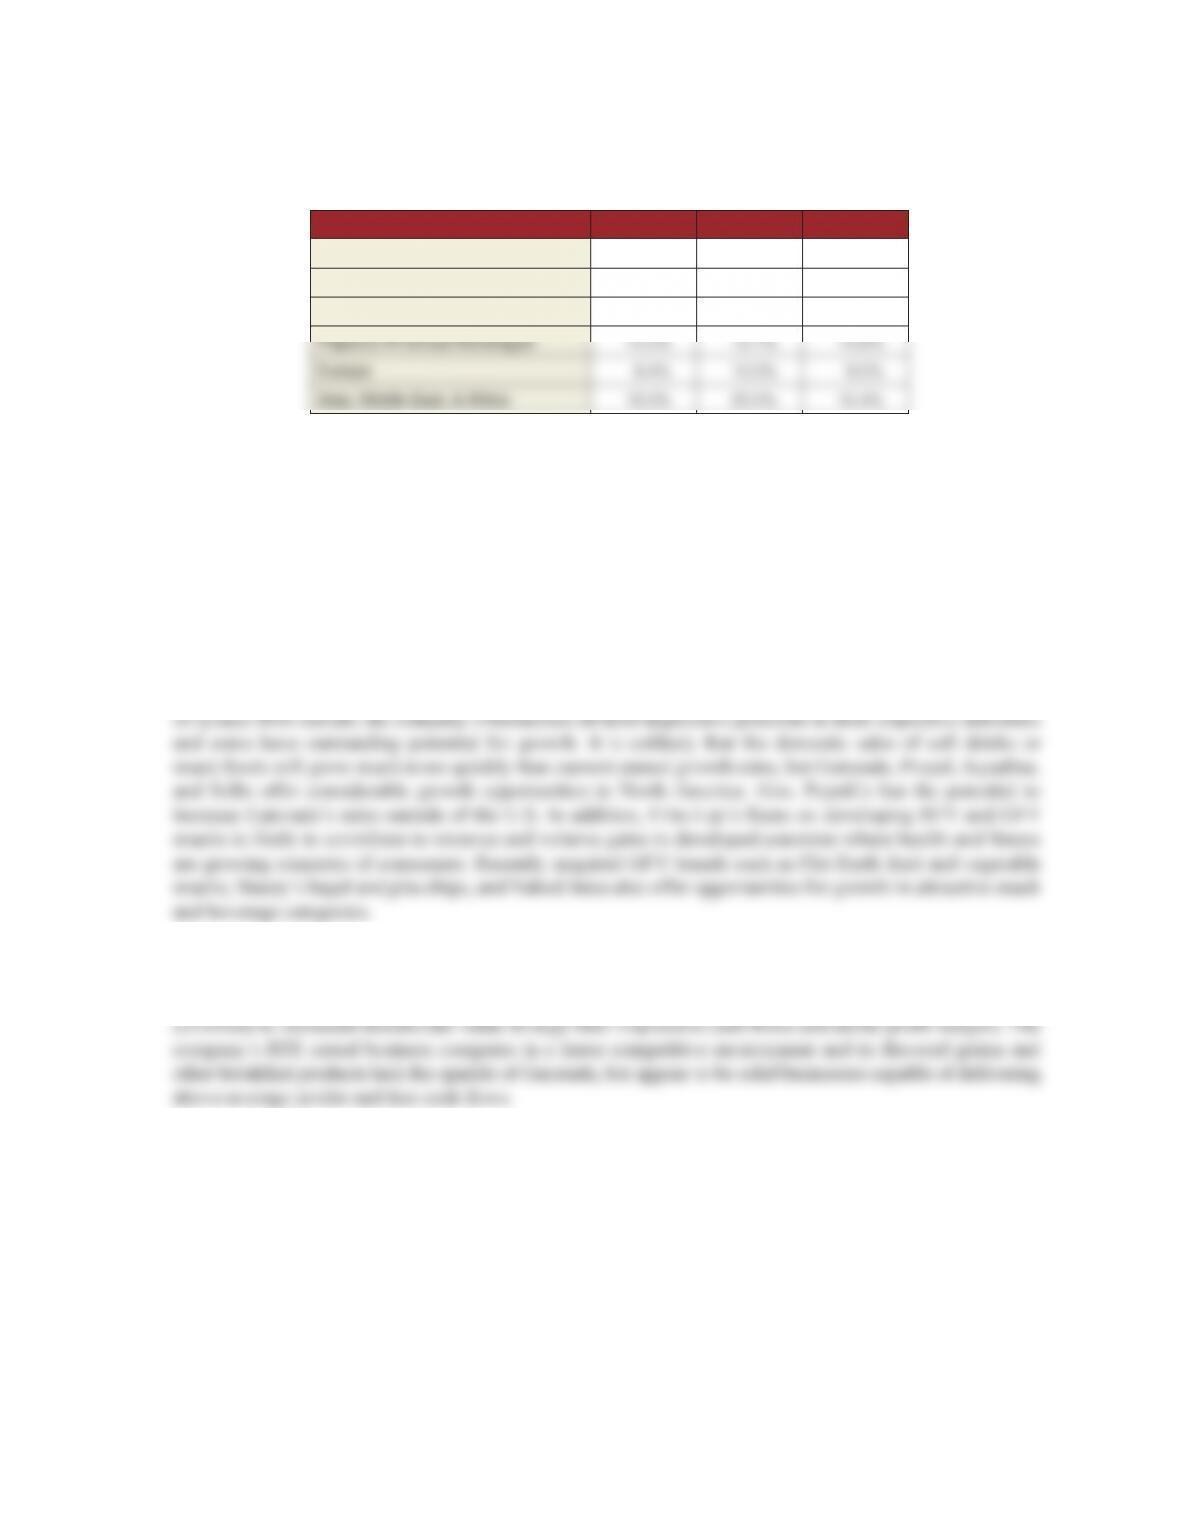
5. Does PepsiCo’s portfolio exhibit good strategic fit? What value-chain match-ups do
you see? What opportunities for skills transfer, cost sharing, or brand sharing do you
see?
Substantial cost sharing and skills transfer opportunities exist between PepsiCo’s beverage brands and
between its various snack brands, but there appear to be less strategic fit opportunities across business
platforms. The operating processes vary greatly between hot fill beverage bottling, soft drink concentrate
production, grain-based food products production, and snack food production. Students may suggest that
beyond PepsiCo’s corporate-wide purchases for ingredients and packaging materials, it is unlikely that
PepsiCo management shares market research and relies heavily on marketing innovations to position their
brands in each market in which it competes. Consumers in each of these markets have much in common
and it should be expected that PepsiCo managers share skills and information in crafting and implementing
the strategies of each of the businesses. Some students may point to the company’s Power of One strategy
that allows its products to be cross-marketed in retail locations as an example of marketing-related strategic
fit. The Quaker Oats integration produced a number of noteworthy strategic fit successes, including $160
The operations, sales and marketing, and advertising/promotion of Quaker’s hot and RTE cereals, avored
grains, and other breakfast products have little in common with value chain activities of PepsiCo’s convenience
Case 21 Teaching Note PepsiCo’s Diversification Strategy
568
FIGURE 2. Assessment of Strategic Fit Potentials Between Pepsico’s
Business Units
CS = cost sharing benefits ST = skills transfer opportunities
Value Chain Activities
Business Unit
Pepsi Cola None None None Cross-selling with Frito-
Lay products/ST with all
convenience products
ST/CS with all
convenience
products
Frito-Lay Some potential
cost sharing
with Quaker
Snacks
None Cost sharing with all
convenience snacks/
ST with convenience
beverages
Cross-selling with Pepsi
products/ST with all
convenience products
ST/CS with all
convenience
products
Tropicana/
Dole/SoBe
Some potential
cost sharing
with hot fill
beverages
Cost sharing
among hot fill
operations
Cost sharing with
all convenience
beverages/ST with
convenience snacks
ST with all convenience
products
ST/CS with all
convenience
products
Aquafina None Cost sharing
among hot fill
operations
Cost sharing with
all convenience
beverages/ST with
convenience snacks
ST with all convenience
products
ST/CS with all
convenience
products
Starbucks
Frappucino
None Cost sharing
among hot fill
operations
Cost sharing with
all convenience
beverages/ST with
convenience snacks
ST with all convenience
products
ST/CS with all
convenience
products
Purchasing Operations Distribution Sales & Marketing Advertising
/Promotion
Case 21 Teaching Note PepsiCo’s Diversification Strategy
569
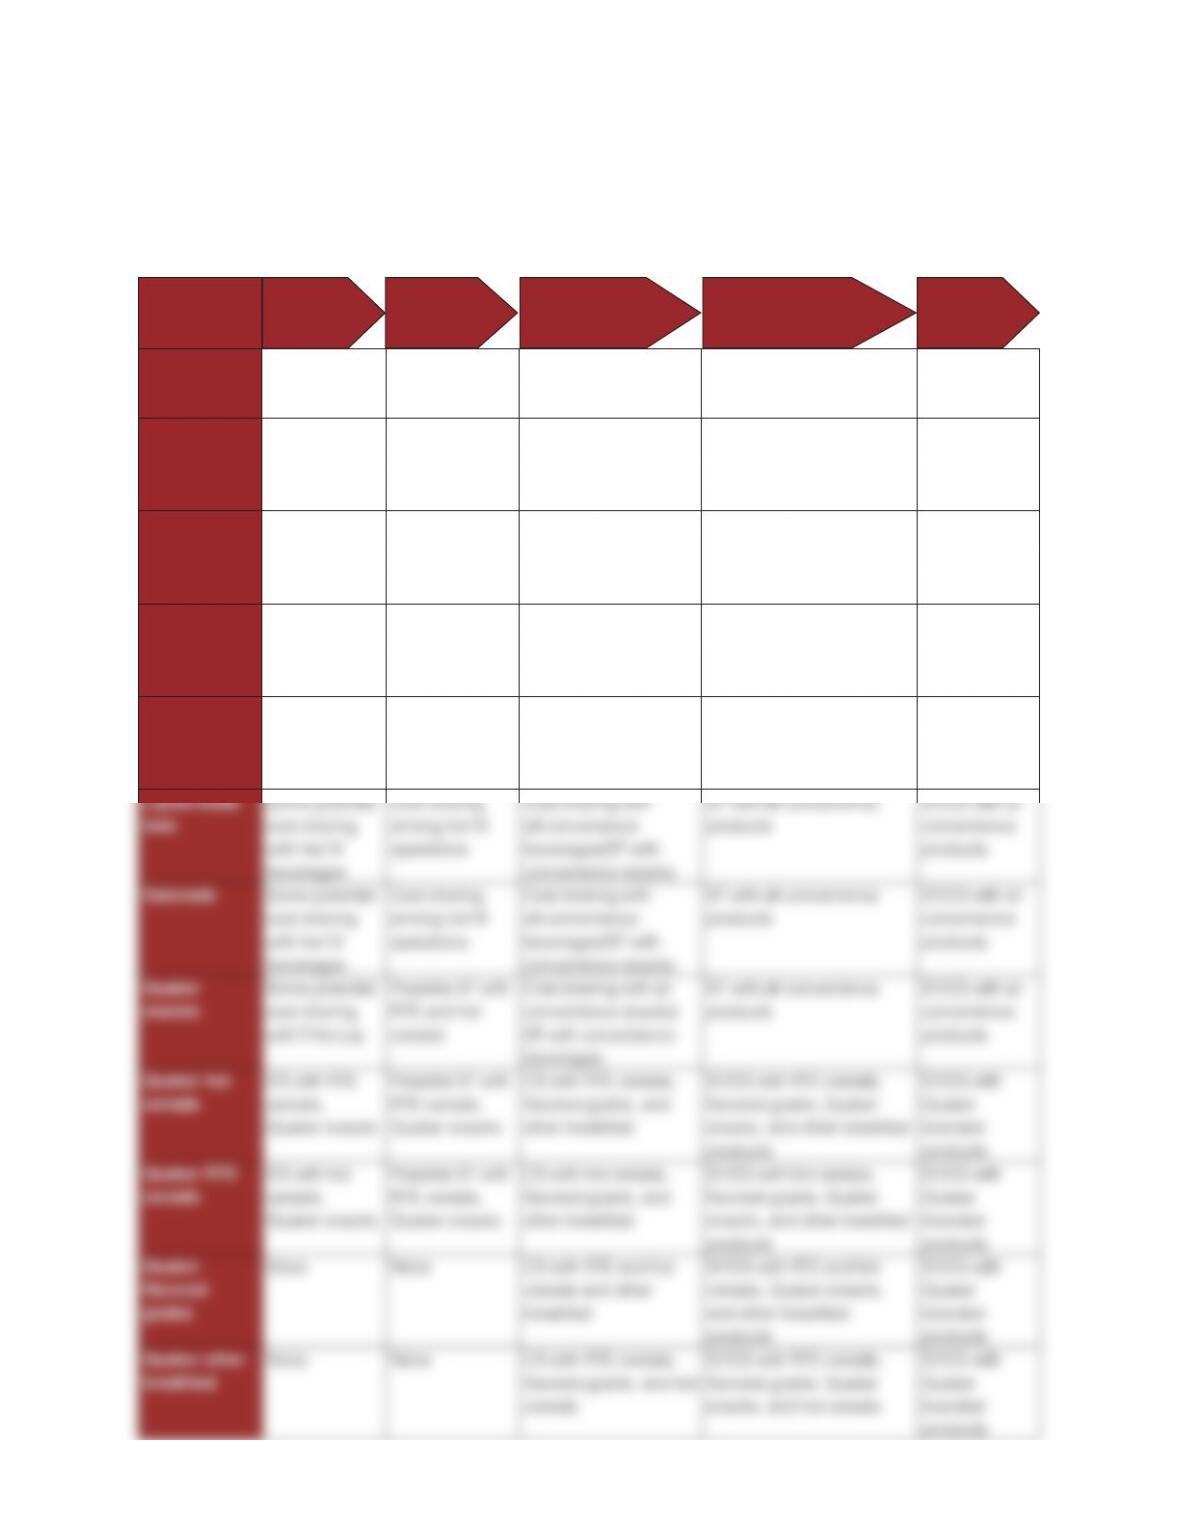
6. Does PepsiCo’s portfolio exhibit good resource fit? What are the cash flow characteristics
of each of PepsiCo’s four segments? Which businesses are the strongest contributors
to PepsiCo’s free cash flows?
Students who have completed the assignment questions posted on the Student Edition of the OLC should
recognize that the portfolio has very good resource fit, with all of the company’s businesses except Europe
offering ample cash ows to fund internal investments. The cash ow estimates in Table 3 indicate that
all business units generated free cash ows each year between 2011 and 2013, except Europe (negative in
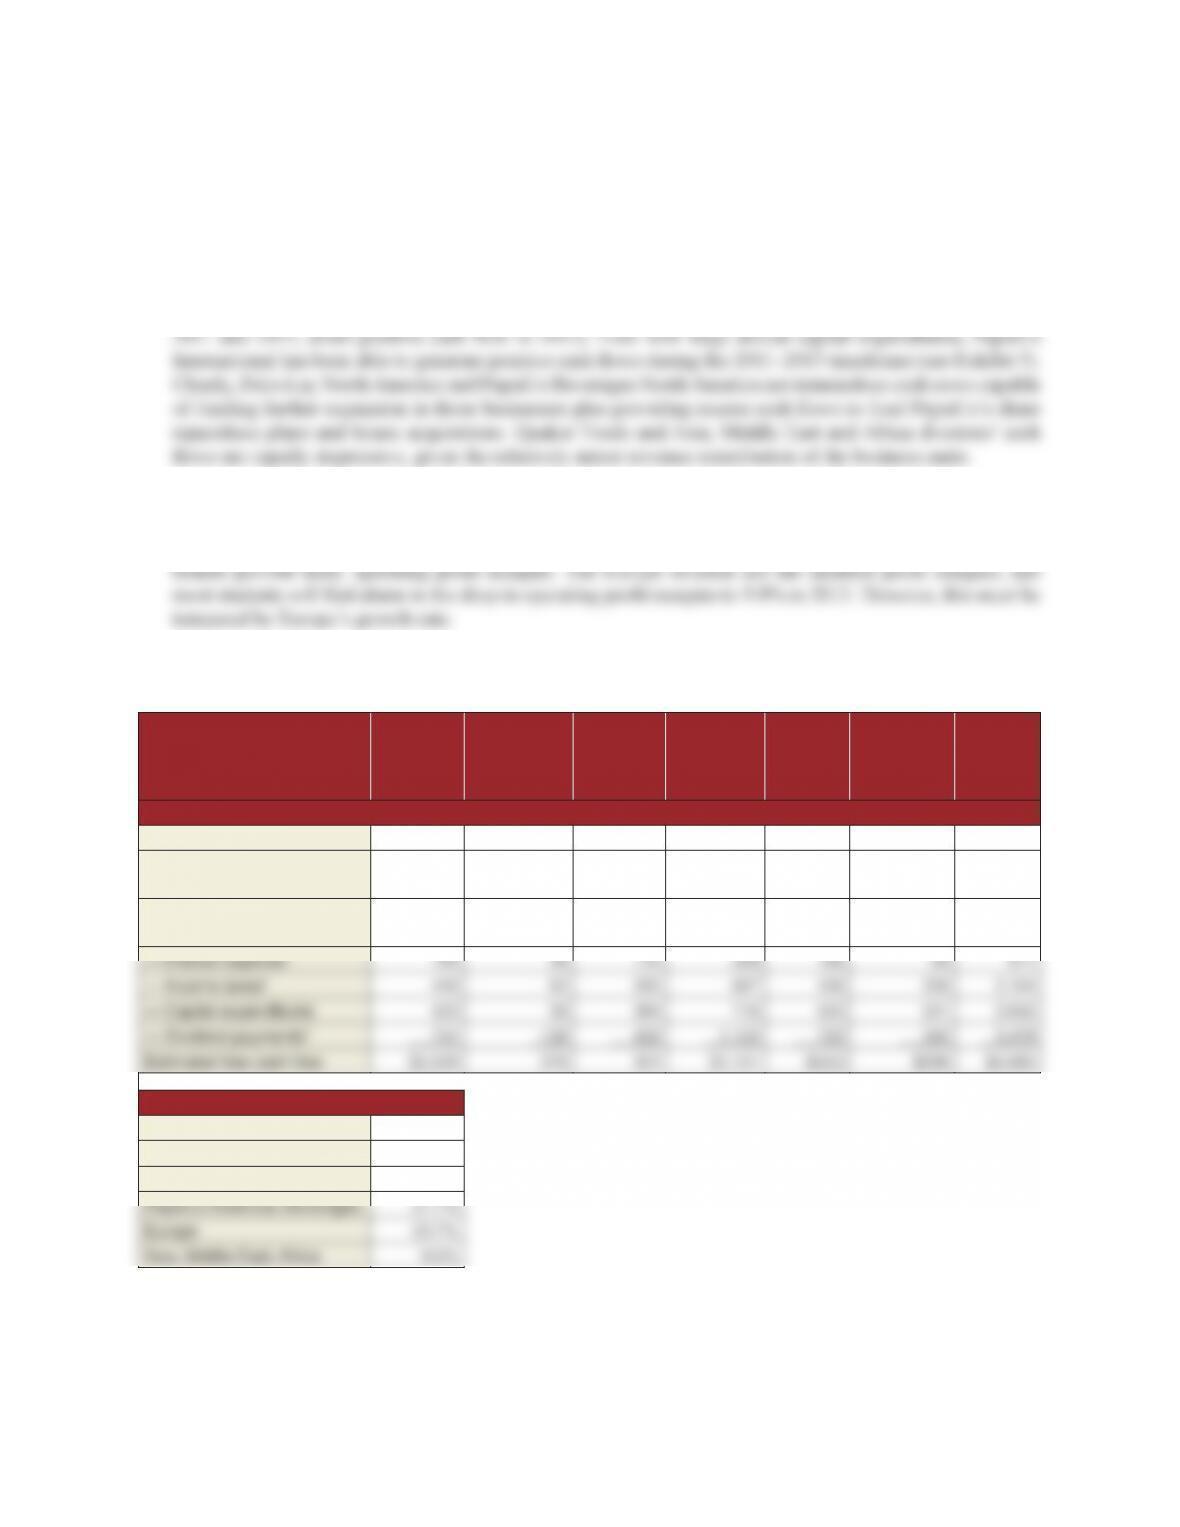
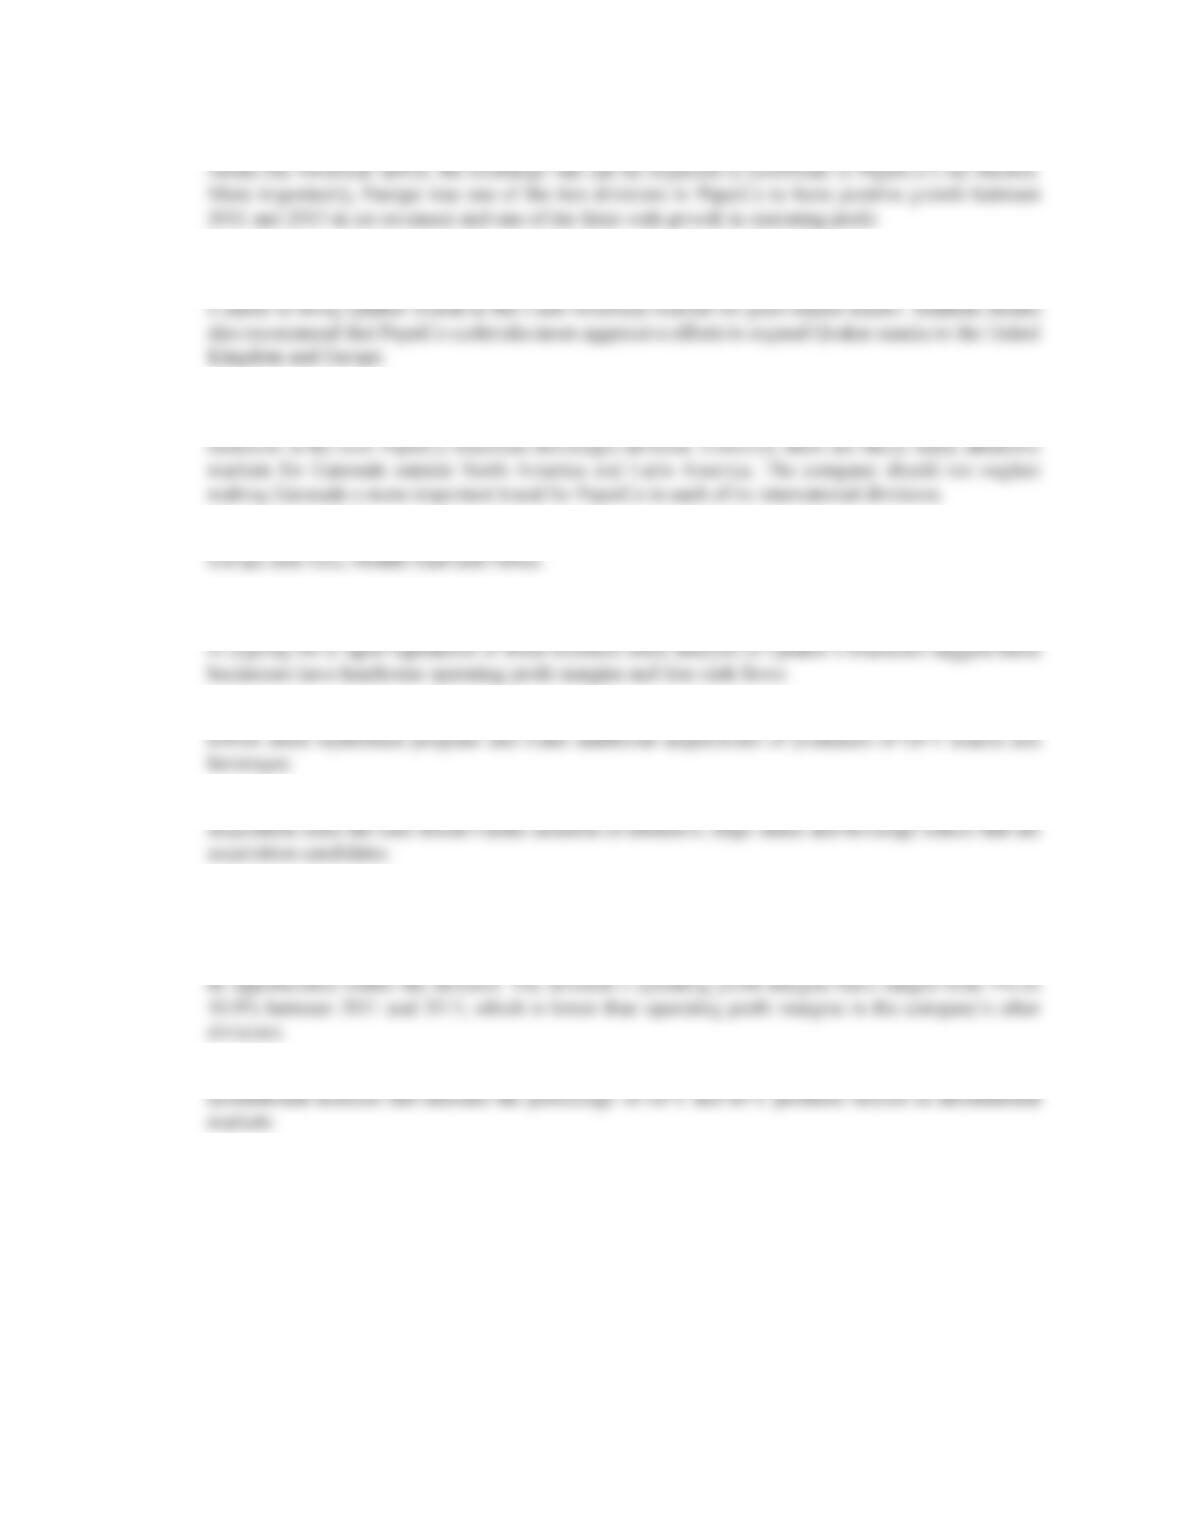
In addition, students should approve of the operating profit margins of the company’s North American
businesses (Frito-Lay North America and Quaker Foods North America) presented in Table 4. Even though
Quaker Oats’ brands compete in mature processed food categories that offer little growth potential, the
TABLE 3. Estimated Cash Flow for Pepsico’s Business Units, 2011–2013
Frito-Lay
North
America
Quaker
Foods
North
America
Latin
American
Foods
PepsiCo
Americas
Beverages Europe
Asia
Middle East
Africa
Total
Division
2013
Operating profit $3,877 $617 $1,242 $2,955 $1,293 $1,174 11,158
+Depreciation/other
amortization 430 51 253 863 525 283 2,553
+Amortization of intangible
assets 7 — 8 58 32 5110
1
Revenue Contribution
4
Frito-Lay North America 21.3%
Quaker Foods North America 3.9%
Latin American Foods 12.6%
Case 21 Teaching Note PepsiCo’s Diversification Strategy
570
Frito-Lay
North
America
Quaker
Foods
North
America
Latin
American
Foods
PepsiCo
Americas
Beverages Europe
Asia
Middle East
Africa
Total
Division
2012
Operating profit $3,646 $695 $1,059 $2,937 $1,330 $1,330 10,414
+Depreciation/other
amortization 445 53 248 855 522 305 2,570
+Amortization of intangible
assets 7 — 10 59 36 7119
1
Frito-Lay
North
America
Quaker
Foods
North
America
Latin
American
Foods
PepsiCo
Americas
Beverages Europe
Asia
Middle East
Africa
Total
Division
2011
Operating profit $3,621 $797 $1,078 $3,273 $1,210 $1,210 $10,866
+Depreciation/other
amortization 458 54 238 865 522 350 2,604
+Amortization of intangible
assets 7 — 10 65 39 12 133
1
1Interest expense estimated by multiplying total interest expense listed in case Exhibit 3 by revenue contribution for business
segment.
2Income tax expense estimated by multiplying total income tax expense listed in case Exhibit 3 by revenue contribution for
business segment.
Case 21 Teaching Note PepsiCo’s Diversification Strategy
571
TABLE 4 Operating Profit Margins by PepsiCo Business Segment,
2011–2013
2013 2012 2011
Frito-Lay North America 27.5% 26.9 27.2
Quaker Foods North America 23.6% 26.4% 30.0%
Latin American Foods 14.9% 13.6% 15.1%
Calculated from case Exhibit 7.
7. Based on the preceding analysis, what is your overall evaluation of PepsiCo’s business
portfolio in 2013? Does the portfolio provide the company’s shareholders with an
opportunity for above-average market returns?
Students will likely commend Roger Enrico, Steve Reinemund, and Indra Nooyi for their efforts as CEO to
build shareholder value. Enrico’s spin-off of the company’s restaurants, IPO of its bottling operations, and
acquisitions of Tropicana, Cracker Jack, and Quaker Oats contributed to more than a 100% increase in the
company’s share price between 1997 and late 2008. Stock price performance has been equally impressive
over the past four years (2011–2014) with an increase of over 50%—see case Exhibit 2. With the exception
There is some question concerning the ability to gain synergistic benefits between some of Quaker’s
food businesses and PepsiCo’s convenience food and beverage businesses, but the cash ow analysis and
operating profit margins presented in Tables 3 and 4 suggest that these businesses do have the ability to
8. What strategic actions should Indra Nooyi take to sustain the corporation’s impressive
financial and market performance? Should its free cash flows be used to fund
additional share repurchase plans, pay higher dividends, make acquisitions, expand
internationally, or for other purposes? What other strategic actions should be pursued
by corporate level management?
Students may struggle with what moves are needed next at PepsiCo, but should be able to recommend most
of the following:
nStudents will likely have mixed opinions about PepsiCo’s international business units. Some will argue
for divestiture of Europe based on its relatively low contribution to corporate profits (9% in 2013).
Case 21 Teaching Note PepsiCo’s Diversification Strategy
572
However, Europe contributes over 20% of PepsiCo’s net revenues and with the weakening of the Euro
nThe company should capitalize on its recent reorganization to further internationalize Quaker Oats’
brands. The new organizational structure creating the PepsiCo Americas Foods division should make
nSimilarly, students should recognize the importance of exploiting PepsiCo’s new organizational structure
to further internationalize Gatorade. Gatorade’s sales outside the United States should benefit from
nStudents are also likely to suggest that PepsiCo push Propel and Aquafina into additional markets in
nStudents may recommend that the company divest its Quaker RTE cereals, avored grains, and other
breakfast products because of low industry growth rates. However, students should not be too forceful
nStudents should suggest that the company should utilize its free cash ows to support the ongoing $15
nThere doesn’t seem to be a strong reason for students to recommend that PepsiCo undertake a major
nStudents will likely recommend that the company continue to develop BFY and GFY snacks and
beverages.
nStudents should also recommend that PepsiCo Europe pursue more aggressive efforts to capture strategic
nPepsiCo International should also make greater use of the company’s Power of One strategy in
Epilogue
In 2014, PepsiCo’s strategies appeared to be performing well. PepsiCo’s top managers expected the company’s
portfolio of snack, beverages, and grocery items to generate cash ows sufficient to reinvest in its core businesses,
provide cash dividends to shareholders, fund a $15 billion share buy-back plan and pursue acquisitions that would
provide attractive returns. However, the relatively low profit margins of the company’s international businesses
dictated continued examination of its strategy and operations to exploit strategic fits among the company’s
international business units.
You can check for the company’s latest financial reports and press releases at its investor web site (www.pepsico.
com).