Unlock document.
This document is partially blurred.
Unlock all pages and 1 million more documents.
Get Access
Case 20 Teaching Note Wal-Mart in Africa
553
Students who have read Chapter 9 carefully will note that socially responsible business behavior can also
help avoid or preempt legal and regulatory actions that could prove costly and otherwise burdensome. In
some instances, it is possible to craft corporate social responsibility strategies that contribute to competitive
Students are likely to debate hotly whether or not Wal-Mart is a socially responsible corporation. As
discussed in the previous question, there have been allegations that Wal-Mart has not consistently provided
good working conditions for its employees. It is unquestionable that Wal-Mart has trumped rivals and put
In any event, Wal-Mart’s shareholders are likely to view its business case for social responsibility as a strong
one. Over time, Wal-Mart’s strategies have resulted in the creation of (mostly entry-level) jobs, provided
immense customer value, led to development and deployment of innovative technologies for logistics and
5. Is the current strategy for Wal-Mart producing good strategic and financial results?
What are some key indicators of performance?
The two best indicators of how well a company’s strategy is working are: (1) whether the company is
achieving its stated financial and strategic objectives and (2) whether the company is an above-average
industry performer. There are neither sufficient financial and operating data in the case nor comparative
n During 2011–12, Wal-Mart’s year-on-year growth in total sales revenues improved slightly from 2010–
11, from 3.4 percent to 6.0 percent
n Wal-Mart’s cost of sales and operating expenses and net income as a percentage of total sales revenues
n As indicated in the case and illustrated by comparing data from case Exhibit 5 with data from case
Exhibit 3, any improvement in Wal-Mart’s financial performance is being driven by its international
operations
• Operating income from its international operations constituted 23.4 percent of consolidated
• Operating income from its international operations segment grew 14.4 percent from 2010–2011
Case 20 Teaching Note Wal-Mart in Africa
554
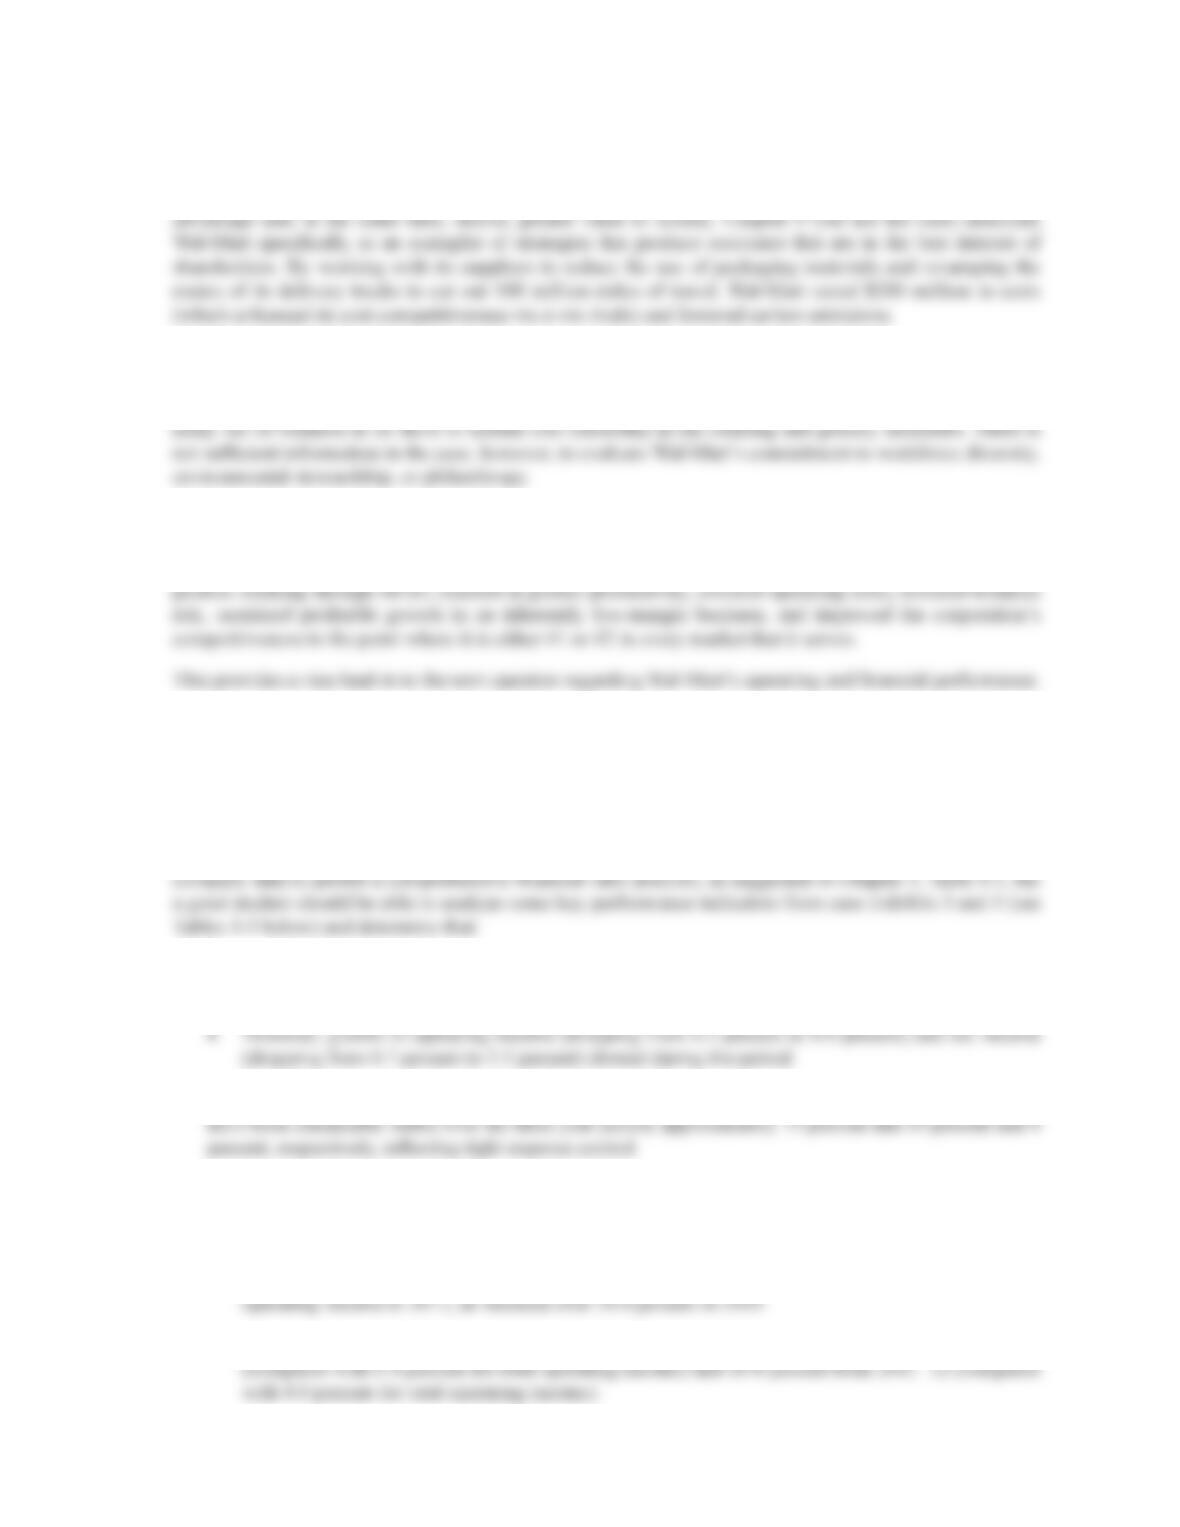
TABLE 1. Common Size Income Statements for Wal-Mart,
FY 2010–2012 ($ billions)
FYE—all amounts in $ billions 2012
% of
Total 2011
% of
Total 2010
% of
Total
Net sales $443.9 99.3% $419.0 99.3% $405.1 99.3%
Membership and other income 3.1 0.7% 2.9 0.7% 3.0 0.7%
Total sales revenues 447.0 100.0% 421.8 100.0% 408.1 100.0%
Cost of sales 335.1 75.5% 314.9 75.2% 304.1 75.1%
Data from case Exhibit 3.
TABLE 2. Year-On-Year Growth Rates for Wal-Mart,
FY 2010–2012: Consolidated
Year-On-Year Growth, % 2012 2011
Net sales 5.9% 3.4%
Membership and other income 6.9% -1.9%
Total sales revenues 6.0% 3.4%
Data from case Exhibit 3.
TABLE 3. Analysis of Operating Income from Wal-Mart’s
International Operations
Operating income from international operations 2012 2011 2010
Operating income from international operations ($ billions) $6.21 $5.61 $4.90
% of total operating income 23.4% 21.9% 20.4%
Data from case Exhibit 5.
Case 20 Teaching Note Wal-Mart in Africa
555
6. Should Wal-Mart adapt its business model to be better suited to local conditions in
Africa? In what ways? What are the pros and cons?
Compared with a joint venture or alliance or establishing a greenfield or brand new operation in Africa,
Wal-Mart’s court-approved purchase of Massmart is the quickest means of hurdling such entry barriers
Buying an ongoing operation allows Wal-Mart to move directly to the task of transferring resources and
personnel to the newly acquired business, redirecting and integrating the activities of the acquired business
Yet there are vast differences in demographic characteristics between developed nations where Wal-
Mart has already entered and the developing African nations it will be entering in combination with
Massmart—See Table 4 below.
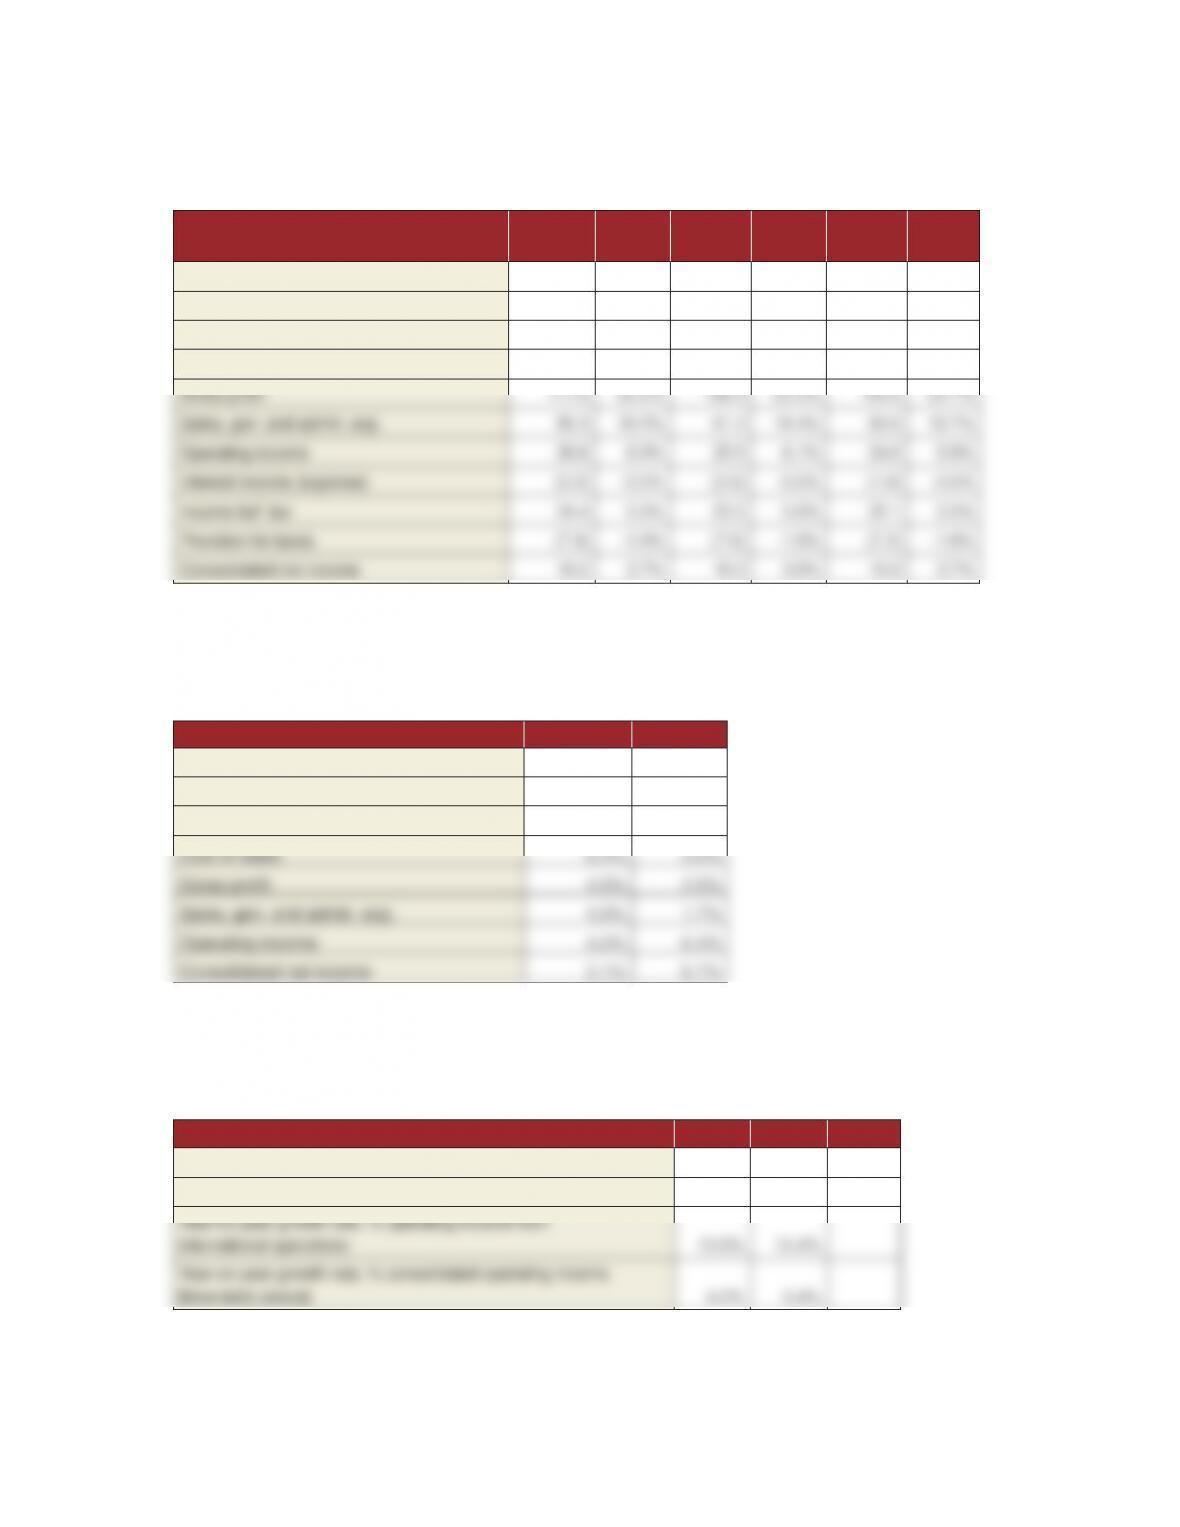
TABLE 4. Socio-Economic Data of Countries Where Combined
Wal-Mart and Massmart Will Operate (ranked by GNI per capita)
Country
GDP (US$
billion)
GDP-Per
Capita
(US$)
GDP-Real
Growth
Rate
GNI-Per
Capita
(US$) Population
Literacy
Rate
Unemployment
Rate
Wal-Mart’s Existing Markets
USA 15,040.0 48,100 1.5% 47,310 313,847,465 99.0% 9.0%
Canada 1,389.0 40,300 2.2% 38,370 34,300,083 99.0% 7.5%
Wal-Mart—Massmart’s Planned African Markets
Mauritius 19.3 15,000 4.2% 13,980 1,313,095 84.4% 7.8%
Botswana 30.1 16,300 6.2% 13,700 2,098,018 81.2% 7.5%
South Africa 554.6 11,000 3.4% 10,360 48,810,427 86.4% 24.9%
Namibia 15.5 7,300 3.6% 6,420 2,165,828 85.0% 51.2%
Nigeria 414.5 2,600 6.9% 2,240 170,123,710 68.0% 21.0%
Source: data in case Exhibits 4 and 8
N/A indicates Not Available
Case 20 Teaching Note Wal-Mart in Africa
556
With the caveat that these compilations of country data are merely snapshots in time and do not necessarily
reflect longitudinal trends, good students should observe that:
n African nations are quite diverse in terms of literacy rates, GNI, growth rates, and size. To view Africa
as a monolithic market based on demographics, not even taking into account historical, political,
n In those countries where Wal-Mart currently operates or plans to compete, there appears to be a
correlation between literacy rates, GNI or Gross National Income per capita (and GDP per capita as
n African nations with two exceptions—Mauritius and Botswana—have higher unemployment rates than
n With the exception of South Africa, the four African nations with the highest GNI per capita consist of
n In terms of population size, only four African nations are somewhat close in size to Wal-Mart’s prior
n Growth rates of the African nations’ economies are 2x-4x faster than those of the developed nations in
Summarizing Local Conditions in Africa
n The market potential of many individual African countries is diverse and Africa is not a monolithic
market (and it would be a serious mistake to view it as such)
n Rampant poverty and low income levels would make operations in some African countries simply
unviable for Wal-Mart
Should Wal-Mart’s Business Model Adapt to Local Conditions in Africa?
To succeed in developing nations such as in Africa, according to Chapter 7, Wal-Mart’s options are to:
(1) Compete on the basis of low price:
Pros: Logical fit with existing business model and low income demographics of most if not all African
states.
Cons: This may or may not be possible given powerful labor unions in South Africa, Kenya, and
Case 20 Teaching Note Wal-Mart in Africa
557
(2) Modify aspects of the company’s business model to accommodate local circumstances:
Pros: Wal-Mart mandated to conduct a study to determine the best possible way to safeguard the
Cons: Wal-Mart historically anti-union, and despite claim that Wal-Mart’s aim is not to change
(3) Try to change the local market to better match the way the company does business
Pros: Hoped-for outcome of mandated use of 100 million rand from Wal-Mart to involve local
Cons: It was not yet clear if the combination with Massmart, Africa’s #2 retailer which operated 188
stores in South Africa and 22 other stores in 11 other African nations, provided sufficient market
(4) Stay away from certain developing national markets within Africa until conditions for entry are
better suited to its business model and strategy business elsewhere.
Pros: Most analysts are advising Wal-Mart to do this as it confronts the realities of political instability,
Cons: Massmart which consists of 9 branded chains and 4 operating divisions already pressing ahead
with plans to open 40 new stores/year in South Africa, Nigeria, Malawi, and Zambia and also
looking at opportunities in Senegal, Cameroon, and Angola. Also, national governments may try
Profitability is unlikely to come quickly or easily for Wal-Mart/Massmart in all developing nations within
Africa, however, because of the investments needed to alter buying habits and tastes, disparities in per capita
7. How would you advise the company to proceed with implementing its entry into Africa?
We believe that Wal-Mart must recognize that a business seeing international expansion sometimes must
adapt its model to local conditions [Option #2 above],—which often might not be possible or desirable. The
In developing regions such as Africa, building a local market for a Wal-Mart’s brand of retail products is
likely to turn into a long-term process, involving:

Case 20 Teaching Note Wal-Mart in Africa
558
Epilogue
Wal-Mart hoped to drive comparable-store sales by focusing on local market share positions as it continued
the expansion of its supercenter format and accelerated the expansion of its smaller format stores, in particular
Neighborhood Markets. Square footage growth rates of about 2% annually over the last several years were below
longer-term historical high single-digit rates as the company focused on maximizing returns on invested capital
rather than store expansion. In October 2013, Wal-Mart indicated that it would further accelerate the expansion
of its smaller format stores, consistent with a strategy that was initially discussed a year earlier. Domestic square
footage growth was forecast to increase about 3.0% in FY 15, in line with the 2.9% growth experienced in FY 14.
Acquisitions and joint ventures were fueling international growth. In November 2010, Wal-Mart agreed to
purchase 51% of Massmart, a wholesale and retail operator of about 300 units mostly in South Africa, for about
$2.3 billion, with the acquisition completed in June 2012.
On the other hand, Wal-Mart began slowing the rate of growth in its International business as it closed some
unprofitable stores in certain markets and attempted to improve operations at its existing store base. As such,
international square footage growth was planned for about 4.0% in FY 15. Growth in FY 15 was expected to be
higher than the 3.6% growth rate experienced in FY 14, but down significantly from growth of 6.0% in FY 13
and 15% in FY 12, the latter reflecting acquisitions in Africa and the U.K. As a result of more moderate overall
square footage growth plans (3.0% in FY 15), the company was expected to generate excess cash flow that can
be used for share repurchases, increased dividends, and international acquisitions.
In December 2011, the company disclosed in an SEC filing that it had begun conducting a voluntary internal
review of its policies, procedures and internal controls pertaining to its global anti-corruption compliance
program. Specifically, it indicated it was investigating whether certain matters, including permitting, licensing
and inspections, were in compliance with the U.S. Foreign Corrupt Practices Act.
In April 2012, an unconfirmed article in the New York Times stated that this investigation was related to alleged
improper payments in 2005 and prior to local officials in Mexico in exchange for faster permitting of store sites.
The article also suggested that senior management at the time participated in covering up the payments. The
investigation is said to be ongoing at this time. In FY 14, Wal-Mart incurred $282 million of professional fees
and expenses related to the investigation.
The company experienced a five-year compound annual growth rate (CAGR) in EPS of 7.6% through FY 14,
reflecting moderate sales growth, lower share counts and flat operating (EBITDA) margins. During that period,
sales rose at a CAGR of 3.3% while operating margins declined remained 5.6%.
On July 25, 2014 Wal-Mart announced that Greg Foran had been promoted to President and CEO of Wal-Mart
U.S. Foran succeeded Bill Simon who had been in the role since June 2010, and who will be transitioning out
of the company. Foran assumed his responsibilities on August 9 and reports directly to Wal-Mart President and
CEO, Doug McMillon. Simon will be available on a consulting basis for the next six months to ensure a seamless
transition. Prior to Wal-Mart, Foran held a number of roles with Woolworths, the leading retailer in Australia
and New Zealand.
Case 20 Teaching Note Wal-Mart in Africa
559
A financial summary for Wal-Mart for fiscal 2012 through fiscal 2014 is presented in Table 5.
TABLE 5. Financial Summary of Wal-Mart, Fiscal 2012–2014 ($ millions)
FYE 1/31/14 % of revenue FYE 1/31/13 % of revenue FYE 1/31/12 % of revenue
Revenue $476,294 100.0% $476,294 100.0% $446,950 100.0%
Operating Inc. 35,742 7.5% 36,302 7.6% 34,688 7.8%
Depreciation 8,870 1.9% 8,501 1.8% 8,130 1.8%
Interest Exp. 2,335 0.5% 2,251 0.5% 2,322 0.5%
Pretax Inc. 24,656 5.2% 25,737 5.4% 24,398 5.5%
Tax Rate 32.90% 31.00% 32.60%
Net Income 15,878 3.3% 16,999 3.6% 15,766 3.5%
EPS $4.85 $5.02 $4.54


