Case 19 Teaching Note Deere & Company in 2014
538
n Which overseas markets to enter,
Students should be directed to carefully review Figure 7.2:
n An international/global strategy is a strategy for competing in two or more countries simultaneously.
n A transnational strategy (sometimes called “glocalization”) incorporates elements of both a globalized
and a localized approach to strategy making.
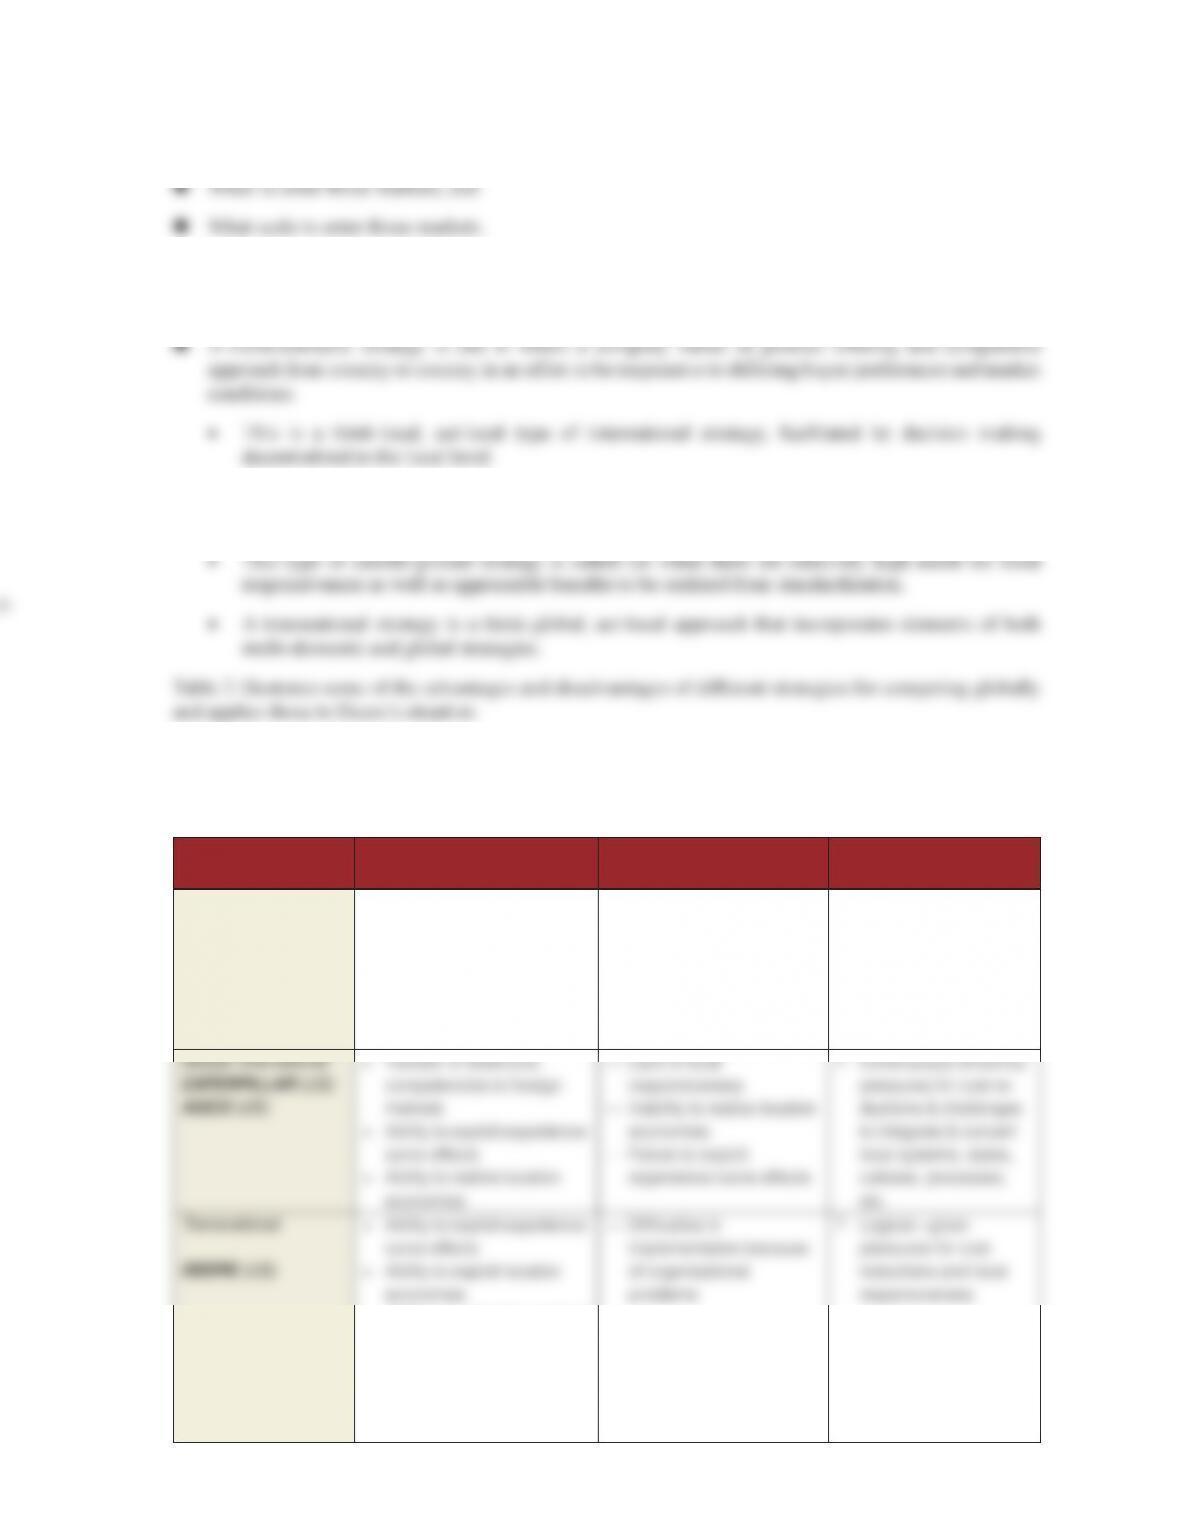
TABLE 2. Globalization Strategies of Key Rivals in Agriculture &
Construction Equipment
Strategy/
Company (HQ)
Potential
Advantages
Potential
Disadvantages
Challenges
for rival
Multi-domestic
CNH Industrial, (UK)
+ Ability to customize product
offerings and marketing
in accordance with local
responsiveness
— Inability to realize location
economies
— Failure to exploit
experience-curve effects
— Failure to transfer
distinctive competencies
to foreign markets
? JV and alliances meet
needs for localization in
emerging markets but
do not address need
for cost reductions
+ Ability to customize product
offerings and marketing
in accordance with local
responsiveness
+ Ability to reap benefits of
local learning
Case 19 Teaching Note Deere & Company in 2014
539
Superior students should weigh the advantages and disadvantages of various strategies (international/global,
multi-domestic, and transnational) for competing globally, and apply those to Deere vs. its key rivals in the
top tier of the agricultural and construction equipment industry, Caterpillar, AGCO, and CNH Industrial.
The appropriateness of those strategies varies from industry to industry, depending upon the extent of pressures
for cost reductions and local responsiveness. International and global strategies tend to be least appropriate
Students should be reminded that building an organization capable of supporting a transnational strategy is a
complex and challenging task: implementation problems are often associated with creating the requisite organi–
At this point in the discussion, instructors should ask students about Deere’s recent financial performance
in order to evaluate Deere’s efficacy in implementing a transnational strategy in the global market for
4. Is Deere’s business strategy producing good financial results? Use the financial ratios
in Table 4.1 in the text as a guide.
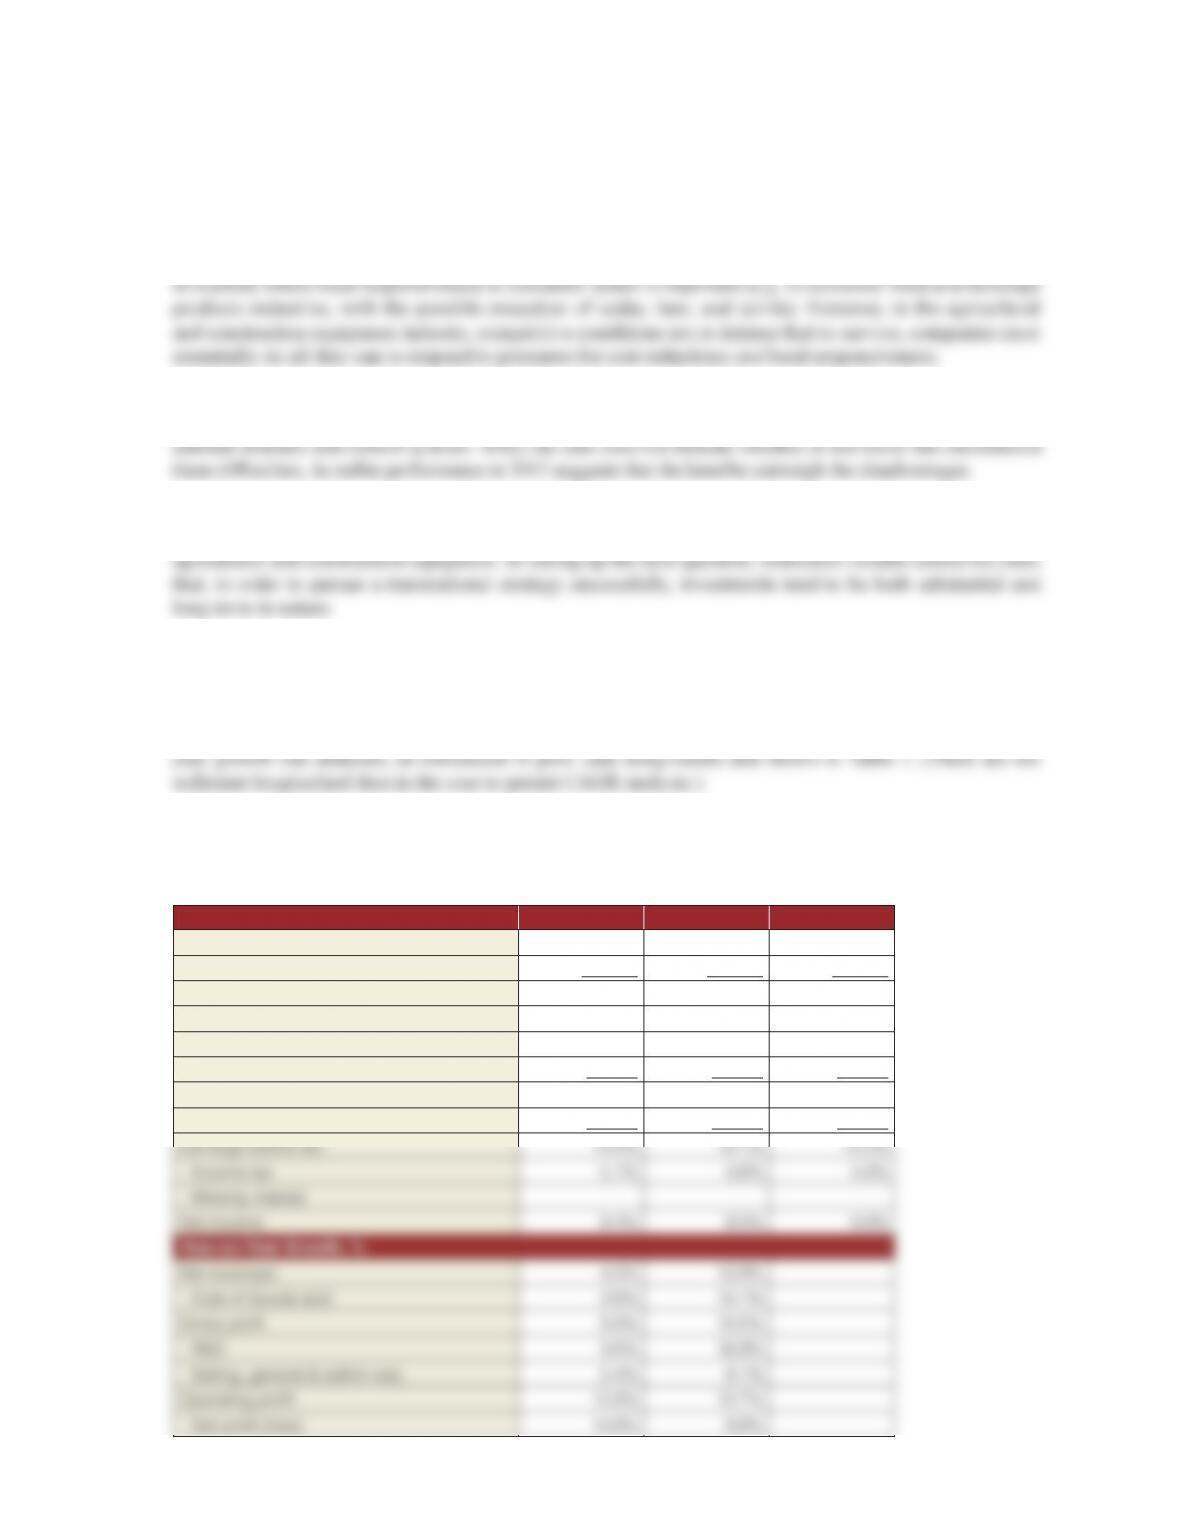
For starters, it may help students to observe basic relationships using common size statement and year-on-
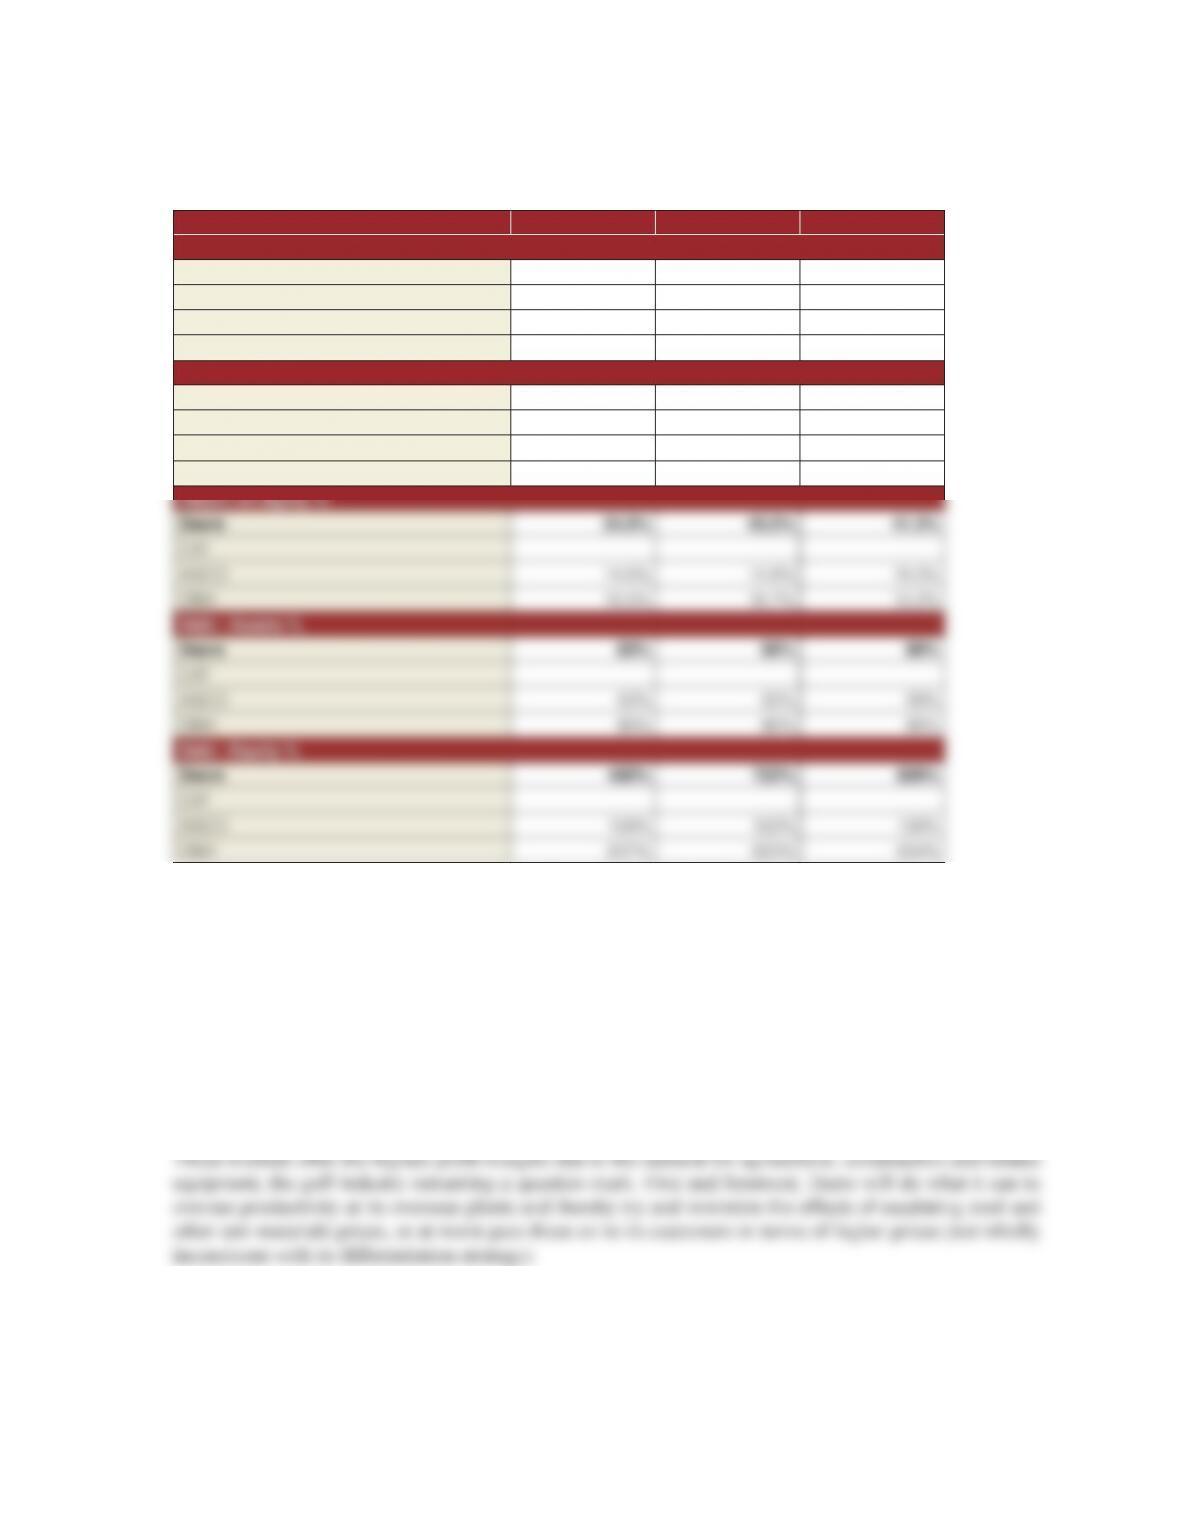
TABLE 3. Common Size Income Statement Analysis for Deere & Co.,
FY 2011–2013
2013 2012 2011
Total Revenue 100.0% 100.0% 100.0%
Cost of Revenue 67.9% 69.2% 68.5%
Gross Profit 32.1% 30.8% 31.5%
Operating expenses
R & D 3.9% 4.0% 3.8%
Selling, general & admin exp. 11.7% 11.6% 12.1%
Operating income (loss)/EBIT 16.5% 15.3% 15.6%
Interest expense 2.0% 2.2% 2.4%
NOTE: Based on data in Case Exhibit 1.
Case 19 Teaching Note Deere & Company in 2014
540
Students should observe that:
n Cost reductions appear to be paying off for Deere—cost of revenue has declined from 68.5% in 2011 to
67.9% in 2013, boosting Gross Margins
n R&D spend continued to grow in FY 2013, and remains at about 3.9%–4.0% of revenues, reflecting the
firm’s commitment to innovation
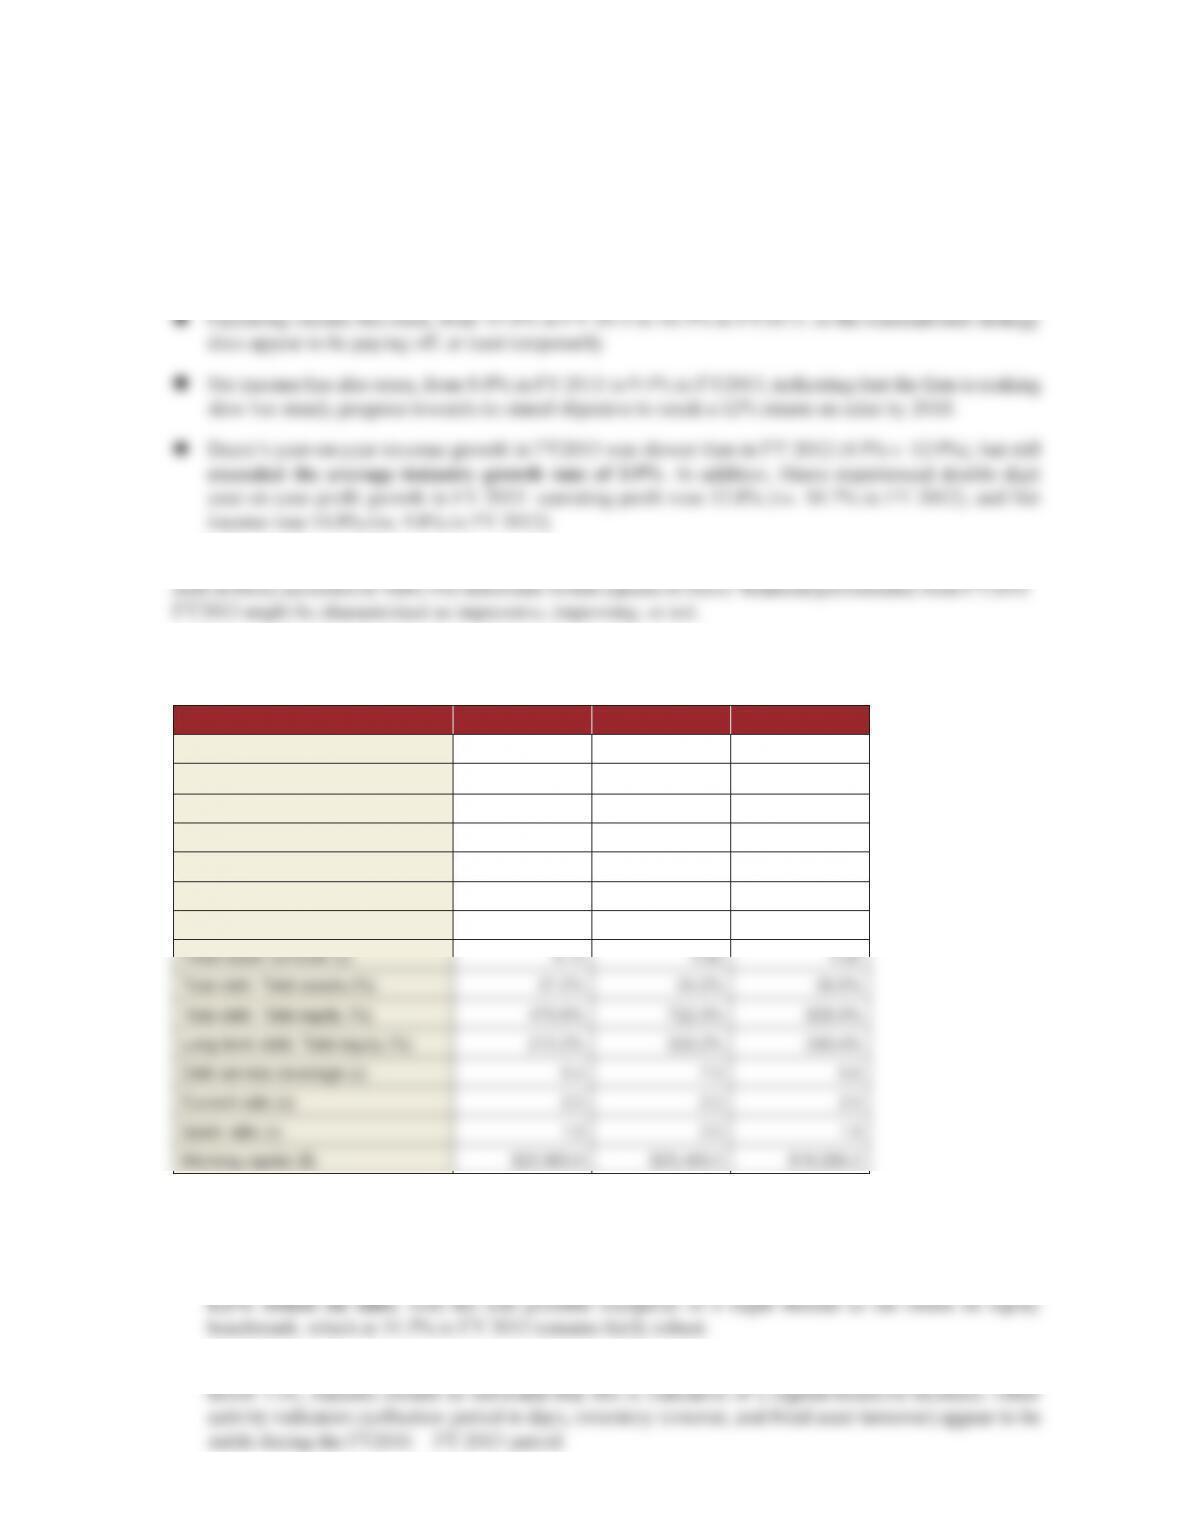
You should also expect students to use the financial ratios in Table 4.1 of Chapter 4 in performing calculations
TABLE 4. Financial Ratios for Deere & Co., FY 2011–2013
2013 2012 2011
Return on sales, % 9.4% 8.5% 8.8%
Return on assets, % 5.9% 5.5% 5.8%
Operating return on assets, % 10.5% 9.8% 10.3%
Return on equity % 34.5% 45.0% 41.3%
Total asset turnover (x) 0.63 0.64 0.66
COGS/Inventory (x) 5.20 4.84 5.02
Collection period, days 338 317 314
NOTE: Based on data in Case Exhibits 1 and 2.
From the ratio analysis, students should be able to determine that:
n Profitability indicators reflect improvement across-the board, exceeding the industry benchmark of
n Total asset turnover (Total revenues/Total assets) remains stable at about 0.6X—and even though it is
Case 19 Teaching Note Deere & Company in 2014
541
n Debt leverage appears to improving, and the company has ample debt service coverage and working
n On balance, Deere appears to be financially healthy and making good progress towards achieving its
5. How do Deere’s financial results measure up to those of its direct rivals—Caterpillar,
AGCO, and CNH—in the top tier of the agricultural and construction equipment
industry?
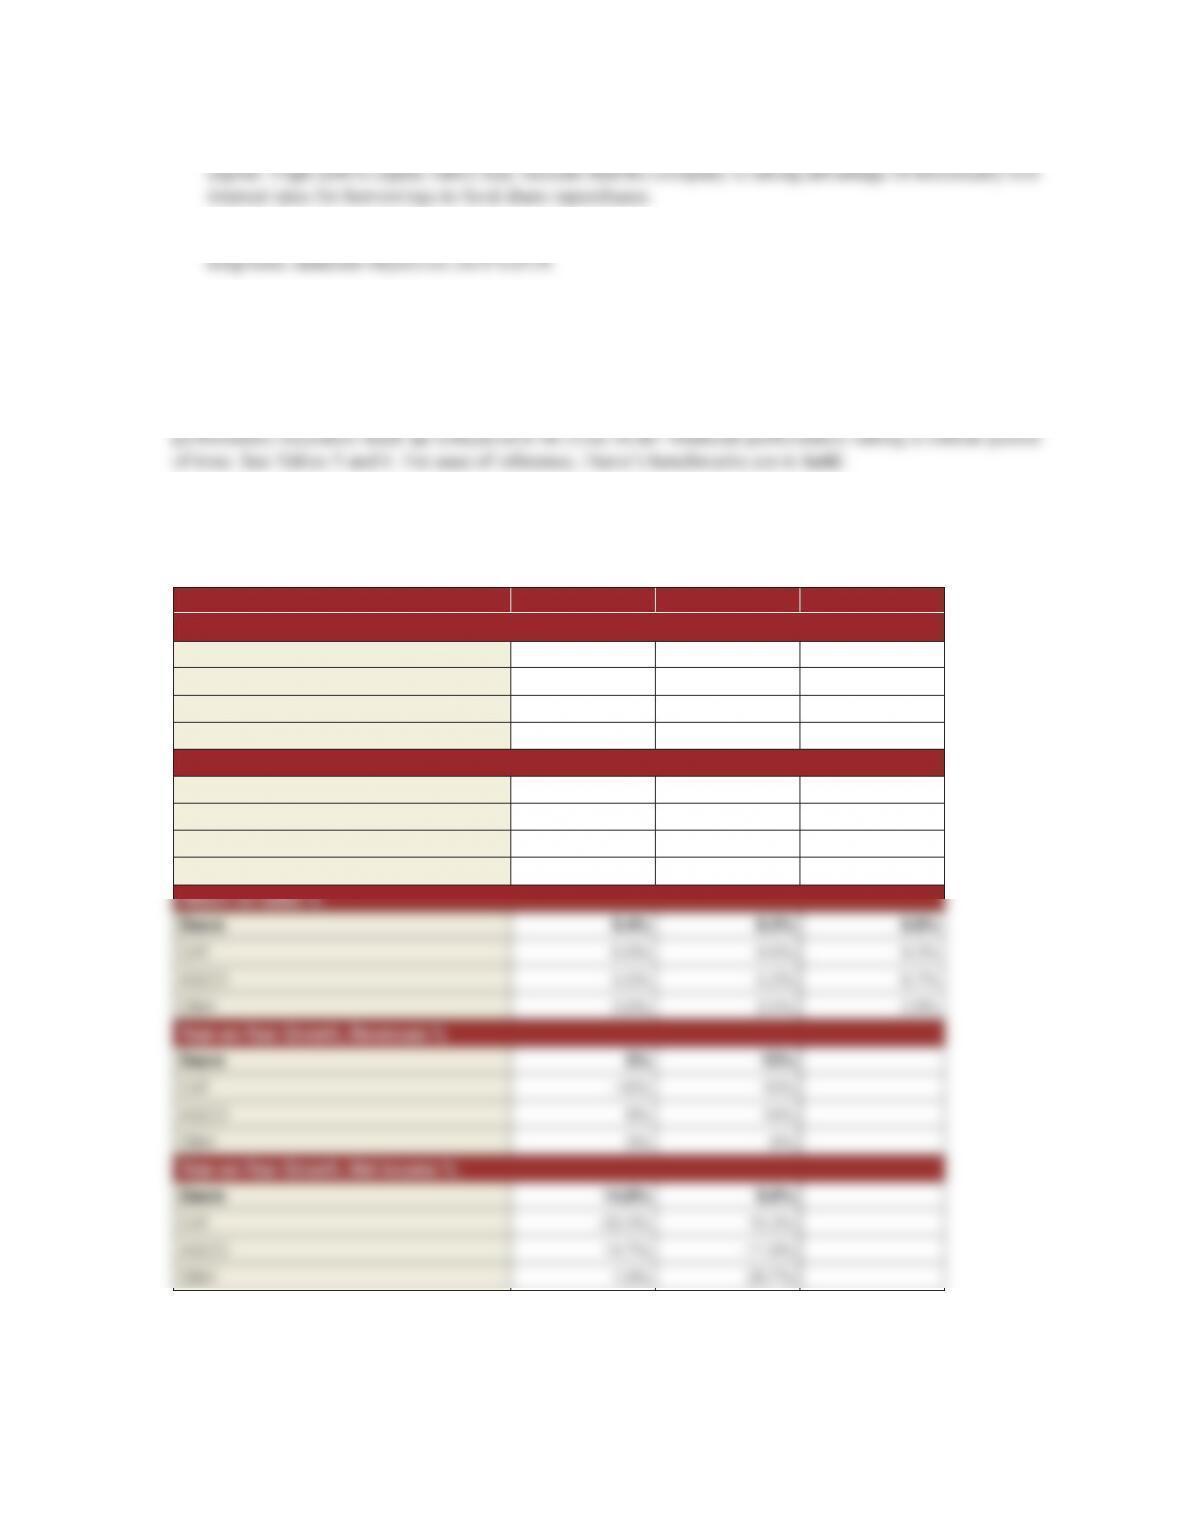
Students should also be pressed to use the financial ratios in Table 4.1 of Chapter 4 to determine how Deere’s
TABLE 5. Financial Ratios for Top Four Companies in Agricultural
and Construction Equipment, FY 2011–2013
FYE 2013 2012 2011
Gross margin %
Deere 32.1% 30.8% 31.5%
CAT
AGCO 22.2% 21.3% 20.2%
CNH 7.7% 8.0% 7.0%
Operating margin %
Deere 16.5% 15.3% 15.6%
CAT 10.1% 13.0% 11.9%
AGCO 8.3% 7.0% 7.0%
CNH 7.2% 7.2% 6.7%
Case 19 Teaching Note Deere & Company in 2014
542
TABLE 5. Financial Ratios for Top Four Companies in Agricultural
and Construction Equipment, FY 2011–2013
(Continued)
FYE 2013 2012 2011
Return on assets %
Deere 5.9% 5.5% 5.8%
CAT 4.5% 6.4% 5.4%
AGCO 7.0% 6.7% 8.1%
CNH 2.2% 2.3% 1.8%
Operating return on assets %
Deere 10.5% 9.8% 10.3%
CAT 6.6% 9.6% 7.8%
AGCO 10.7% 9.0% 8.4%
CNH 4.6% 4.8% 4.2%
NOTE: Based on data in Case Exhibits 1,2, 5, 6 & 7. Where spaces are blank, data were not available.
6. What business strategy recommendations would you make to Deere’s management?
Should the company consider divesting assets or acquiring new assets? Are there
other potential strategic options that should be under consideration? Please justify
your recommendations by outlining the pros and cons of each.
This assignment question provides an ideal opportunity to get students to synthesize the material in
Chapters 6–8. Of the six options listed in Table 6, we think that it is highly likely that Deere will pursue (2)
continued cost reduction and possibly (4) acquisitions of smaller producers in emerging markets as it seeks
to expand operations in China, Latin America, Russia, India, and possibly also Africa and the Middle East.
Case 19 Teaching Note Deere & Company in 2014
543
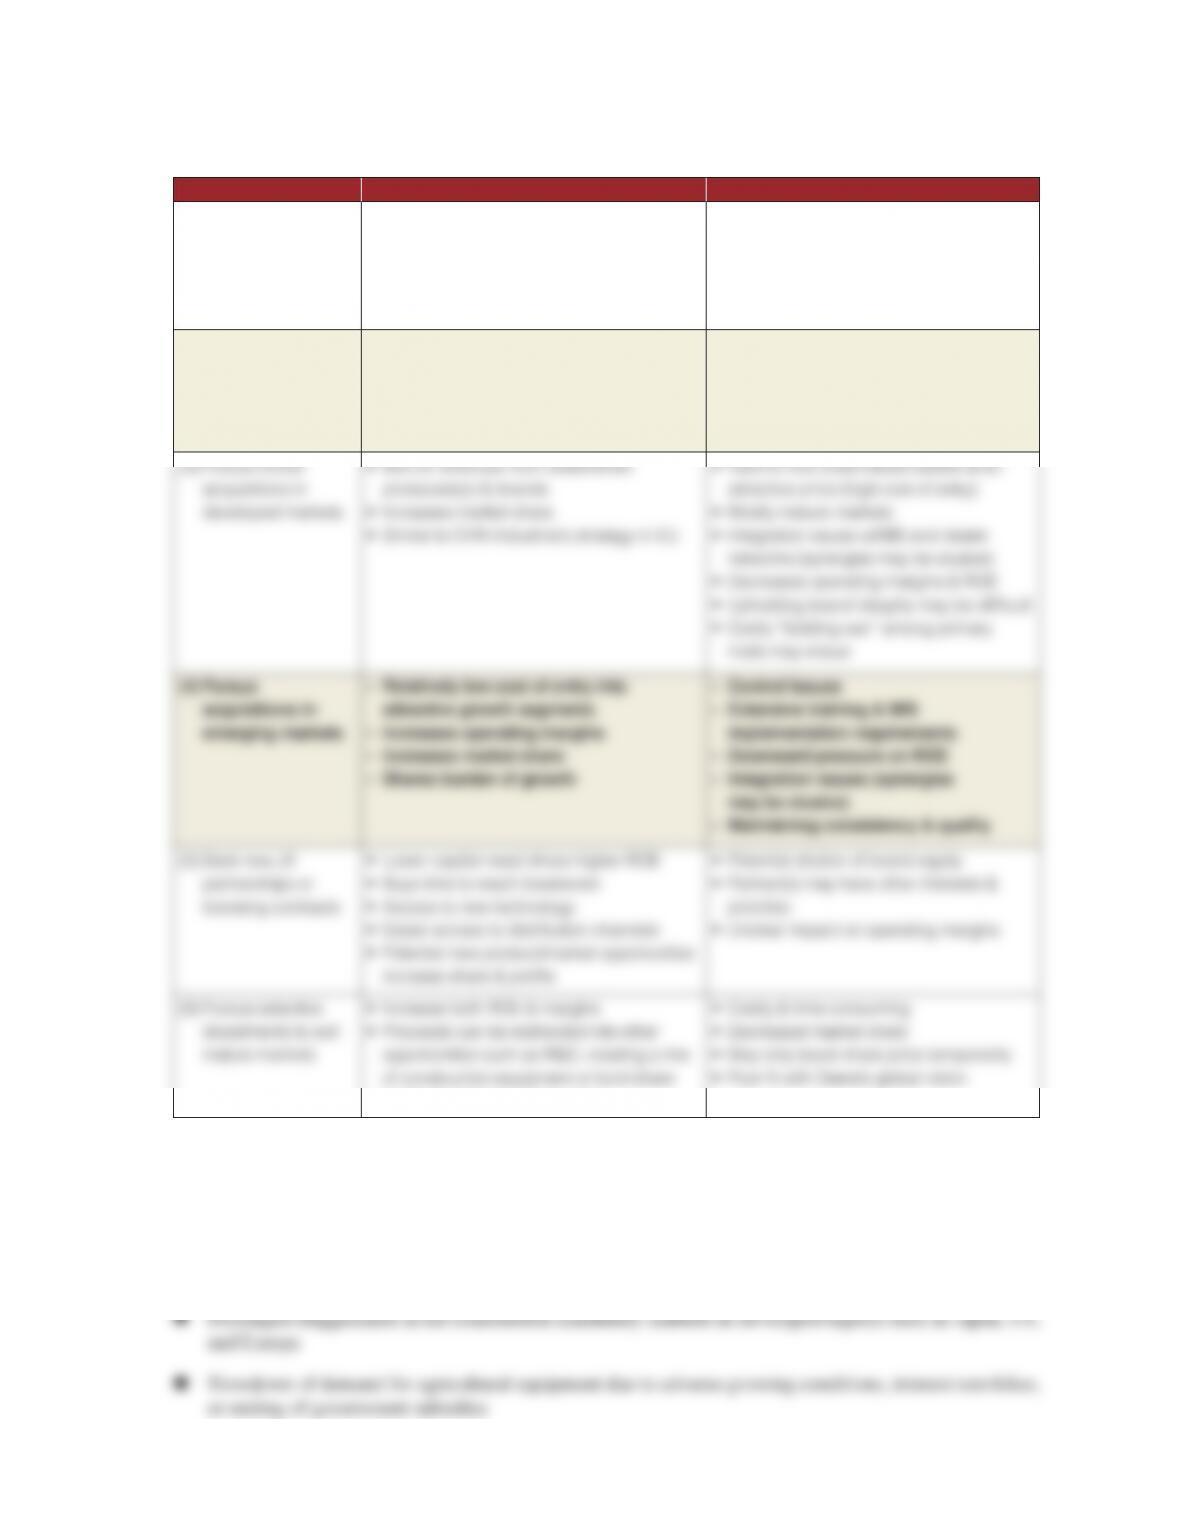
TABLE 6. Evaluation of Strategic Options for Deere
Deere’s Options Pro Con
(1) Continue business
as usual
• Culturally “safe” option
• Reduces potential for failure
• Unknown impact on market share,
profitability, or ROE
• Does not address need to diversify
product portfolio away from concentration
in agricultural equipment
(2) Pursue cost
reductions
• Deere has experience here
• Can be accomplished via new MIS
system
• Positive impact on margins & ROE
• Little or no impact on market share
• Is not “cost-free” due to needs for
outplacement and retraining
• Unknown intangible impacts on morale
due to workforce reductions
buybacks to boost share price
The biggest risks for Deere remain:
n The possibility of a stronger U.S. ($), making its domestically produced products uncompetitive in
world markets
n Demand in emerging markets such as Brazil, India, China and Russia slows due to political turmoil or
adverse events
Case 19 Teaching Note Deere & Company in 2014
544
Of course, competition in the industry at the top tier is very much driven by the need to build market share.
So, Deere’s primary rivals may also engage in the merger and acquisition arena in order to purchase share.
Winding Up the Class: You can end the class by pointing out that Deere is a perfect example of an international
company that:
n Has a well thought-out globalization strategy and
Epilogue
Demand revived for Deere’s products in the early part of FY 2014, largely because better economic conditions,
high crop prices, and strong farm income led farmers to buy equipment. However, Deere faces challenging
global economic conditions and less favorable crop pricing limiting the level of farm income in coming periods.
Analysts see these expected trends lowering demand for farm equipment. Analysts see these declines being partly
offset by their outlook for stronger sales of construction equipment, as housing markets have been improving in
the U.S.
As of late September 2014, analysts expected Deere’s revenues to decline by 5% in FY 2014 (Oct.) and fall a
further 7% in FY 2015, following a 5% advance in FY 2013. Analysts forecasted narrower net margins in FY
2014, limited by declining demand for the company’s farm equipment. Deere’s bottom line should be impacted
by the costs of ongoing product and capacity additions, as it remains active in setting up plants in emerging
markets.
After a sharp downturn in its business between late 2008 and late 2009, better global economic trends revived
Deere’s operations across most of its end markets and geographies, and brought a very strong sales and earnings
revival. However, in light of more challenging trends related to crops in the third and fourth quarters of 2014,
analysts believed that demand for farm equipment would slow somewhat in future periods, and bring a modest
downturn in Deere’s operating results over the next two fiscal years, although this could be offset by stronger
global economic growth than expected, and a surge in crop prices which would drive increased demand for
Deere’s agricultural products. Because of the merger of certain large integrated competitors and the emergence
and expanding global capability of many competitors, particularly in developing and high potential markets such
as India, China, Brazil and Russia (countries where Deere sought to increase market share), competitive rivalry
in the agricultural equipment business continued to become more intense. A summary of Deere & Company’s
financial performance for the first nine months of fiscal 2014 is presented in Table 8.

Case 19 Teaching Note Deere & Company in 2014
545
TABLE 7. Financial Highlights—First three quarters of FY 2014
As Reported Quarterly Income Statements—all amounts in $000 (except per share data)
7/31/14
Q3
4/30/14
Q2
1/31/14
Q1
Net sales $8,723,000 $9,246,200 $6,948,500
Finance & interest income 573,500 544,100 531,500
Other income 203,700 157,600 174,000
Total net sales & revenues 9,500,200 9,947,900 7,654,000
Cost of sales 6,611,300 6,871,800 5,195,500
Research & development expenses 362,100 354,100 323,700
Selling, administrative & general expenses 820,700 846,500 765,900
Interest expense 153,900 165,800 171,700
Other operating expenses 260,000 245,900 232,300
Total costs & expenses 8,208,000 8,484,100 6,689,100
Income (loss) of consolidated group before income taxes 1,292,200 1,463,800 964,900
Provision (benefit) for income taxes 450,200 479,000 280,500
Income (loss) of consolidated group 842,000 984,800 684,400
Equity income (loss) of unconsolidated affiliates 8,900 (3,600) (3,100)
Net income (loss) $850,900 $981,200 $681,300
Less: net income attributable to non-controlling interests (200) (500) (200)
Net income attributable to Deere & Company 850,700 980,700 681,100
Weighted average shares outstanding—basic 361,900 366,600 371,900
Weighted average shares outstanding—diluted 365,100 369,800 375,400
Year end shares outstanding 358,420 363,793 369,702
Net income (loss) per share—basic $2.35 $2.67 $1.83
Net income (loss) per share—diluted $2.33 $2.65 $1.81
Dividends paid per share $0.51 — $0.51
Source: “Deere announces third-quarter earnings of $851 million,” News Release, August 13, 2014.