Problem 5-8BA (Concluded)
Part 2
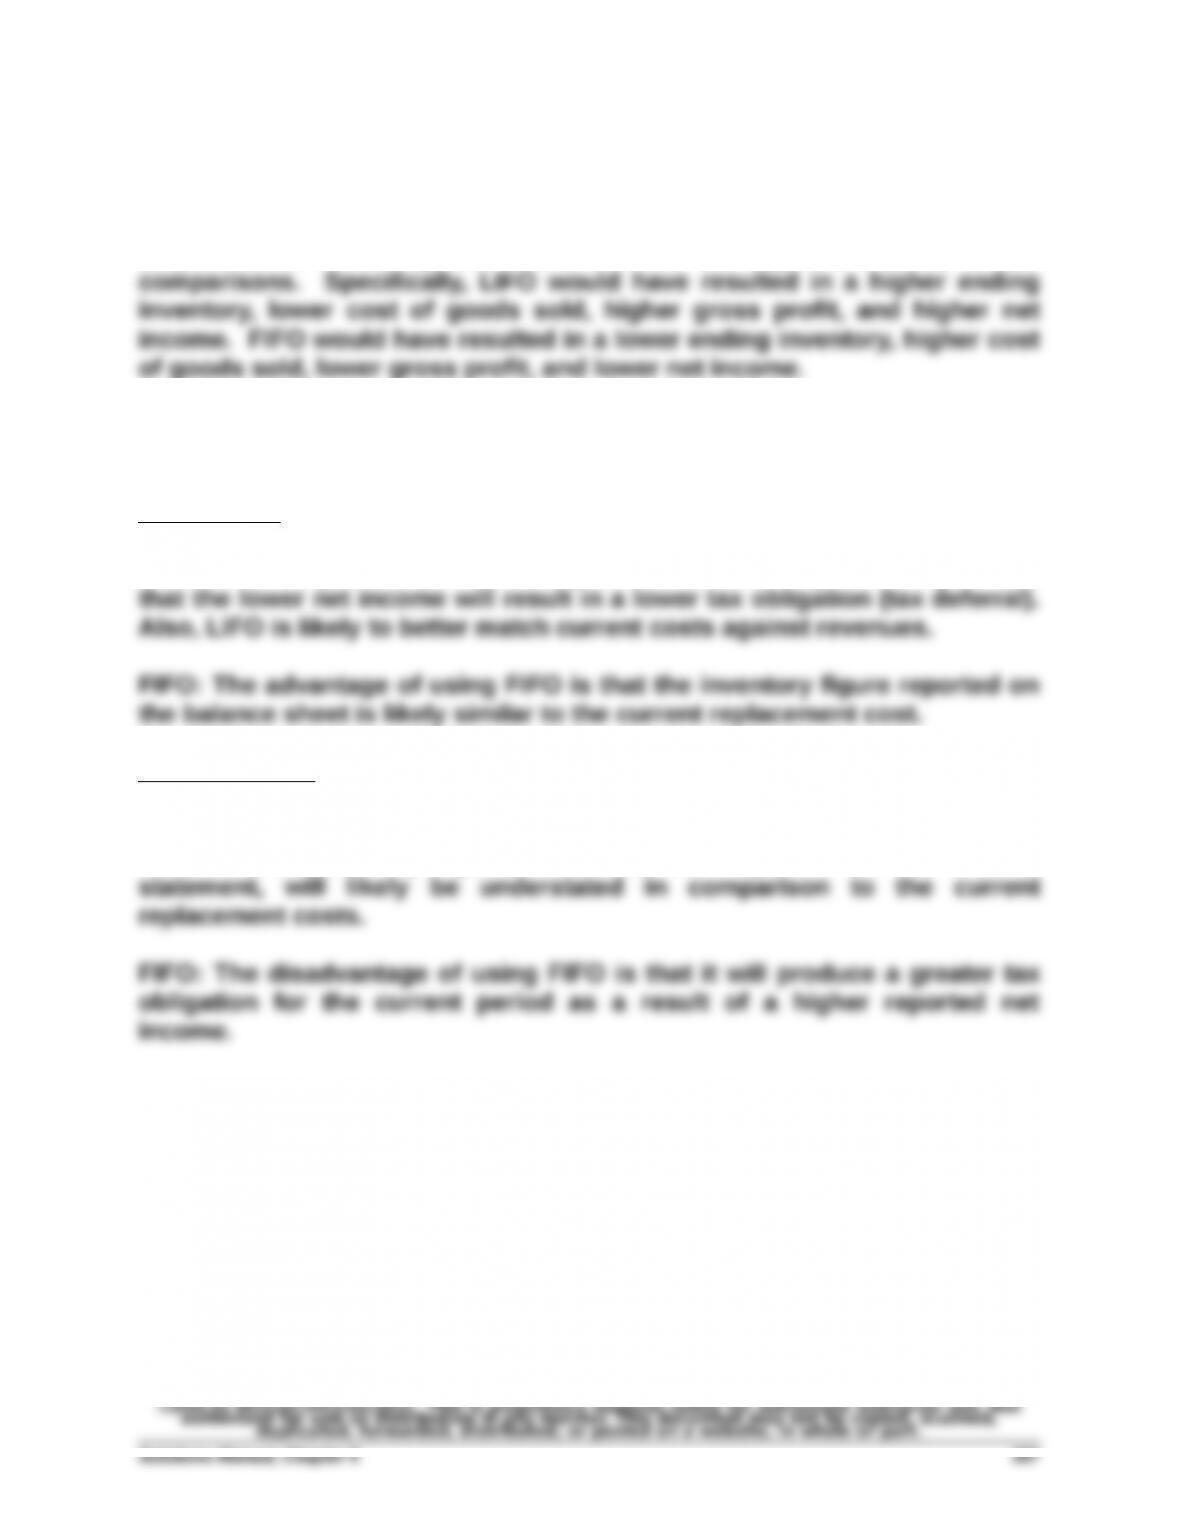
If Shepard Company had been experiencing decreasing costs in the
acquisition of inventory, we would observe the opposite results in our
Part 3
Advantages
LIFO: Assuming a trend of increasing costs, the advantage of using LIFO is
Disadvantages
LIFO: Assuming a trend of increasing costs, the disadvantage of using
LIFO is the inventory figure, which is also reported on the income
Problem 5-9BB (25 minutes)
Part 1
MACKLIN COMPANY
Estimated Inventory
December 31
At Cost At Retail
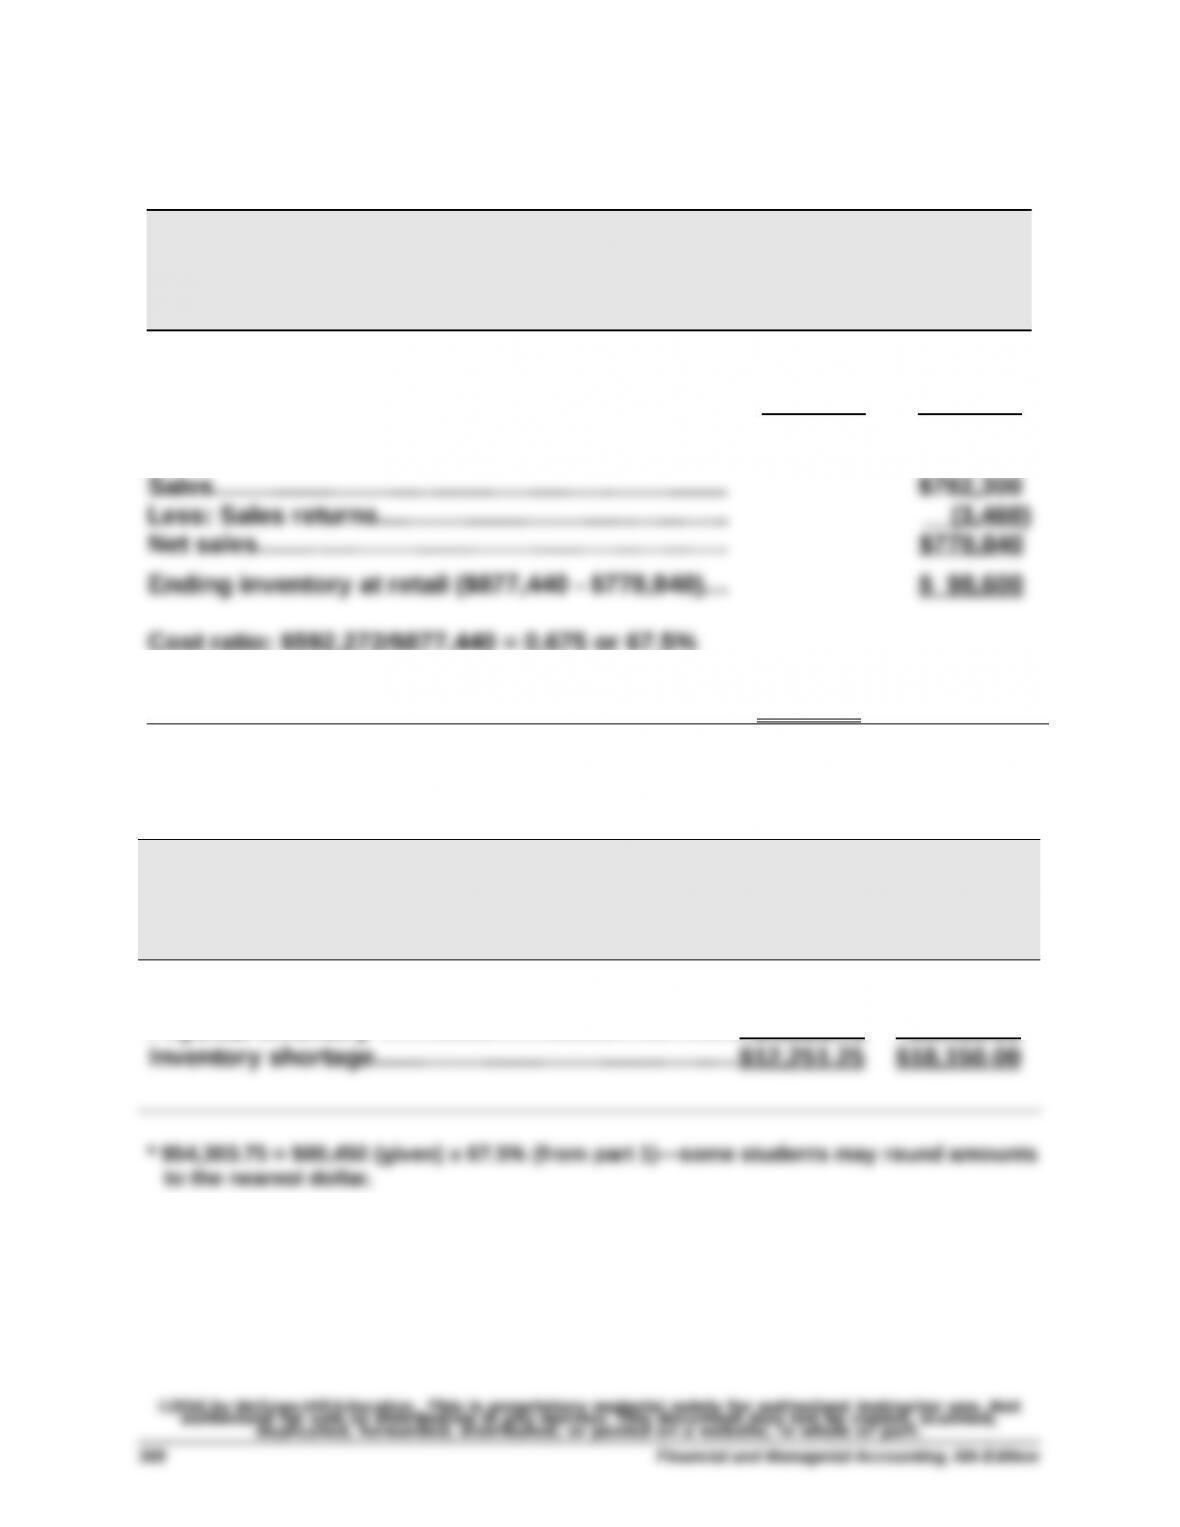
Goods available for sale
Beginning inventory………………………..….…….…… $ 90,022 $115,610
Cost of goods purchased…….………….…….…….… 502,250 761,830
Goods available for sale………….………….….……… $592,272 $877,440
Ending inventory at cost ($98,600 x 67.5%)……………… $ 66,555
Part 2
MACKLIN COMPANY
Inventory Shortage
December 31
At Cost At Retail
Estimated inventory (from part 1)………………………..$66,555.00 $98,600.00
Physical inventory*………………..…………….……….…… 54,303.75 80,450.00
Problem 5-10BB (25 minutes)
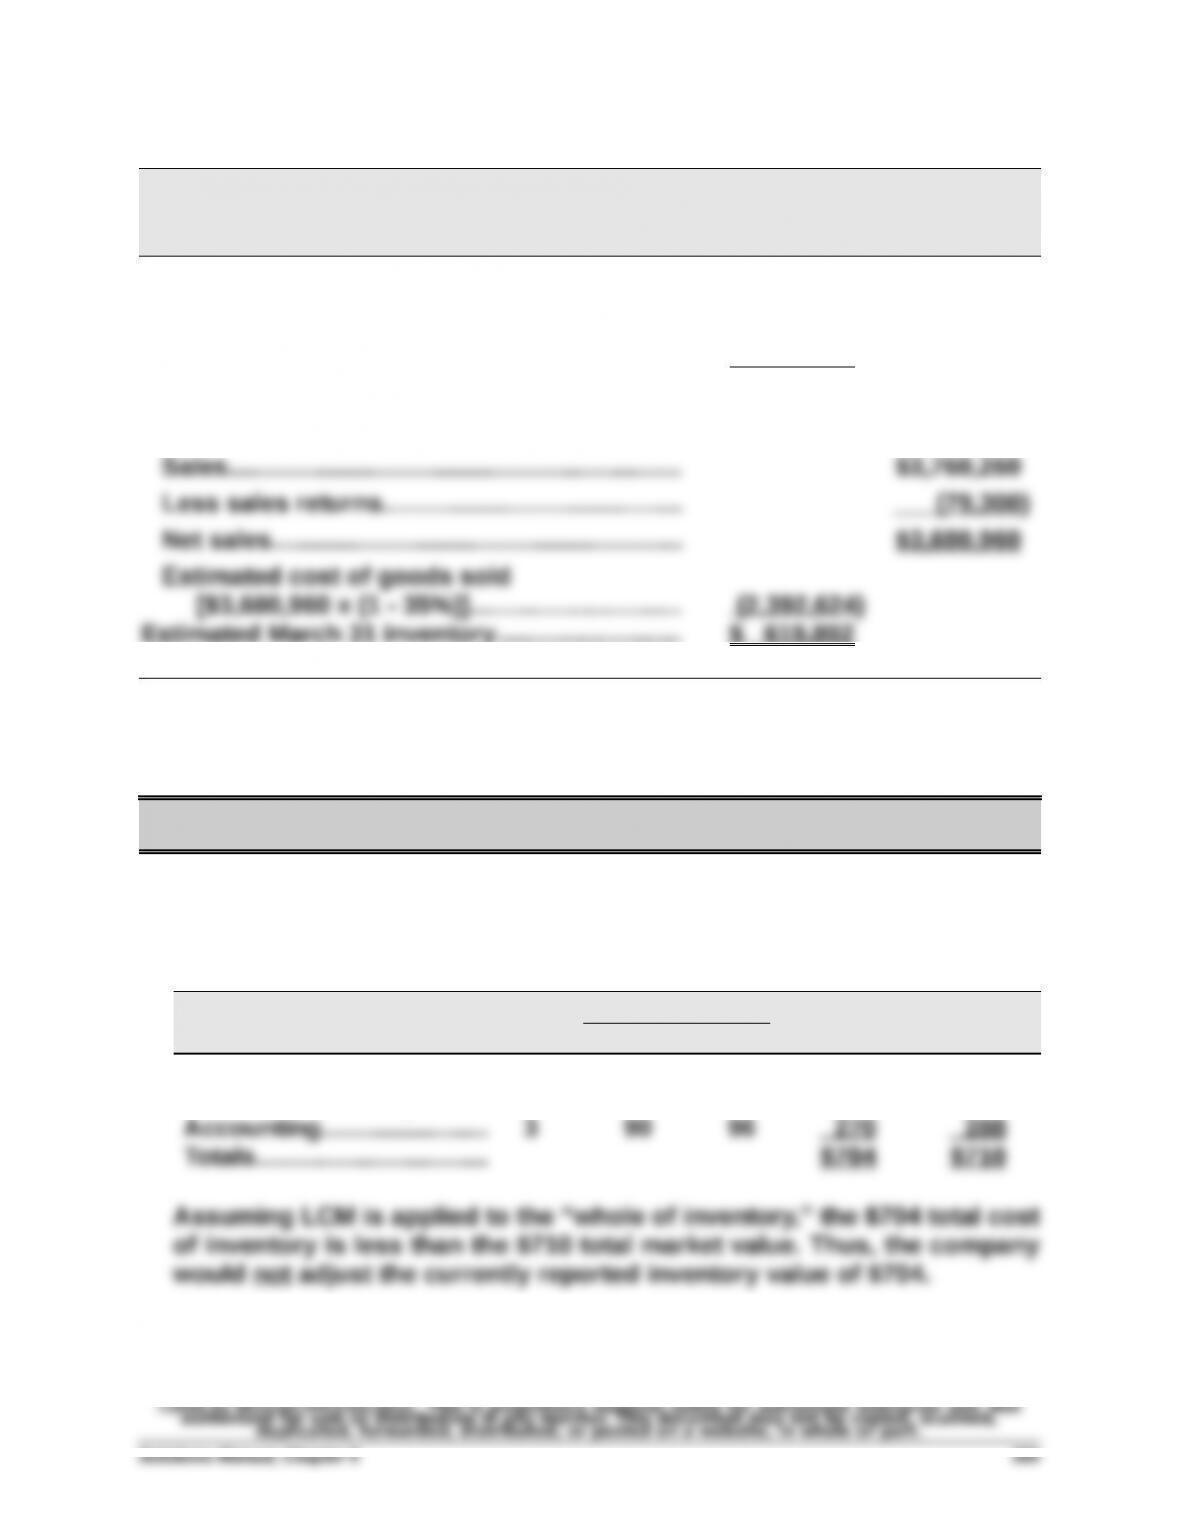
OTINGO EQUIPMENT CO.
Estimated Inventory at March 31
At Cost At Retail
Goods available for sale
Inventory, January 1……………………..………….. $ 802,880
Cost of goods purchased………………..….….… 2,209,636
Goods available for sale………………..…….…… 3,012,516
Less estimated cost of goods sold
SERIAL PROBLEM — SP 5
Serial Problem — SP 5, Business Solutions (20 minutes)
Part A
1.
Per Unit Total Total
Inventory Items Units Cost Market Cost Market
Office productivity………… 3 $ 76 $ 74 $228 $222
Desktop publishing…....... 2 103 100 206 200
Serial Problem — SP 5, Business Solutions (concluded)
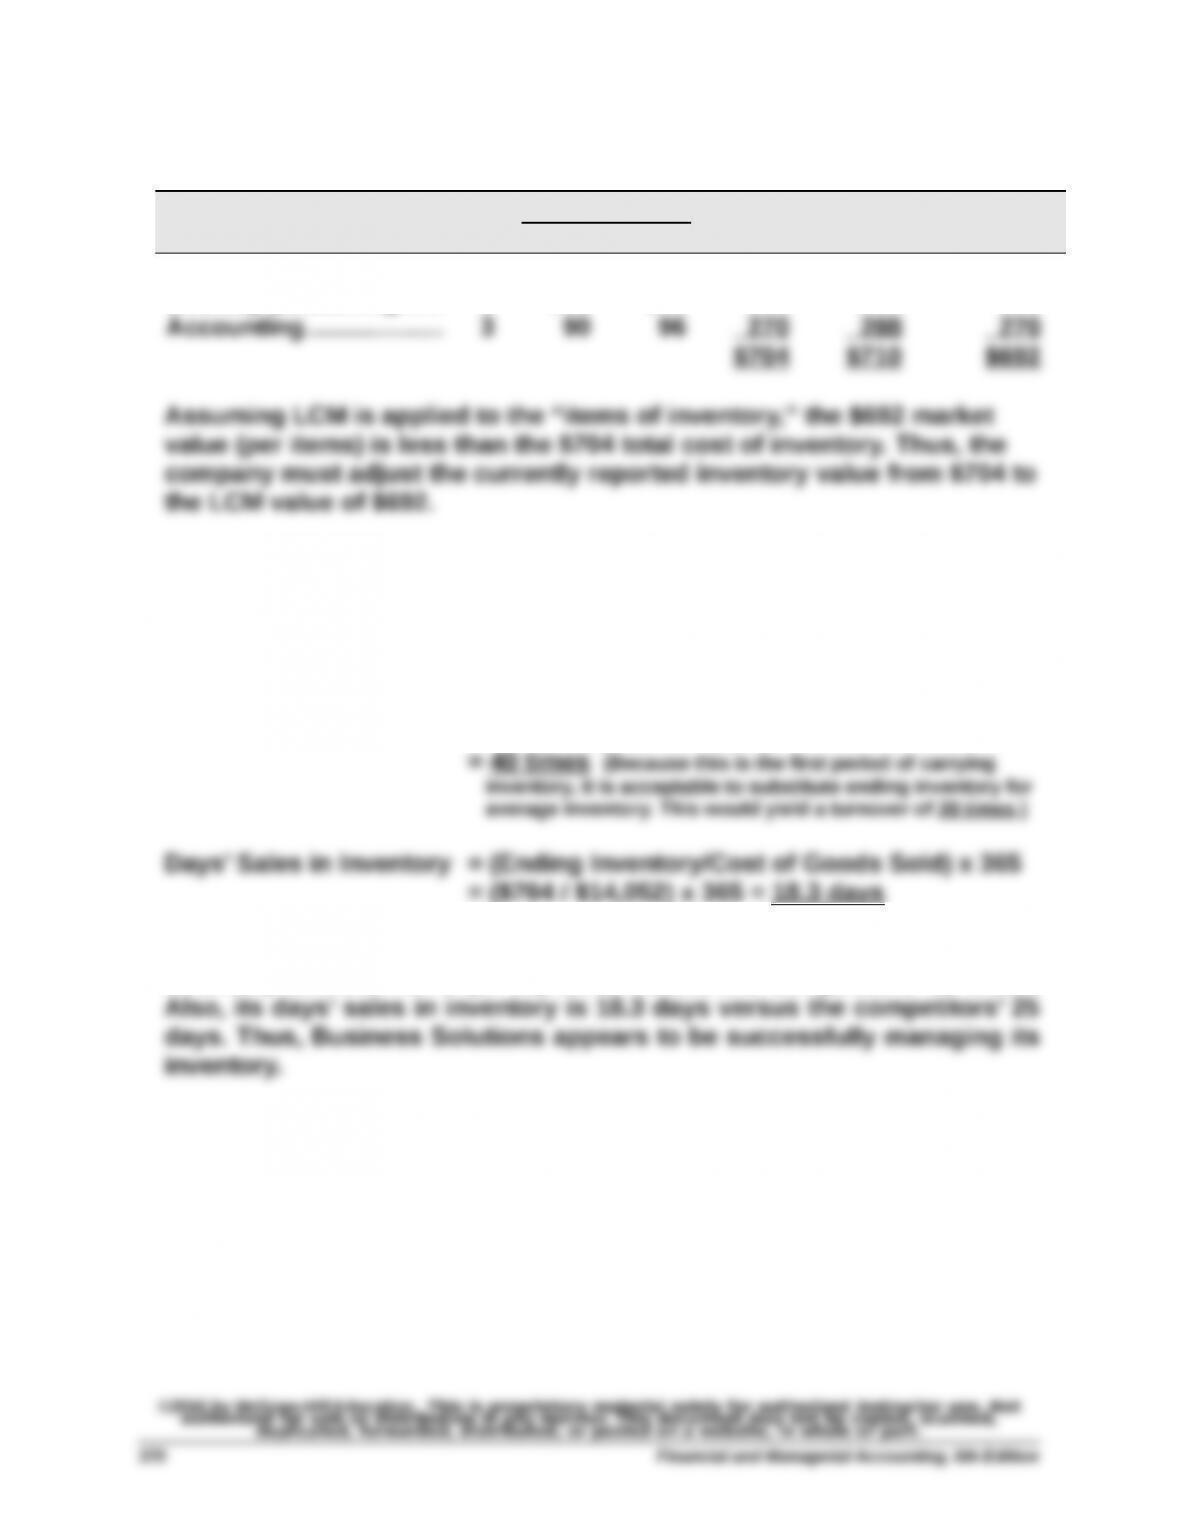
2.
Per Unit Total Total LCM Applied
Inventory Items Units Cost Market Cost Market To Items
Office productivity…….. 3 $ 76 $ 74 $228 $222 $222
Desktop publishing...... 2 103 100 206 200 200
Part B
1. Ratio computations for the three months ended March 31, 2016:
Inventory Turnover = Cost of Goods Sold / Average Inventory
= $14,052 / [($0 + $704)/2]
2. Business Solutions outperforms its competitors on both ratios. Its
inventory turnover is 40 (or 20) times versus the competitors’ 15 times.
Reporting in Action — BTN 5-1
($ millions for all parts)
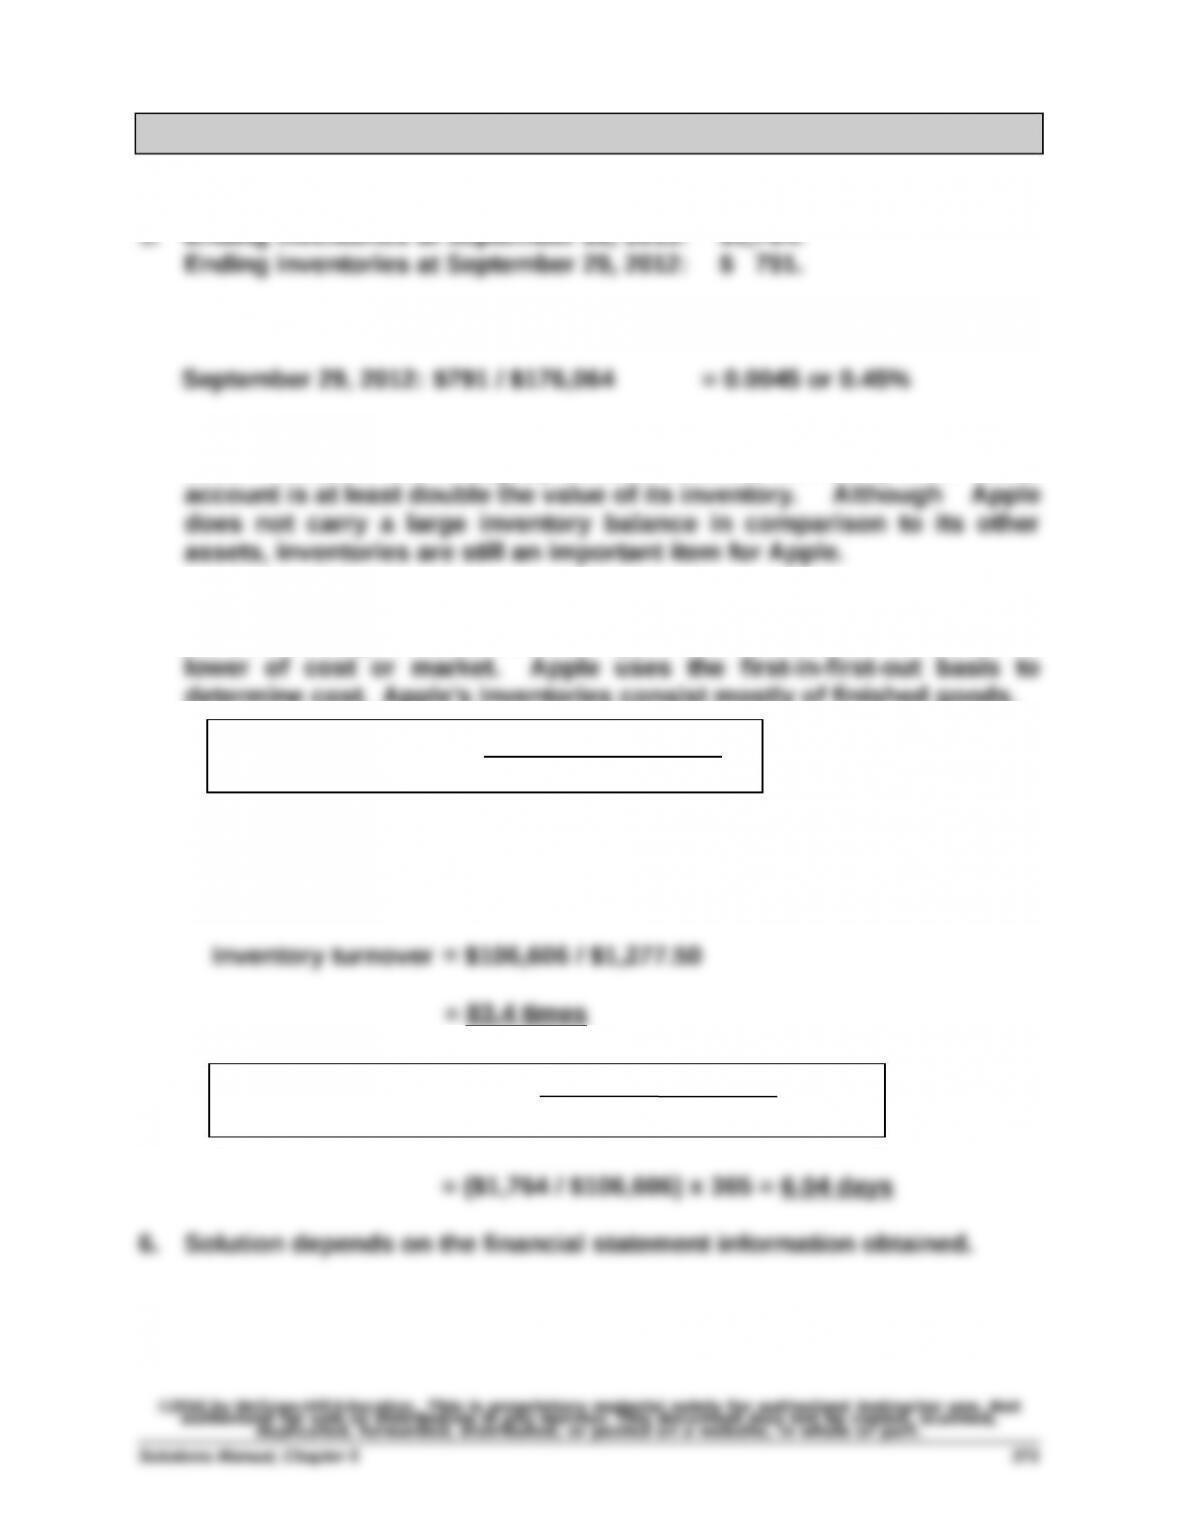
2. September 28, 2013: $1,764 / $207,000 = 0.0085 or 0.85%
3. Apple’s inventories are its second smallest asset at September 28,
2013. Goodwill has a slightly smaller balance, but every other asset
4. Reviewing notes to its financial statements, we see from Note 1 under
the subheading “inventories” that Apple’s inventories are stated at the
determine cost. Apple’s inventories consist mostly of finished goods.
5. a. Inventory turnover =
Average inventory = ($1,764 + $791) / 2
= $1,277.50
b. Days’ sales in inventory = x 365
Cost of sales
Average inventory
Ending inventory
Cost of sales
Comparative Analysis — BTN 5-2
($ thousands)
1. Inventory turnover =
Apple — current year
Inventory turnover = = 83.4 times
Apple — one year prior
Google — one year prior
Inventory turnover = = 76.4 times
Cost of sales
Average inventory
$106,606
($1,764 + $791) / 2
$20,634
($505 + $35) / 2
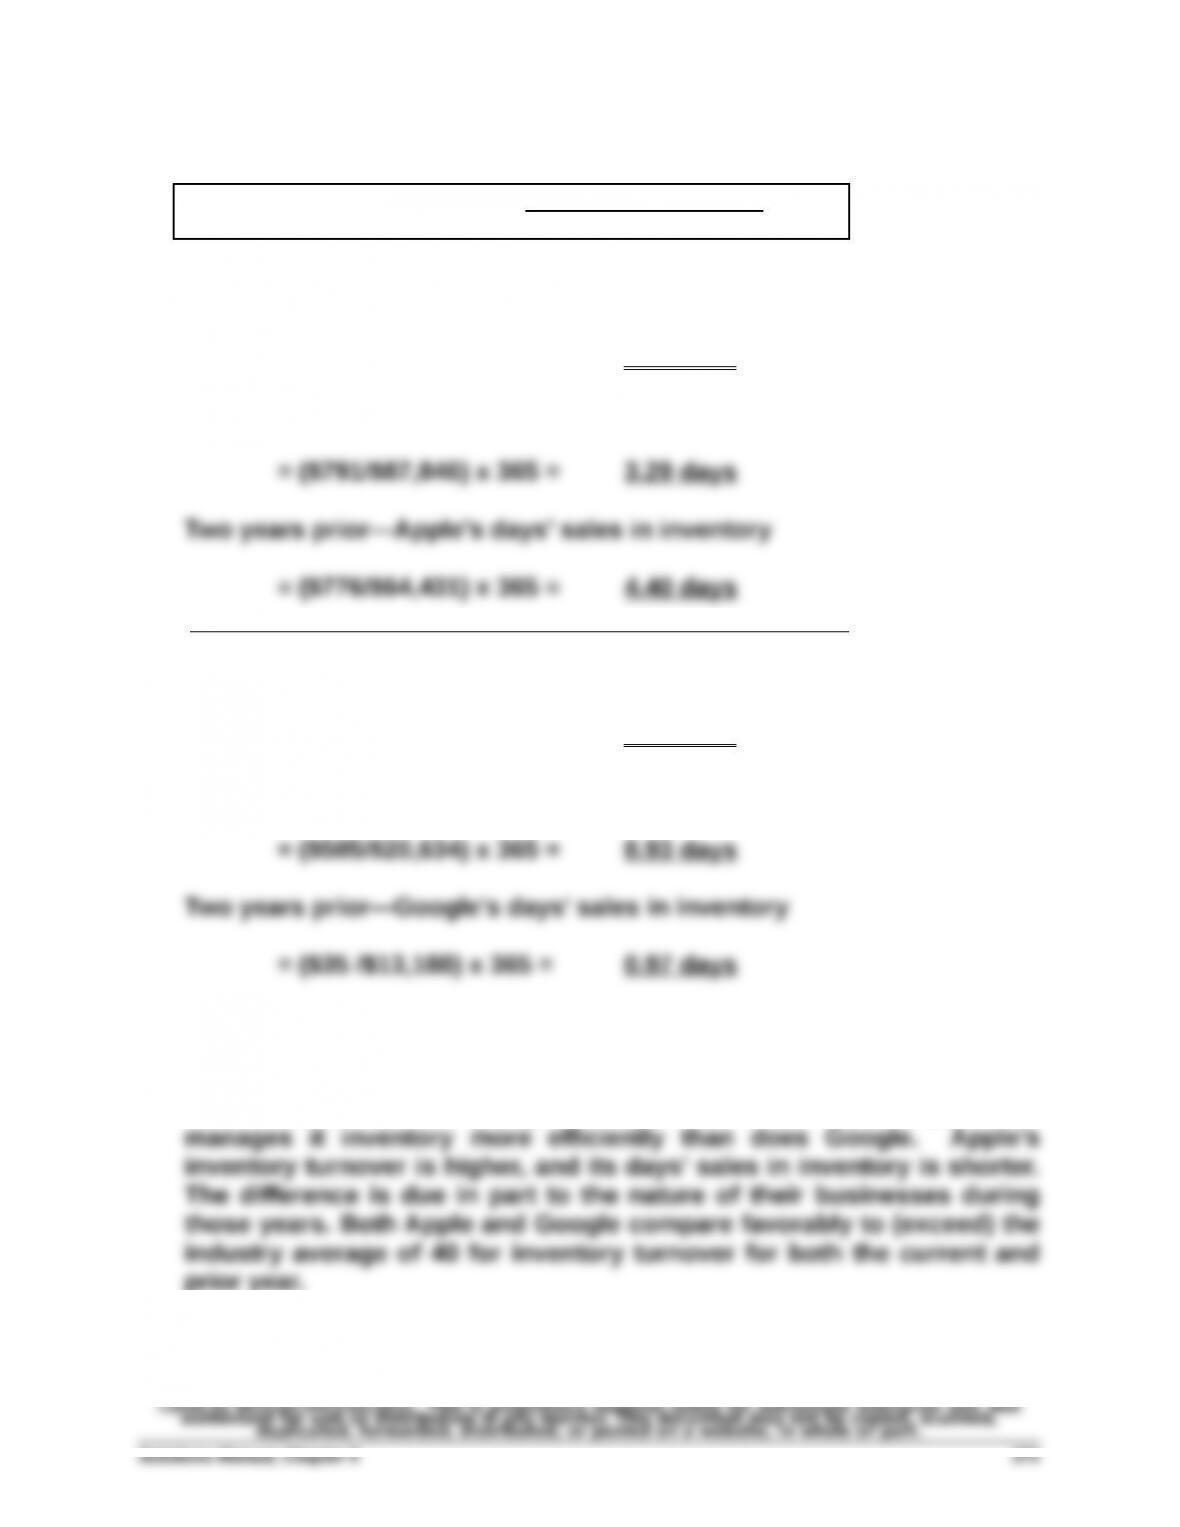
Comparative Analysis (Concluded)
2. Days’ sales in inventory = x 365
Current year — Apple’s days’ sales in inventory
= ($1,764/$106,606) x 365 = 6.04 days
One year prior —Apple’s days’ sales in inventory
Current year — Google’s days’ sales in inventory
= ($426/$25,858) x 365 = 6.01 days
One year prior —Google’s days’ sales in inventory
3. For the most recent year, Apple manages its inventory more efficiently
than does Google. Apple’s inventory turnover is higher, and its days’
sales in inventory is only slightly longer. For the prior year, Apple also
Ending Inventory
Costs of Goods Sold
Ethics Challenge — BTN 5-3
1. Profit Margin: In an economic environment of rising costs, the use of
FIFO results in a lower cost of goods sold than LIFO. If cost of goods
sold is lower, then net income will be higher. A higher net income will
improve the profit margin ratio, which is calculated as net income
divided by net sales.
2. First, it is true that managers have discretion in choosing an inventory
costing method. It appears, however, that Golf Challenge’s owner does
not understand that changing methods can only be done very
selectively over time. A change in method must be justified by
management for improving the financial reporting of the company.
Finally, if LIFO is currently being used for tax reporting, then the tax
reporting method must also change due to the LIFO Conformity Rule—
which demands that if LIFO is used for tax reporting, it must be used
for financial reporting.
Communicating in Practice — BTN 5-4
[Note: An acceptable memorandum format should be used.]
The body of the memo would likely recommend use of the LIFO method for
this start-up business. The memo should explain that this would allow for
the matching of the most recent (higher) costs against revenue through
Taking It to the Net — BTN 5-5
1. Apple designs, manufactures, and markets mobile communication and
media devices, personal computers, and portable digital music players.
2. Its summary of significant accounting policies (Note 1) reports:
3. Its gross margin for fiscal 2013 is ($ millions)
Sales……………..…………………….……..……….……… $ 170,910
Cost of sales………….…………….…….….……….…… (106,606 )
4. 2013 Inventory turnover* =
$106,606/ [($1,764 + $791)/2] = 83.4 times