Reporting in Action — BTN 3-1
1. The revenue recognition principle requires that revenue be recorded when
2. Apple provides information on revenue recognition in its Note 1 titled
“Summary of Significant Accounting Policies.” It reports that “The
Company recognizes revenue when persuasive evidence of an
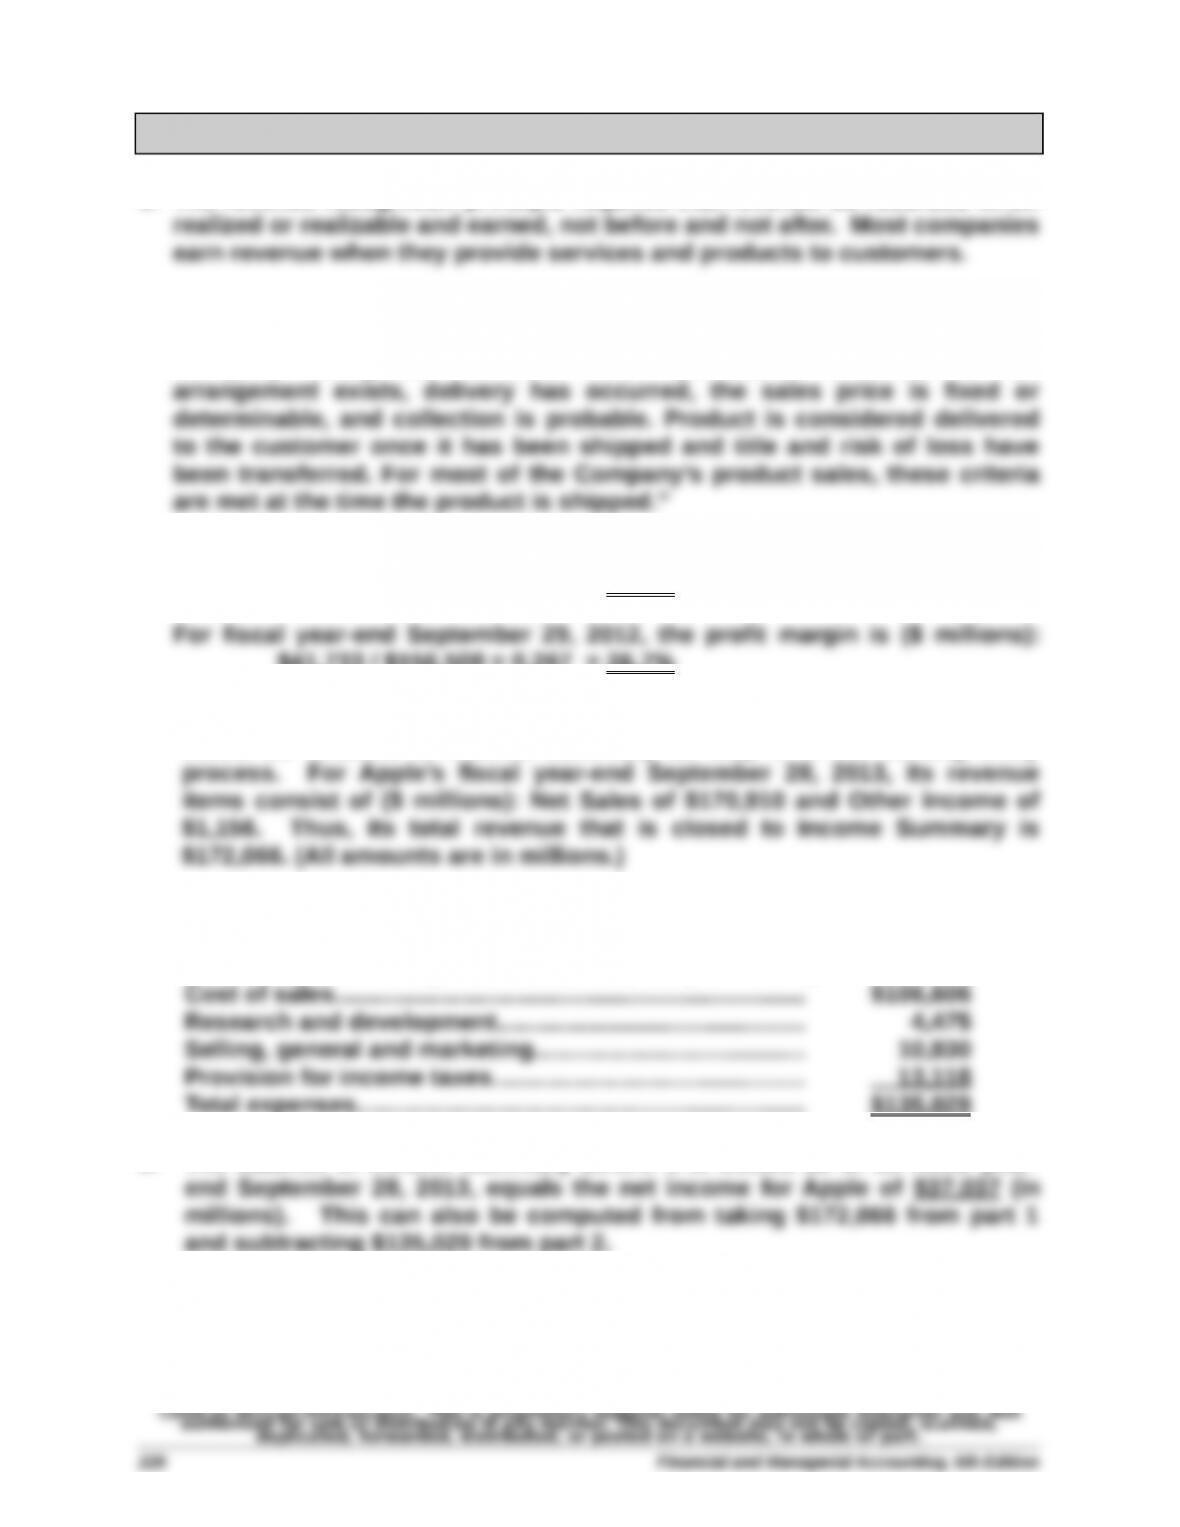
3. For fiscal year-end September 28, 2013, the profit margin is ($ millions):
$37,037 / $170,910 = 0.217 = 21.7%
$41,733 / $156,508 = 0.267 = 26.7%
4. The revenue items from its income statement must be identified, and those
would be credited to Income Summary as step 1 in the closing entry
5. The total expenses that would be debited to Income Summary as step 2 in
the closing entry process must be computed. Apple’s total expenses for
the fiscal year-end September 28, 2013, are (in millions):
Total expenses……………….……………………….….…..….…... $135,029
6. The balance of Income Summary before it is closed as of its fiscal year-
7. Solution depends on the financial statements accessed.
Comparative Analysis — BTN 3-2
($ in millions)
1. Apple
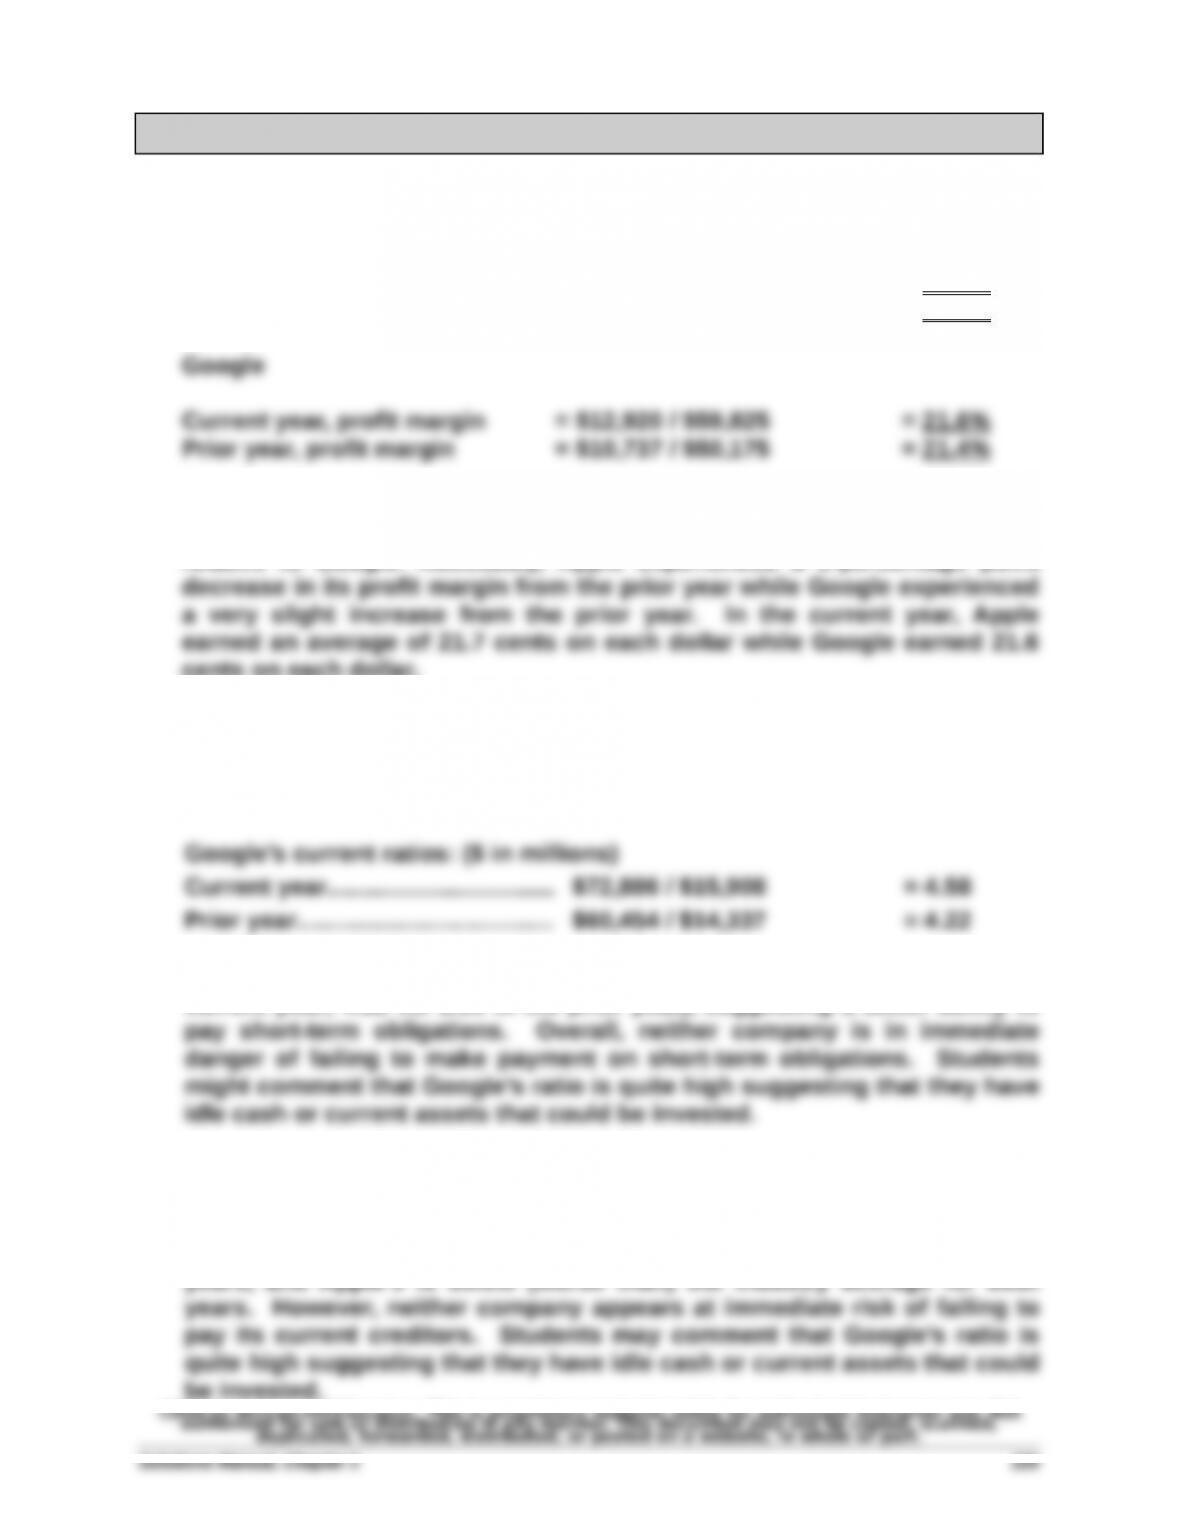
Current year, profit margin = $37,037 / $170,910 = 21.7%
Prior year, profit margin = $41,733 / $156,508 = 26.7%
2. Apple and Google have a comparable profit margin in the current year, but
Apple is more successful on the basis of profit margin in the prior year
relative to Google. Noticeably, Apple experienced a 5-percentage point
cents on each dollar.
3. Apple’s current ratios: ($ in millions)
Current year………..….….….….…... $73,286 / $43,658 = 1.68
Prior year………………………..….….. $57,653 / $38,542 = 1.50
4. In both years, Google has the higher current ratio (4.58 vs 1.68 for the
current year; 4.22 vs. 1.50 in the prior year), suggesting a better ability to
5. Apple’s current ratio increased from 1.50 to 1.68. Google’s current ratio
also increased from 4.22 to 4.58.
6. Google’s current ratio is above (better than) the industry average for both
years, and Apple’s is below (worse than) the industry average for both
Ethics Challenge — BTN 3-3
1. GAAP requires that annual deprecation be accumulated in a contra-
asset account, called Accumulated Depreciation. While property, plant,
2. One strength of Smith’s method would be the ease of preparing the
balance sheet. The property, plant, and equipment balance in the
3. While both approaches would lead to the same total assets on the
Communicating in Practice — BTN 3-4
TO: _____________________
FROM: _____________________
DATE: ______________________
SUBJECT: CLARIFICATIONS—OBJECTIVE OF THE CLOSING PROCESS
[Following is a sample of what the memorandum’s contents might include.]
When we speak of “closing the books” or the closing process we are not
talking about ending or closing the business nor doing anything that reflects
this thinking in the financial statements. Let me use an analogy to explain the
concept of the closing process and then you will see the distinction more
clearly.
The revenue and expense accounts temporarily hold the information to
determine if the owner(s) won or lost in the game of business. Each fiscal
period should be viewed as a separate game. After the data in these accounts
has allowed us to determine if the owner(s) won or lost, in other words, the net
I hope this memo clarifies the objective of the closing process.
[Note: The memorandum need not discuss the income summary account since the assignment
requires explaining the concept, not the procedure.]
Taking It to the Net — BTN 3-5
1. The Gap’s main brands (stores) are The Gap, Old Navy, and Banana
Republic. It also has Piperlime and Athleta brands.
2. The Gap’s fiscal year-end is January 28, 2012. It appears that The Gap’s
3. Net sales for the year ended January 28, 2012, are $14,549 million.
5. Profit margin = $833 million / $14,549 million = 5.73%
6. The company probably chose a fiscal year-end as the end of January or
Teamwork in Action — BTN 3-6
Note that there is no specific solution to this activity. Still, the presentation
of each expert team should reflect the following summary points:
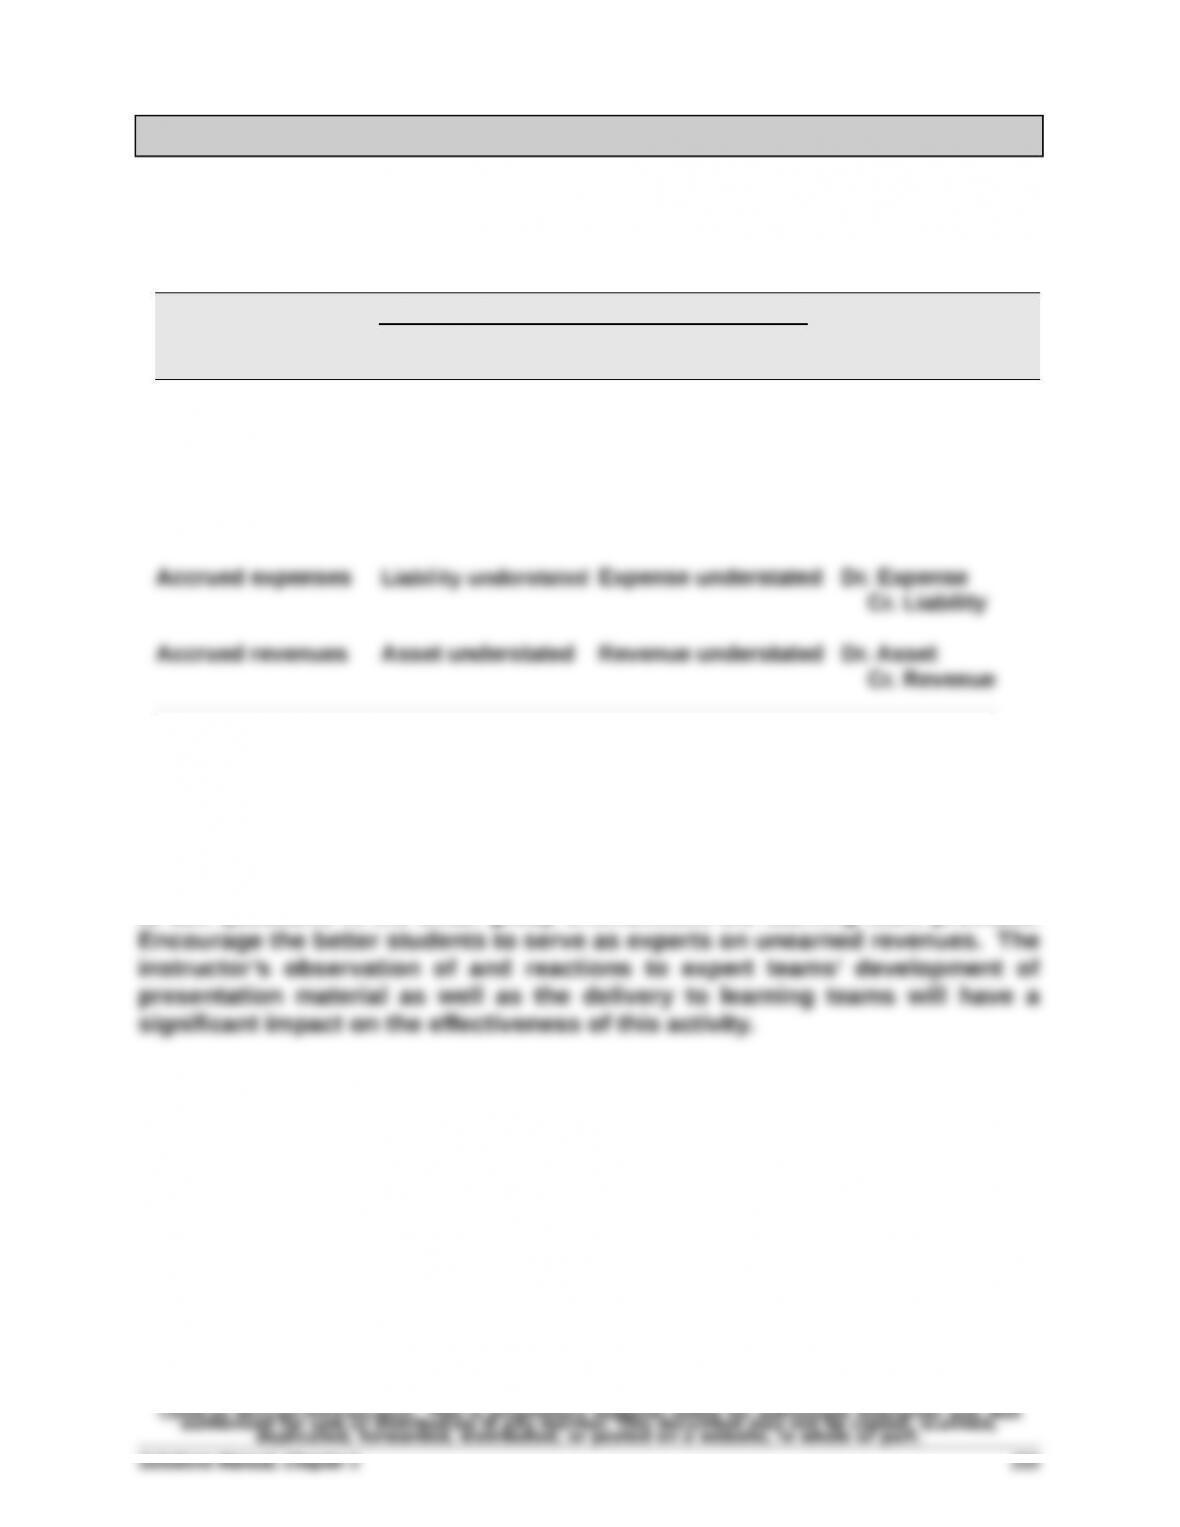
Before Adjusting
Balance Sheet Income Statement
Type Account Account Adjusting Entry
Prepaid expenses Asset overstated Expense understated Dr. Expense
Cr. Asset*
Unearned revenues Liability overstated Revenue understated Dr. Liability
Cr. Revenue
* For depreciation, one would Credit the Accumulated Depreciation contra account.
Some implementation notes: This activity allows all students to be actively
involved in the learning process. Encourage students to take the opportunity
to ask questions in the small group environment the learning team provides.
Entrepreneurial Decision — BTN 3-7
1. a.To record the collection of cash from sale of the gift certificate in
advance of delivery of merchandise to the customer:
b. To record the delivery of merchandise to the customer when he/she
uses the gift certificate:
2. Carrying less inventory would allow the company to save the costs of
keeping and maintaining that added inventory; such as warehousing
costs), profit margin should increase.
3. If the company carries additional inventory, it can potentially sell more
merchandise and increase its profits. This might further fuel increased
sales as additional customers might be attracted to its products. On
Hitting the Road — BTN 3-8
There is no formal solution to this field activity. The instructor may wish to
tally students’ findings to show results across companies as to use of work
Global Decision — BTN 3-9
1. Samsung (KRW in millions)
Current year, profit margin = ₩30,474,764/ ₩228,692,667= 13.3%
Apple (in millions)
2. Apple is slightly more successful on the basis of profit margin in the
current year relative to Google. However, both Apple and Google are
more successful on the basis of profit margin in the current year