PROBLEM SET A
Problem 24-1A (50 minutes)
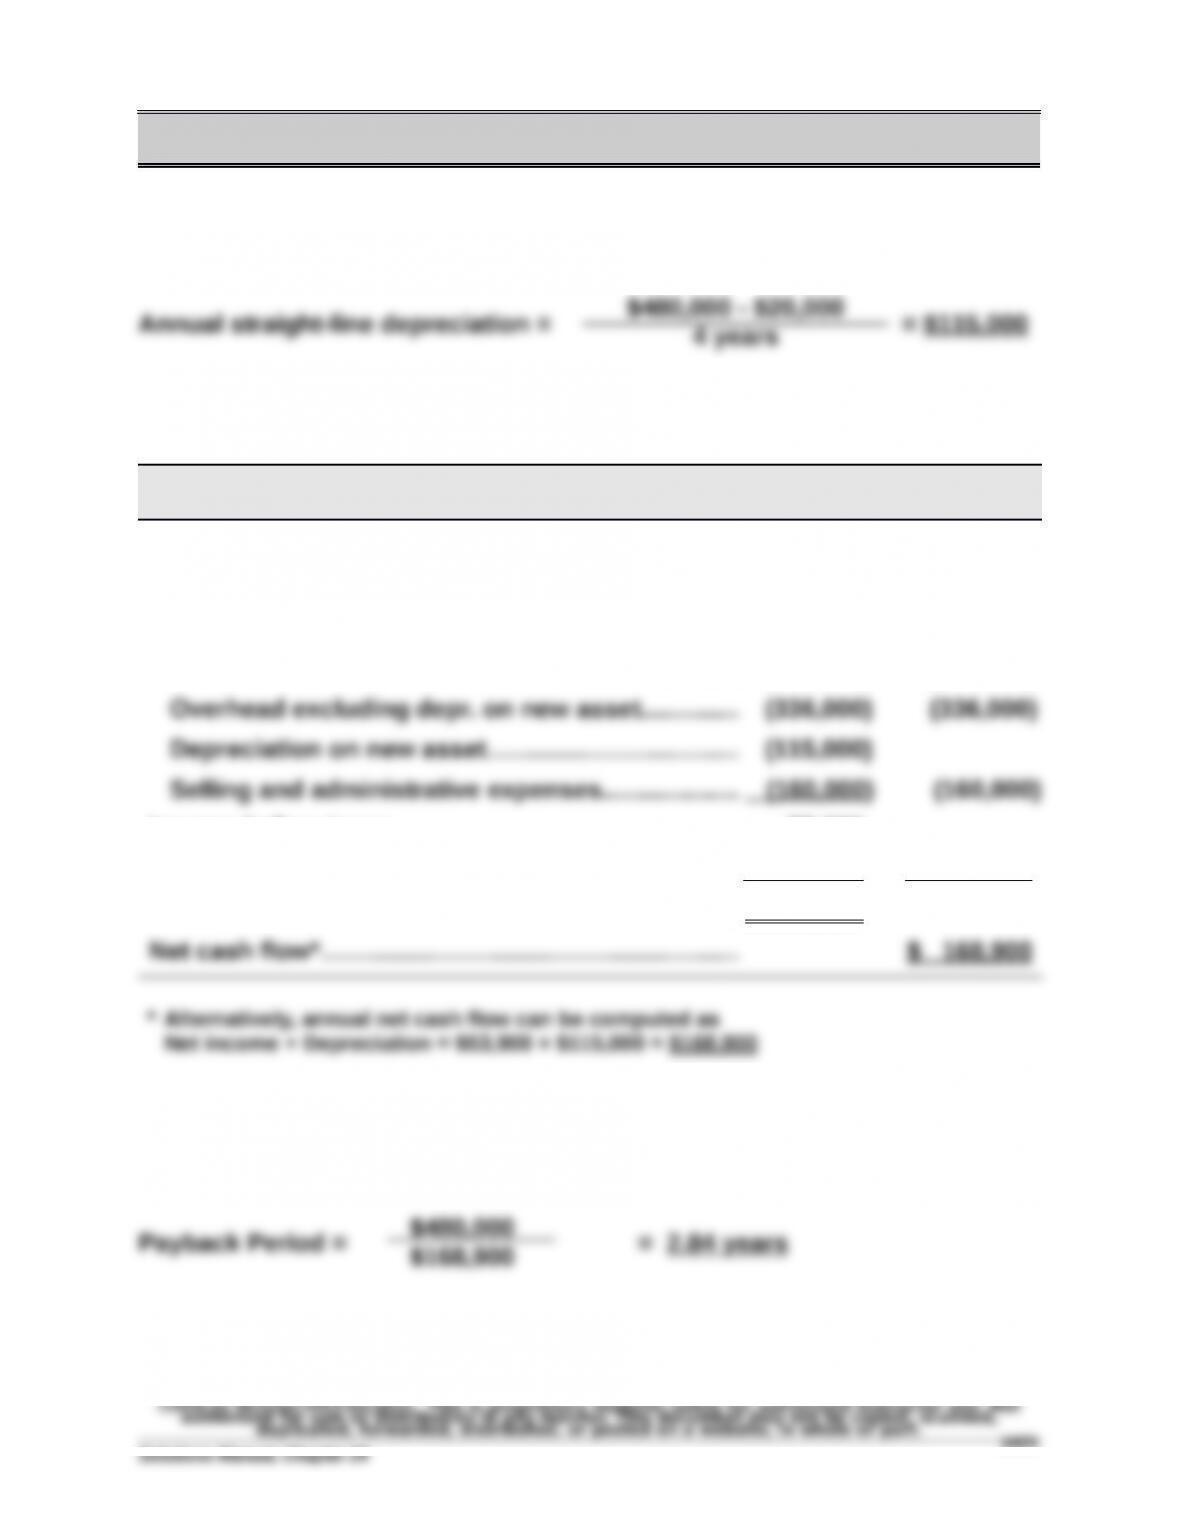
Part 1
Part 2
Net Net Cash
Income Flow
Expected annual sales of new product……….….…..$1,840,000 $1,840,000
Expected costs of new product
Direct materials…………….…….….….….….….….….… (480,000) (480,000)
Direct labor…….………………….….…..….….….….….… (672,000) (672,000)
Income before taxes………….………………………………. 77,000
Income taxes (30%)……………………………….….….…... (23,100) (23,100)
Net income……………..…………………………….….….…... $ 53,900
Part 3
©2016 by McGraw-Hill Education. This is proprietary material solely for authorized instructor use. Not
authorized for sale or distribution in any manner. This document may not be copied, scanned,
duplicated, forwarded, distributed, or posted on a website, in whole or part.
Solutions Manual, Chapter 24
$480,000 – $20,000
4 years
$480,000
1405
Problem 24-1A (Continued)
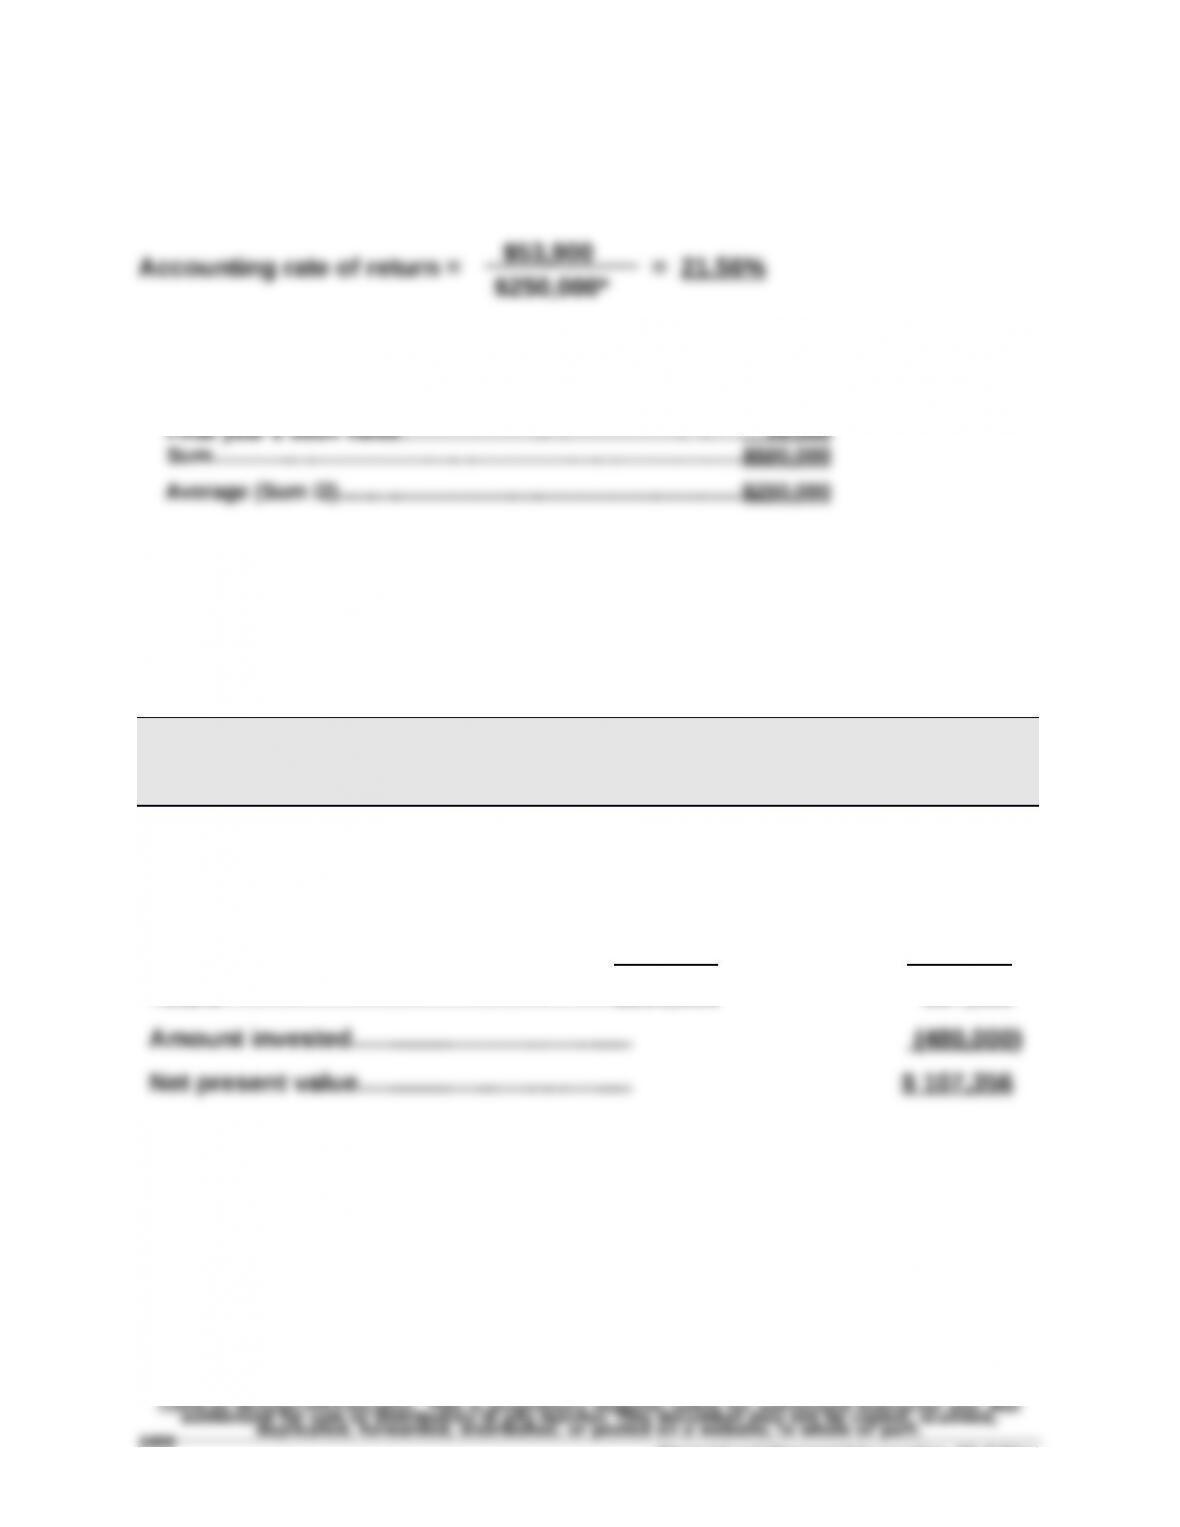
Part 4
* Average investment
Asset cost………………………………………………………………………..$480,000
Part 5
Present Value of Net Cash Flows
Present Present
Net Cash Value of Value of Net
Flows 1 at 7% Cash Flows
Year 1…………………….…………………………….$168,900 0.9346 $ 157,854
Year 2…………………….…………………………….168,900 0.8734 147,517
Year 3…………………….…………………………….168,900 0.8163 137,873
Year 4*……………………….….….….…..….….…. 188,900 0.7629 144,112
Totals.……………………………………...….….…..$695,600 587,356
* Year 4’s cash flow includes the $20,000 salvage value.
Financial and Managerial Accounting, 6th Edition
1406
Problem 24-2A (55 minutes)
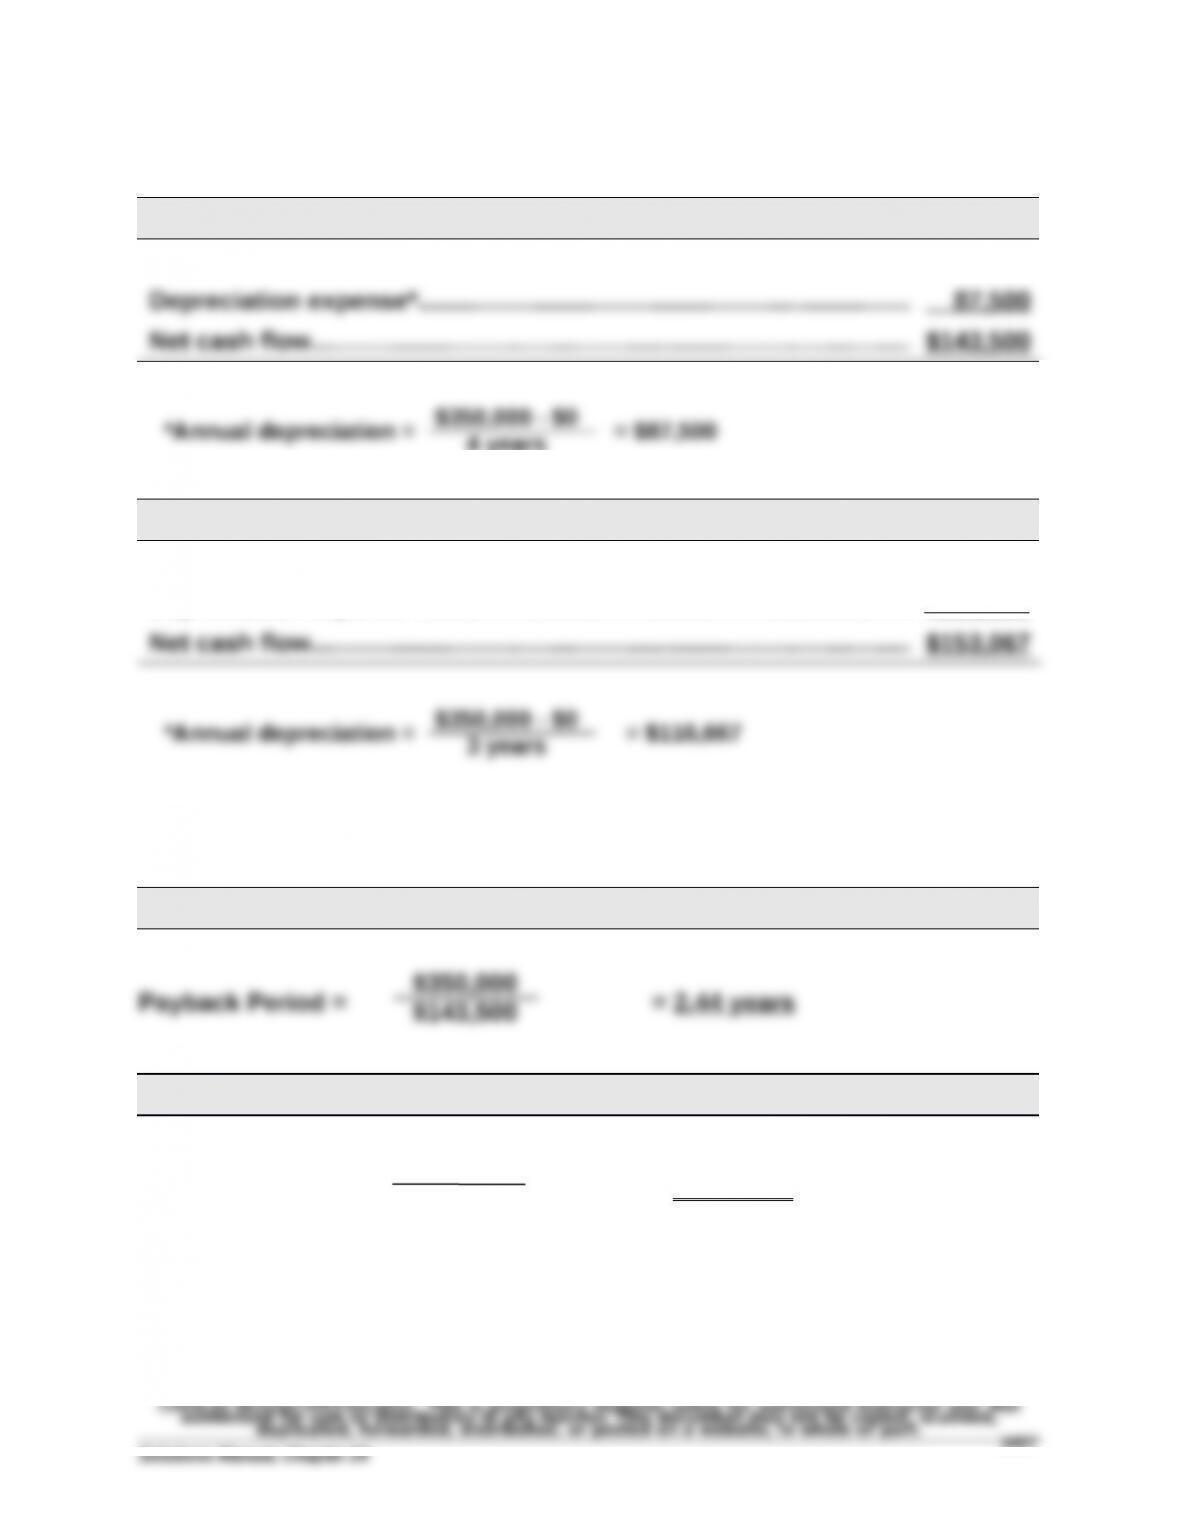
Part 1
PROJECT Y
Net income……………..…………………………………………………………….… $ 56,000
PROJECT Z
Net income……………..…………………………………………………………….… $ 36,400
Depreciation expense*……….……………………………………………………. 116,667
PROJECT Z
Payback Period = = 2.29 years
©2016 by McGraw-Hill Education. This is proprietary material solely for authorized instructor use. Not
authorized for sale or distribution in any manner. This document may not be copied, scanned,
duplicated, forwarded, distributed, or posted on a website, in whole or part.
Solutions Manual, Chapter 24
4 years
$350,000
$153,067
1407
Problem 24-2A (Continued)
Part 3
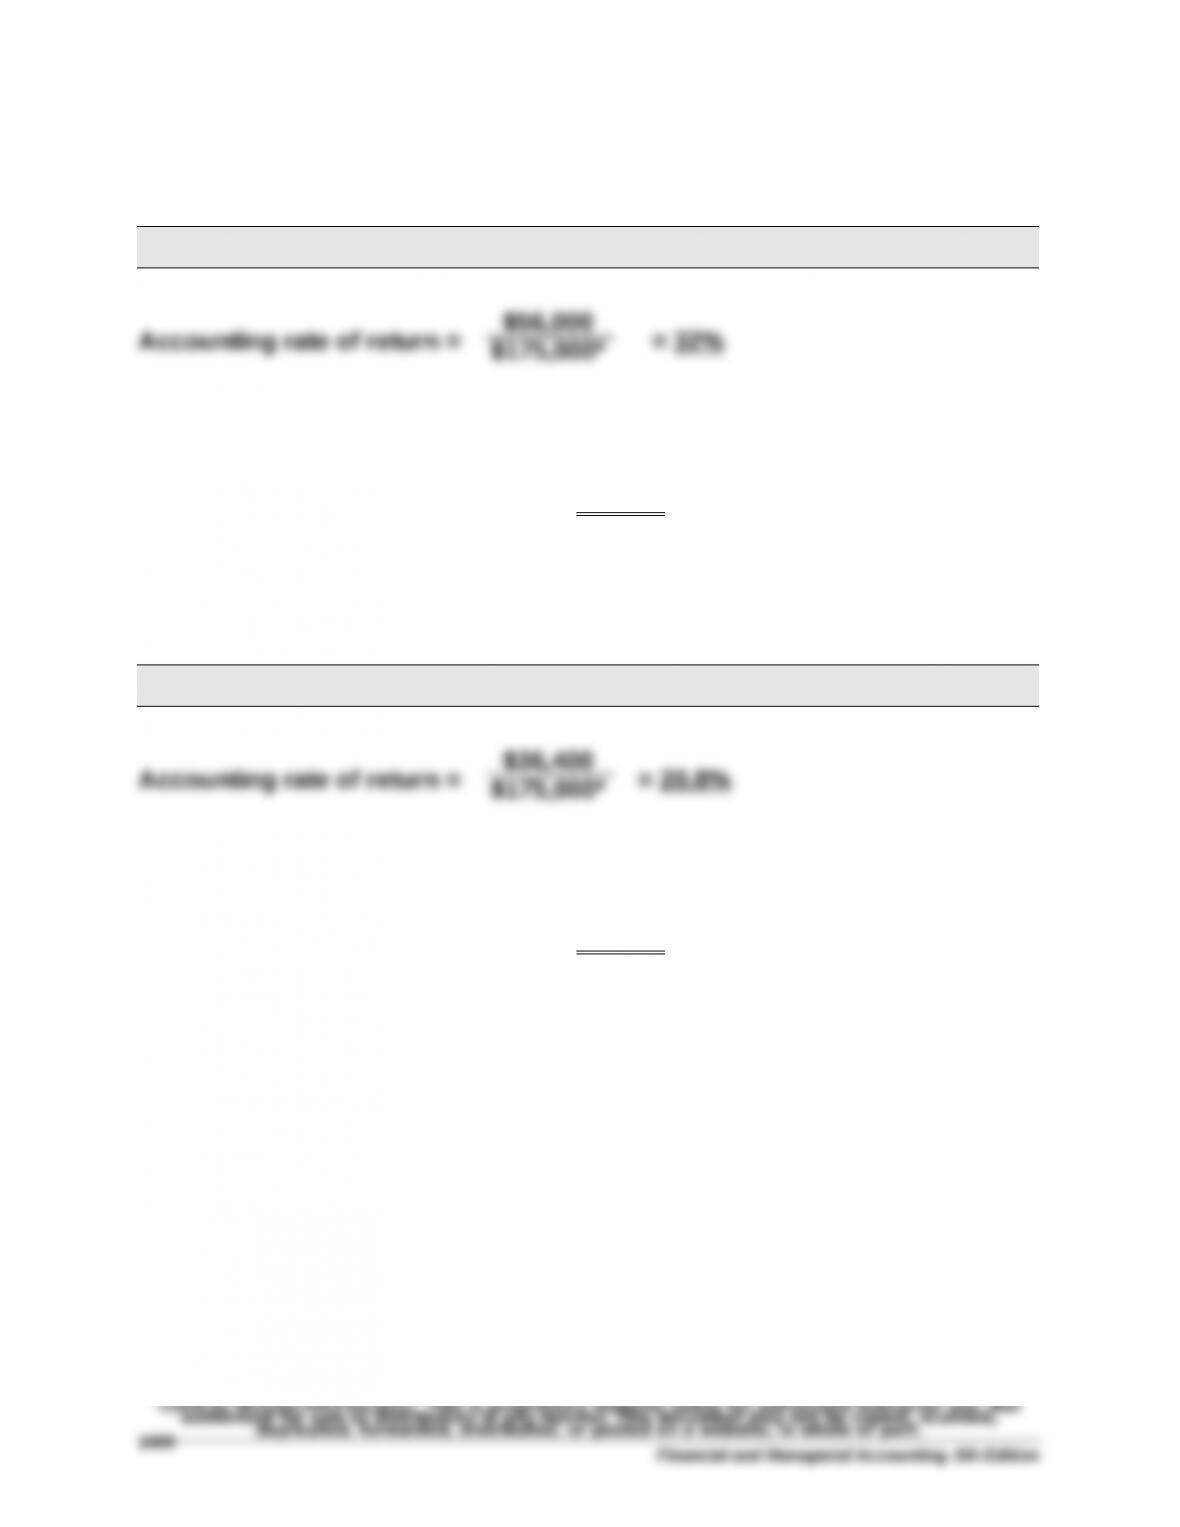
PROJECT Y
*Average investment
Asset cost……….……………..…....……....…..$350,000
Average (Cost/2)…….……....…....…..…..…..$175,000
PROJECT Z
*Average investment
Asset cost……….……………..…....……....…..$350,000
Average (Cost/2)…….……....…....…..…..…..$175,000
Financial and Managerial Accounting, 6th Edition
$56,000
$175,000*
$36,400
$175,000*
Problem 24-2A (Continued)
Part 4
PROJECT Y
Present Value of Net Cash Flows
Present Present
Value of Value of
Net Cash
Flows
1 at 8%
Annuity
Net Cash
Flows
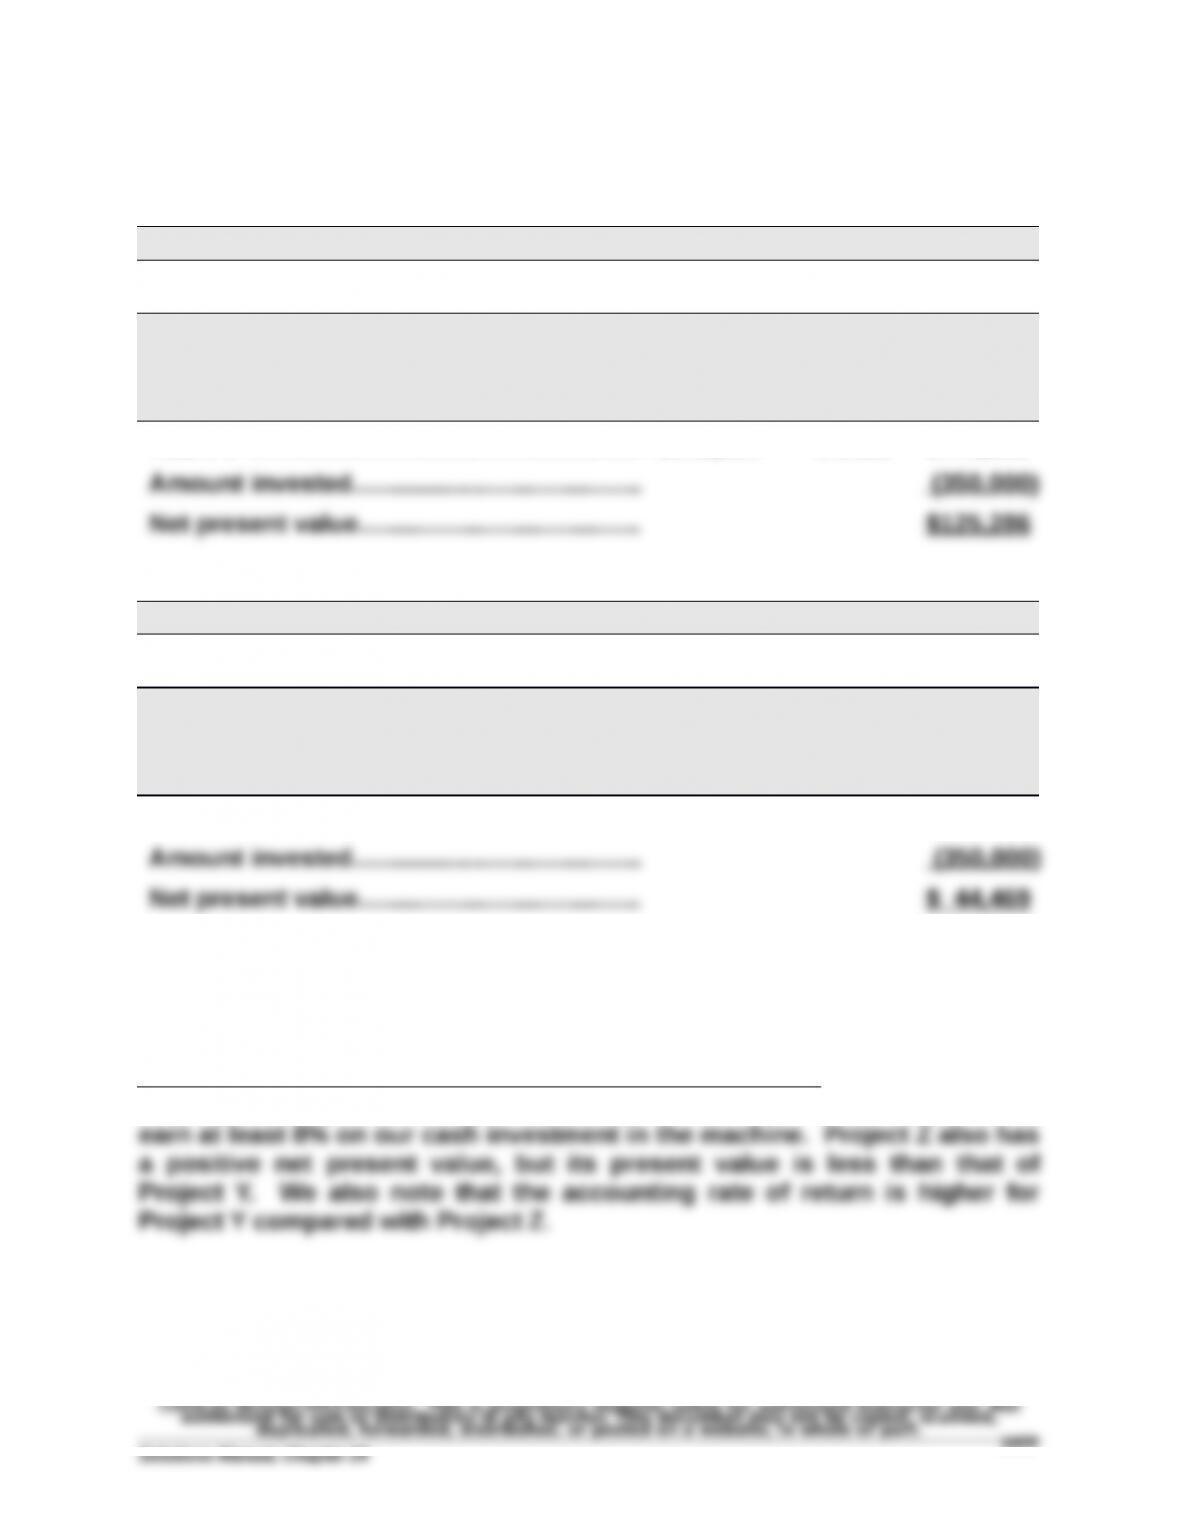
Years 1-4……………………..……………………….. $143,500 3.3121 $475,286
PROJECT Z
Present Value of Net Cash Flows
Present Present
Value of Value of
Net Cash
Flows
1 at 8%
Annuity
Net Cash
Flows
Years 1-3……………………..……………………….. $153,067 2.5771 $394,469
Part 5
Recommendation to management is to pursue Project Y. This is because
Project Y has a positive net present value, which means that we expect it to
Problem 24-3A (60 minutes)
Part 1
RESULTS USING STRAIGHT-LINE DEPRECIATION
(a)
Income
Before
Deprec.
(b)
Straight-
Line
Deprec.
(c)
Taxable
Income
(a) – (b)
(d)
40%
Income
Taxes
(e)
Net Cash
Flows
(a) – (d)
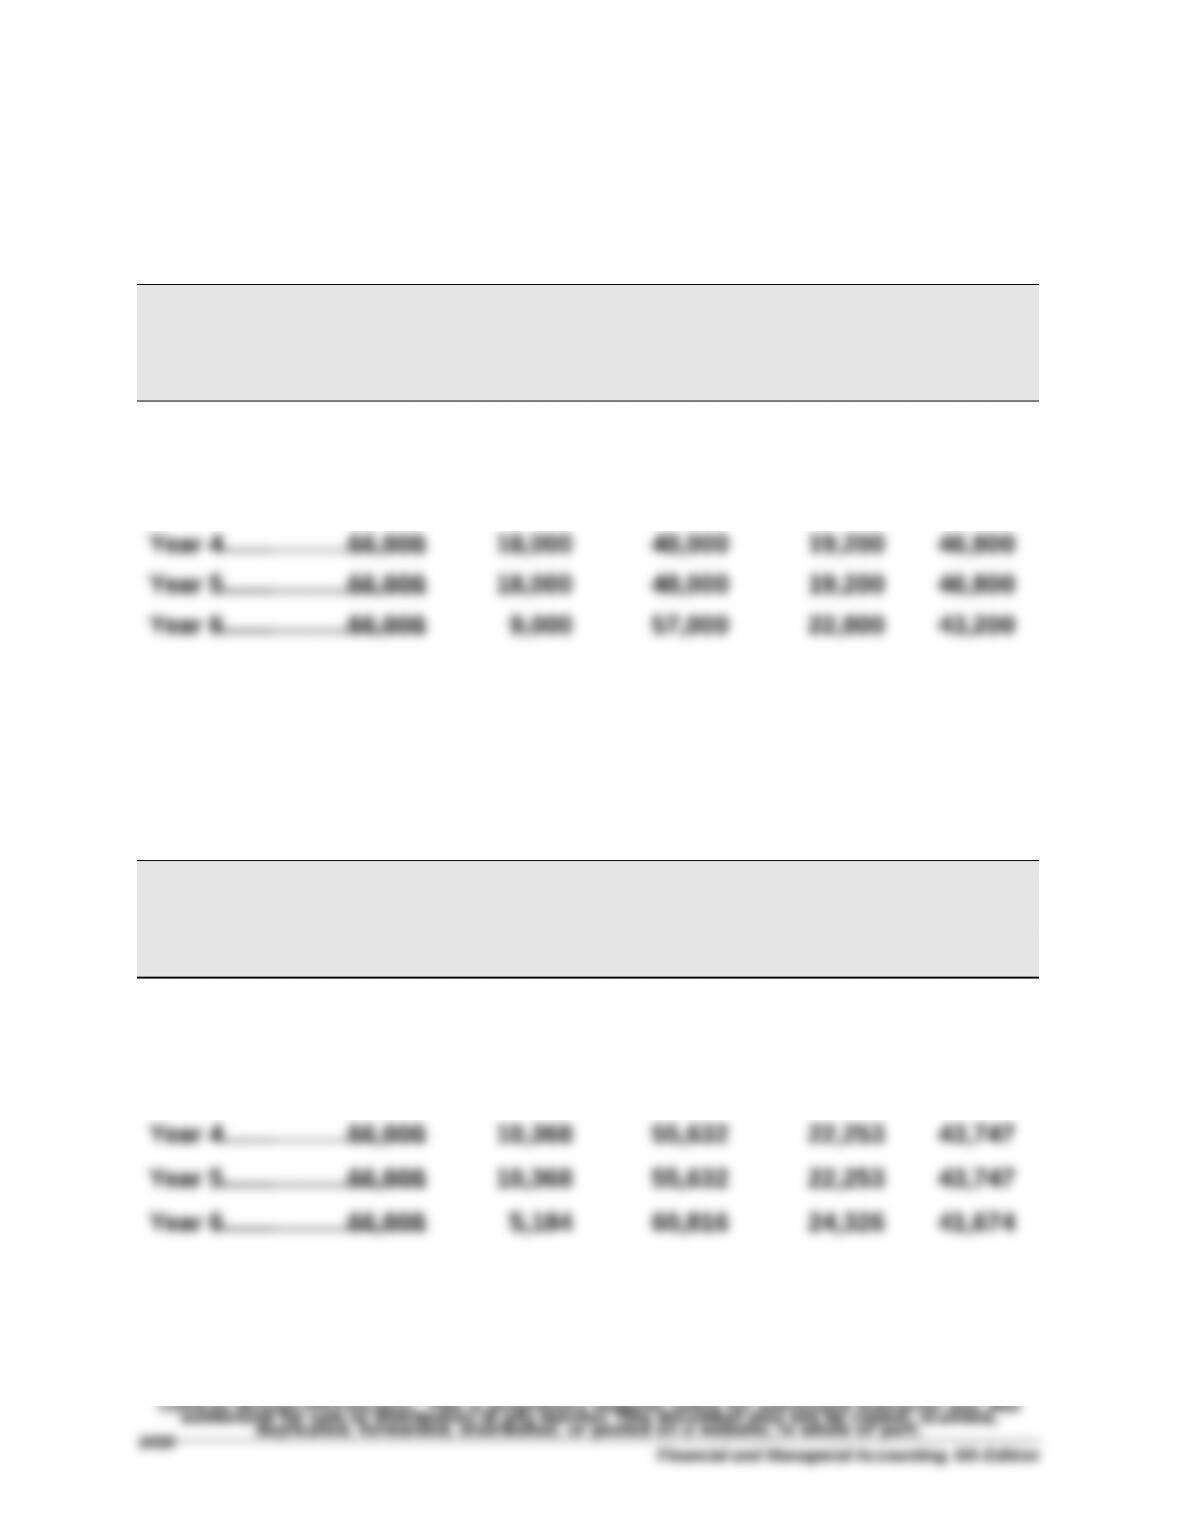
Year 1………………..….…..$66,000 $ 9,000 $57,000 $22,800 $43,200
Year 2………………..….…..66,000 18,000 48,000 19,200 46,800
Year 3………………..….…..66,000 18,000 48,000 19,200 46,800
Part 2
RESULTS USING MACRS DEPRECIATION
(a)
Income
Before
Deprec.
(b)
MACRS
Deprec.
(c)
Taxable
Income
(a) – (b)
(d)
40%
Income
Taxes
(e)
Net Cash
Flows
(a) – (d)
Year 1………………..….…..$66,000 $18,000 $48,000 $19,200 $46,800
Year 2………………..….…..66,000 28,800 37,200 14,880 51,120
Year 3………………..….…..66,000 17,280 48,720 19,488 46,512
Financial and Managerial Accounting, 6th Edition
Problem 24-3A (Continued)
Part 3
NET PRESENT VALUE OF ASSET USING STRAIGHT-LINE DEPRECIATION
Present
Present Value of
Net Cash
Flows
Value of
1 at 10%
Net Cash
Flows
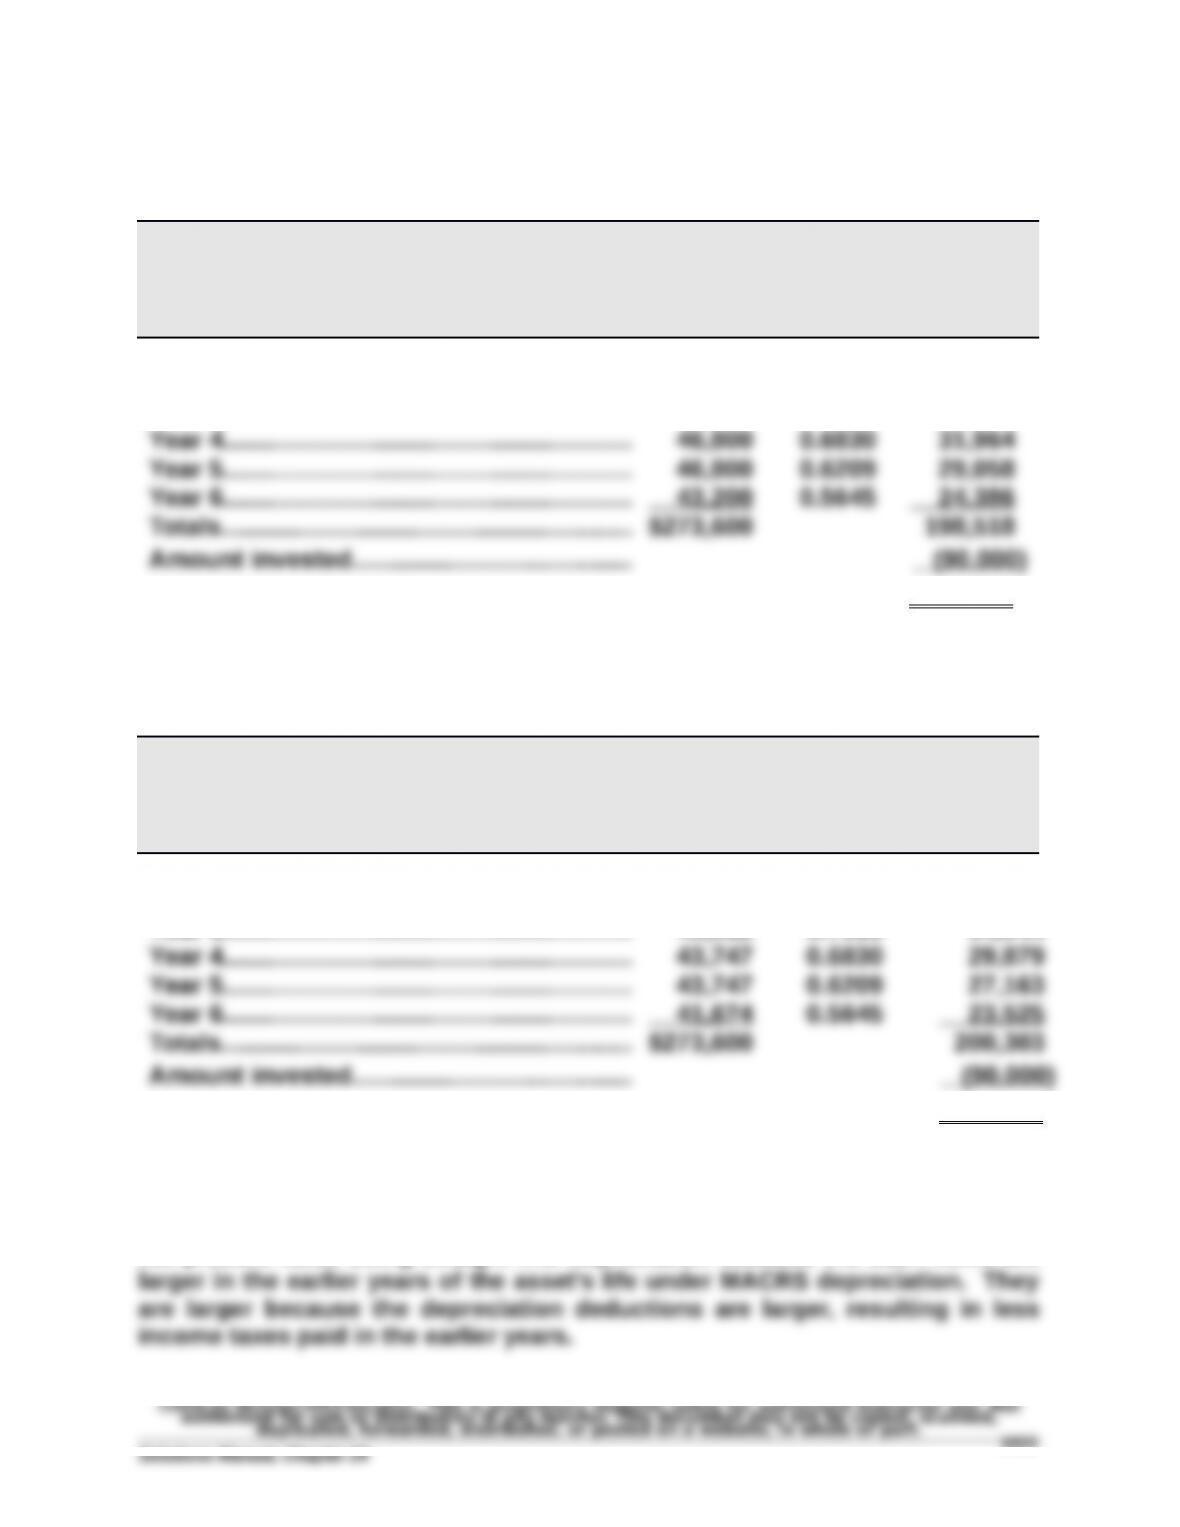
Year 1…………………….……………………………. $ 43,200 0.9091 $ 39,273
Year 2…………………….……………………………. 46,800 0.8264 38,676
Year 3…………………….……………………………. 46,800 0.7513 35,161
Net present value………………….…….….…...
$108,518
Part 4
NET PRESENT VALUE OF ASSET USING MACRS DEPRECIATION
Present
Present Value of
Net Cash
Flows
Value of
1 at 10%
Net Cash
Flows
Year 1…………………….……………………………. $ 46,800 0.9091 $ 42,546
Year 2…………………….……………………………. 51,120 0.8264 42,246
Year 3…………………….……………………………. 46,512 0.7513 34,944
Net present value
……..………………………….
$110,303
Part 5
Analysis: The net present value using MACRS depreciation is greater than the
net present value using straight-line depreciation because the cash flows are
Problem 24-4A (45 minutes)
Part 1
Alternative 1: Keep the old machine and have it overhauled
Item Period
Cash
Flow
Present
Value Factor
at 10%
Present
Value of
Cash Flows
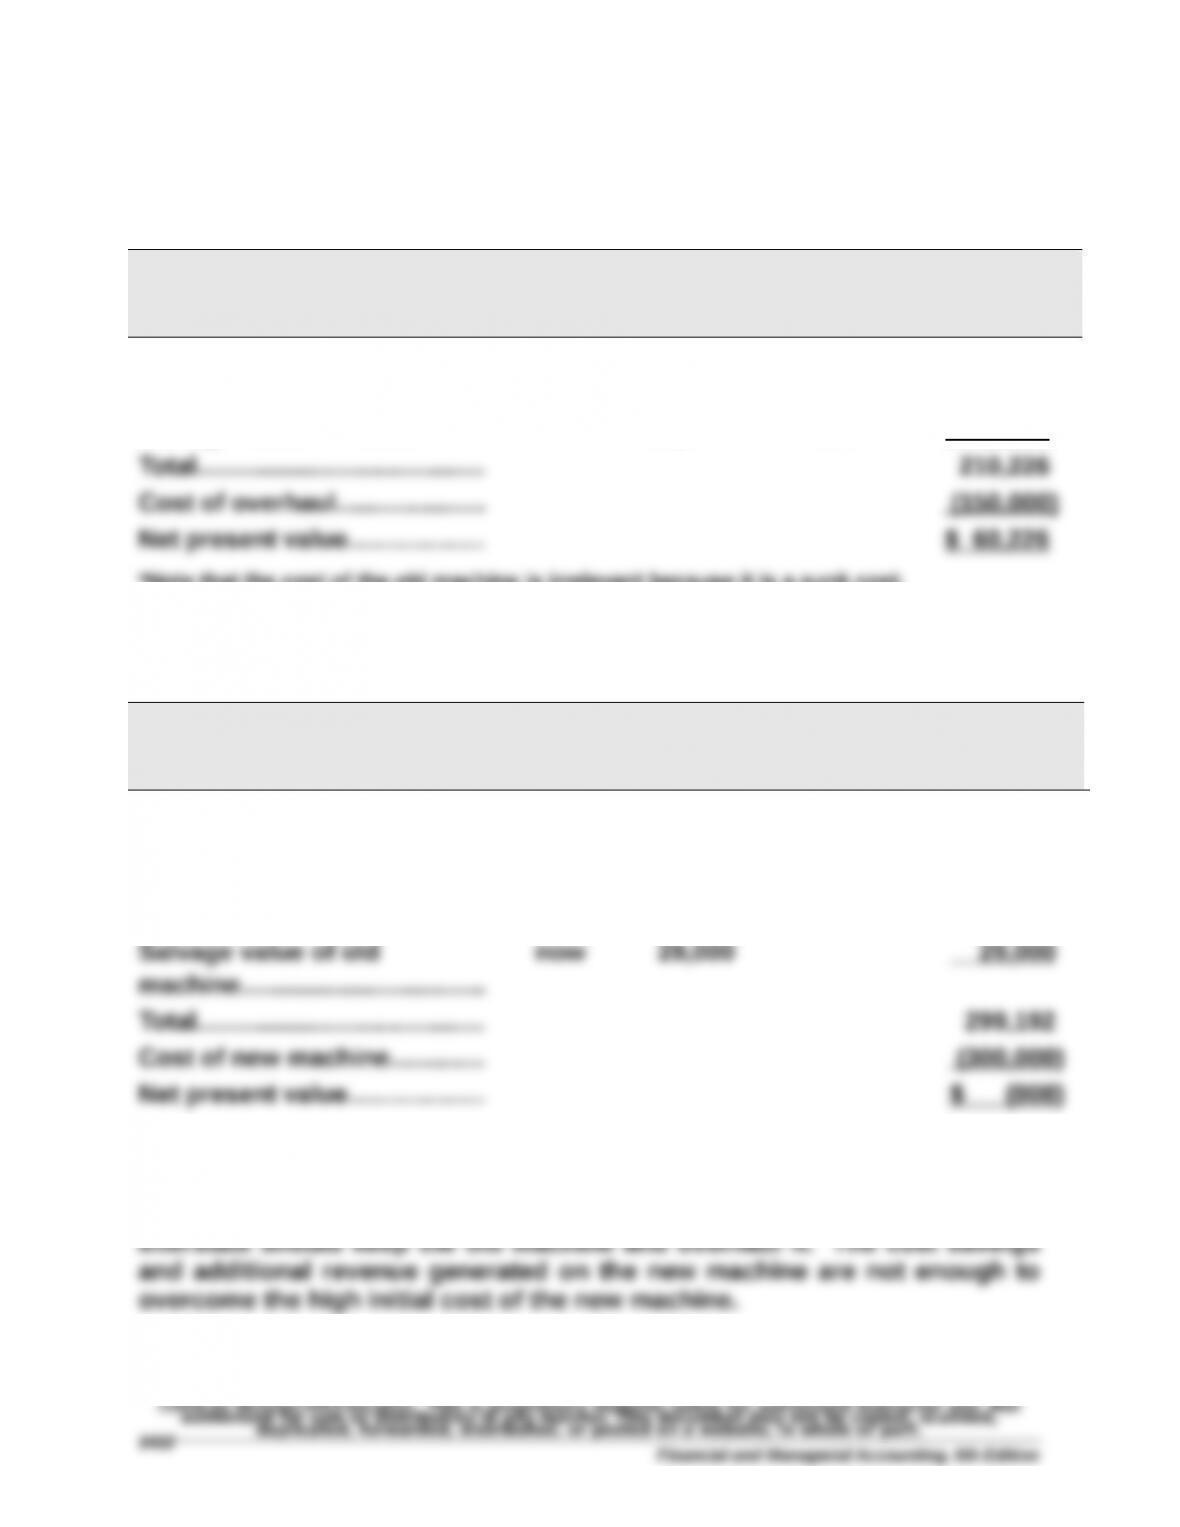
Revenues….….….….….….…..... 1 – 5 $95,000 3.7908 $360,126
Operating costs…….….….….… 1 – 5 (42,000) 3.7908 (159,214)
Salvage value…………………..… 5 15,000 0.6209 9,314
*Note that the cost of the old machine is irrelevant because it is a sunk cost.
Part 2
Alternative 2: Sell the old machine and buy a new one
Item Period
Cash
Flow
Present
Value Factor
at 10%
Present
Value of
Cash Flows
Revenues….….….….….….…..... 1 – 5 $100,000 3.7908 $379,080
Operating costs…….….….….… 1 – 5 (32,000) 3.7908 (121,306)
Salvage value of new
machine………………....….….…..
5 20,000 0.6209 12,418
Part 3
Financial and Managerial Accounting, 6th Edition
Problem 24-5A (40 minutes)
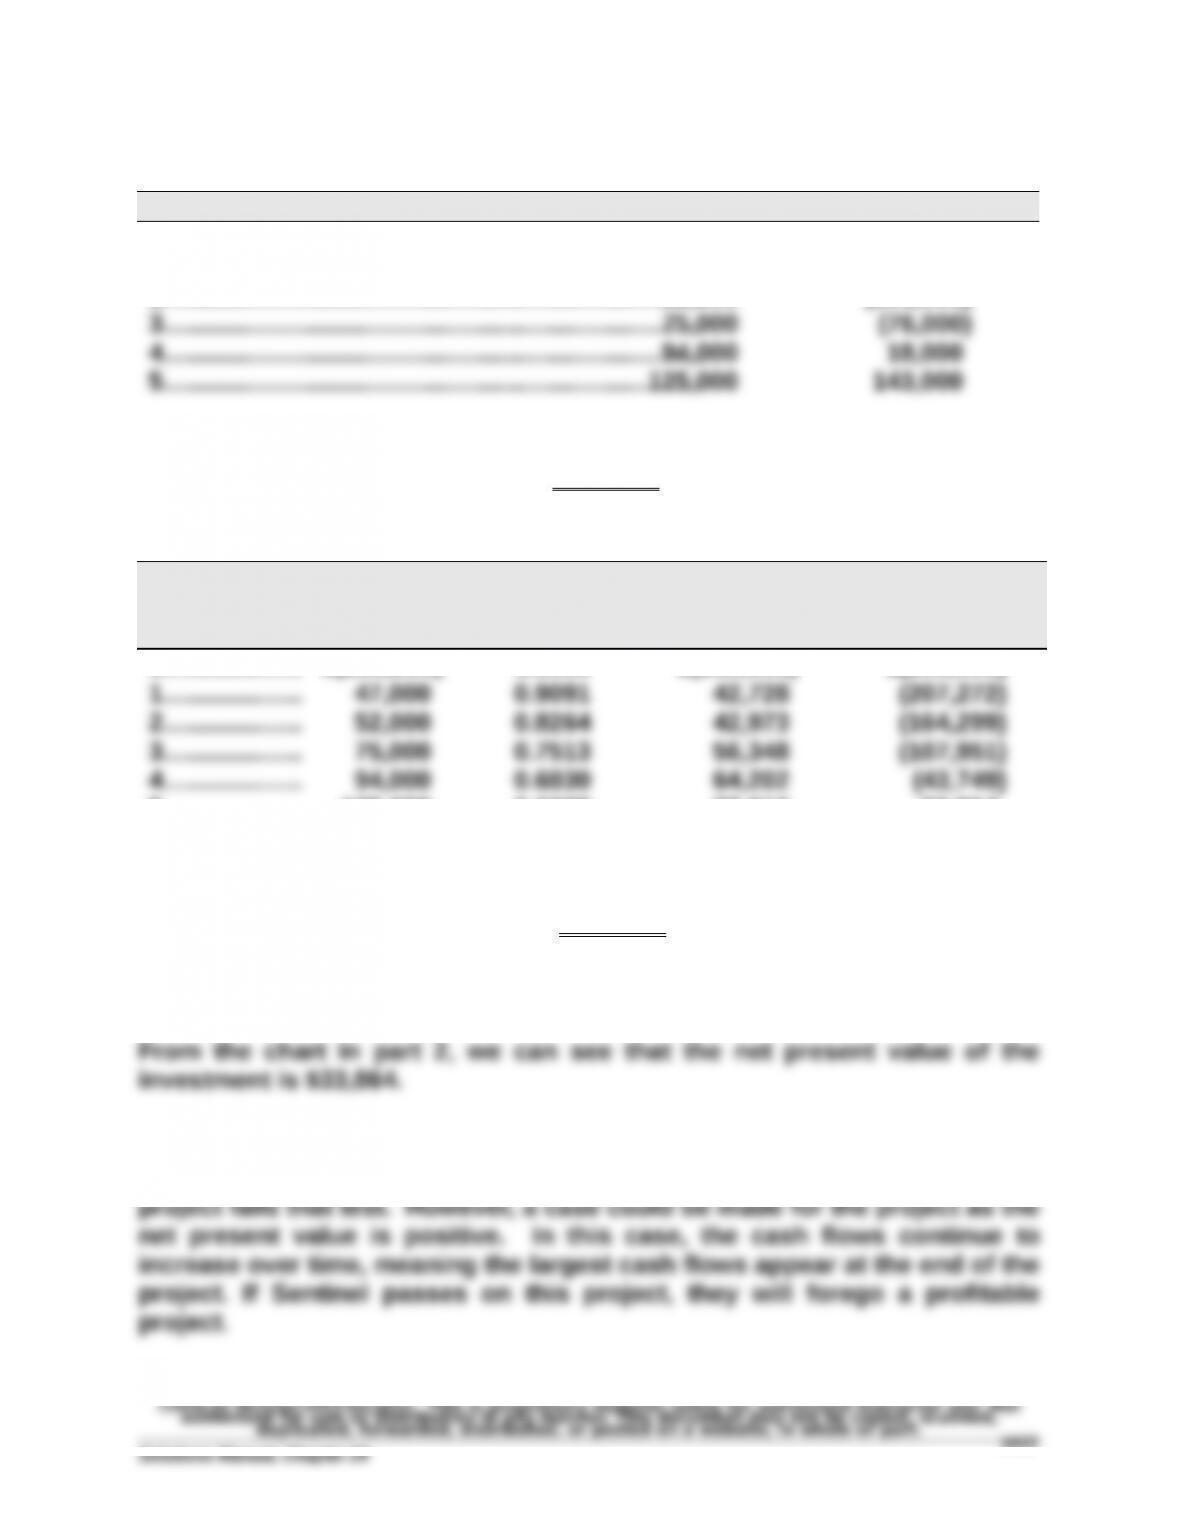
Part 1: Payback period
Period Cash flow Cumulative cash flow
0………………………………………….…..….….….….….…$(250,000) $(250,000)
1………………………………………….…..….….….….….…47,000 (203,000)
2………………………………………….…..….….….….….…52,000 (151,000)
$76,000 / $94,000 = 0.8 (rounded)
The payback period is about 3.8 years.
Part 2: Break-even time
Period Cash Flow
Present Value
of 1 at 10%
Present Value
of Cash Flows
Cumulative
Present Value
of Cash Flows
0……………..… $(250,000) 1.0000 $(250,000) $(250,000)
5……………..… 125,000 0.6209 77,613 33,864
$43,749 / $77,613 = 0.6 (rounded)
The break-even time is about 4.6 years.
Part 3: Net present value
Part 4
If the company requires a payback period of 3 years for any project, this
Problem 24-6A (40 minutes)
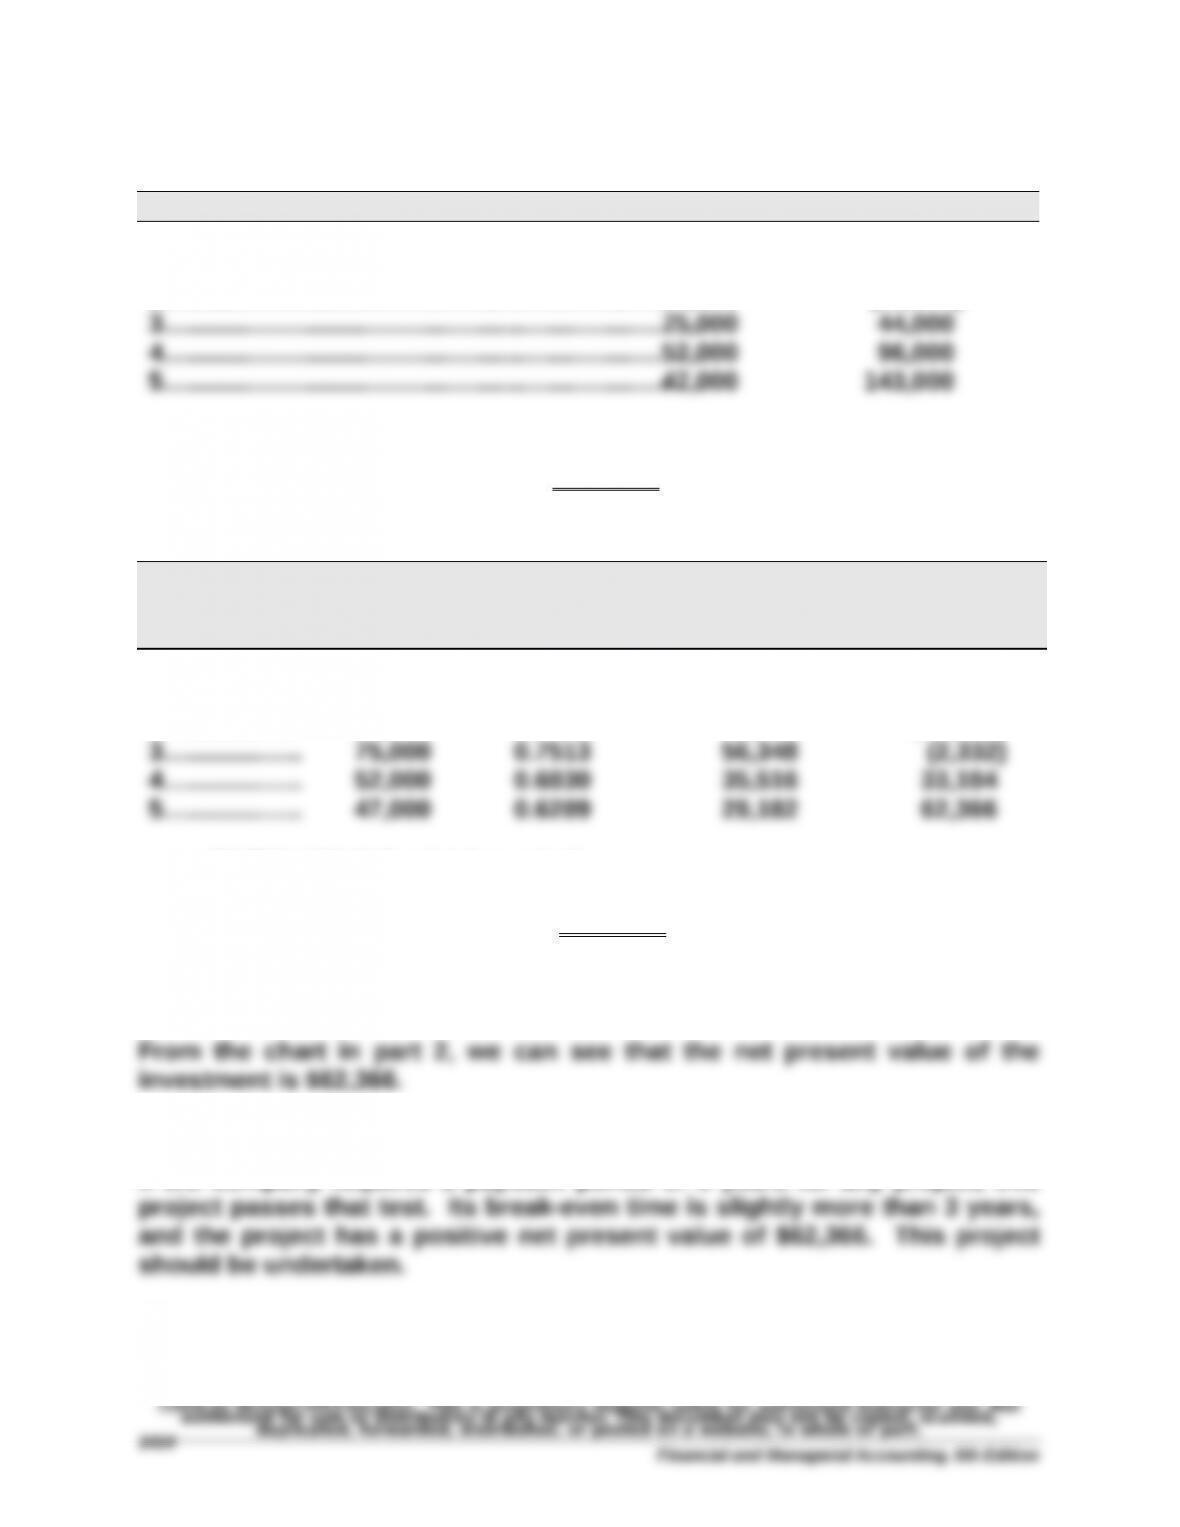
Part 1: Payback period
Period Cash flow Cumulative cash flow
0………………………………………….…..….….….….….…$(250,000) $(250,000)
1………………………………………….…..….….….….….…125,000 (125,000)
2………………………………………….…..….….….….….…94,000 (31,000)
$31,000 / $75,000 = 0.4 (rounded)
The payback period is about 2.4 years.
Part 2: Break-even time
Period Cash Flow
Present Value
of 1 at 10%
Present Value
of Cash Flows
Cumulative
Present Value
of Cash Flows
0……………..… $(250,000) 1.0000 $(250,000) $(250,000)
1……………..… 125,000 0.9091 113,638 (136,362)
2……………..… 94,000 0.8264 77,682 (58,680)
$2,332 / $35,516 = 0.1 (rounded)
The break-even time is about 3.1 years.
Part 3: Net present value
Part 4
If the company requires a payback period of 3 years for any project, this
Financial and Managerial Accounting, 6th Edition