Exercise 24-5 (20 minutes)
a.
Payback period = = = 2.21 years
where
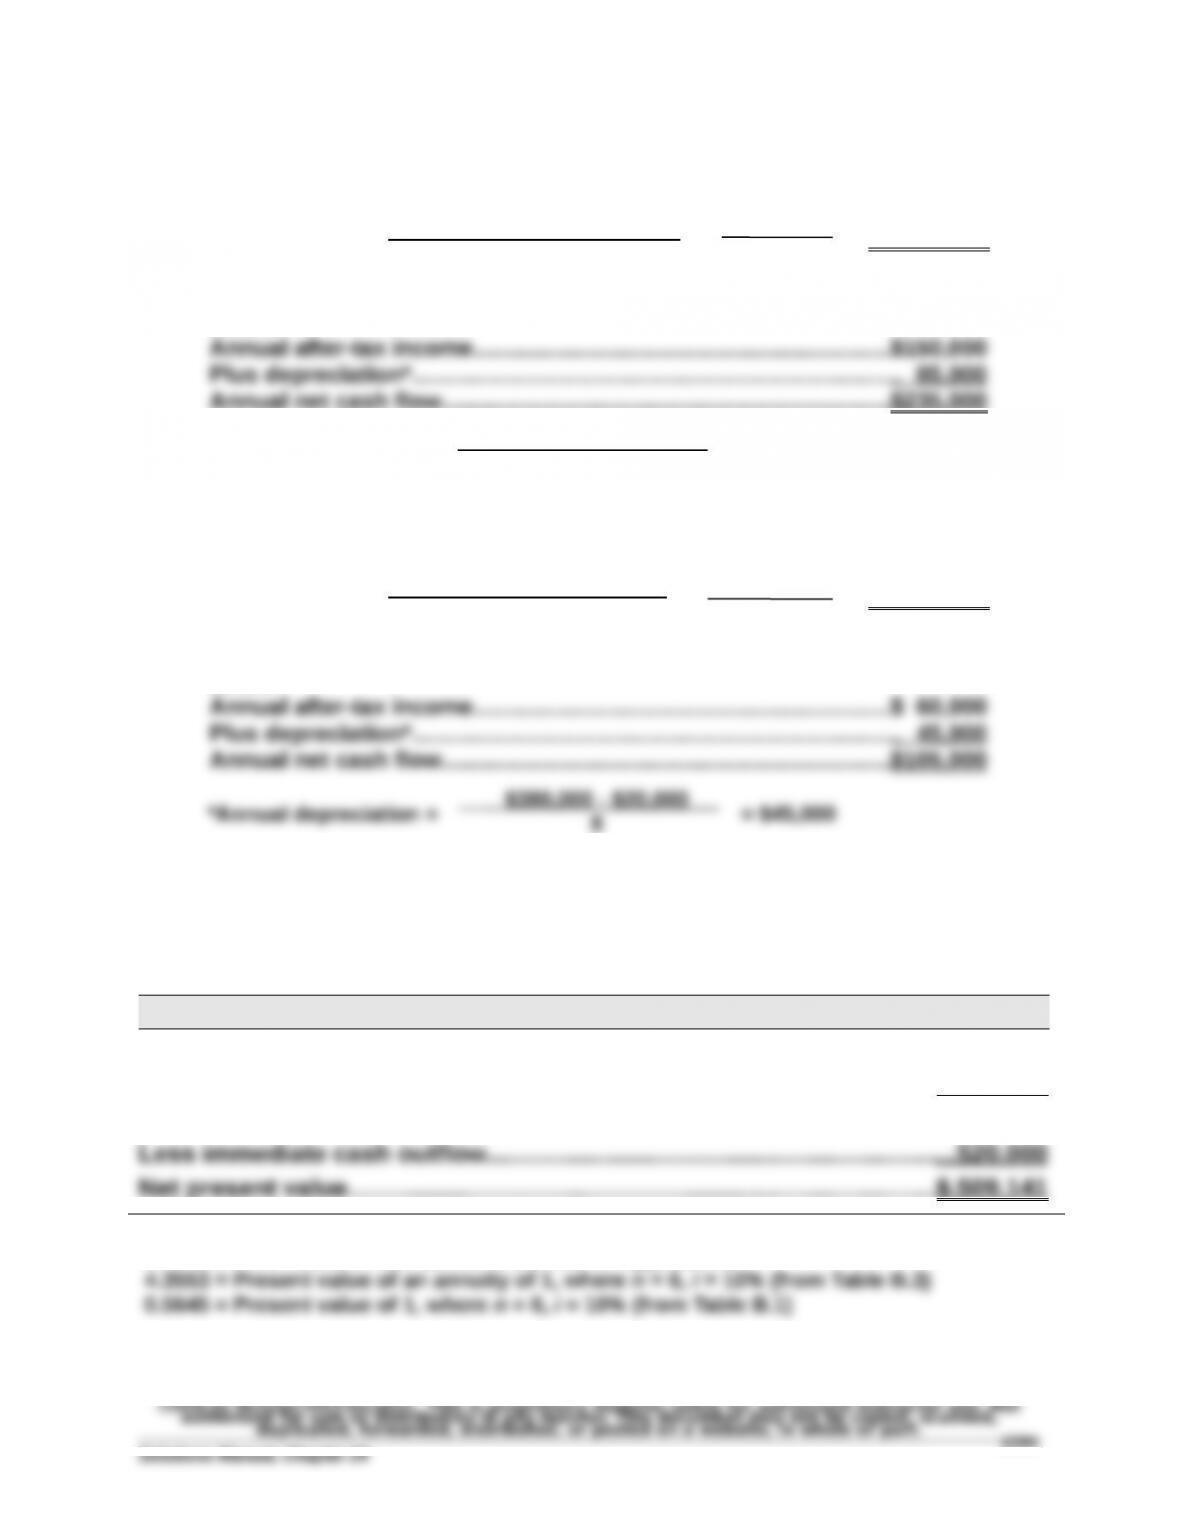
Annual net cash flow……..…….……..……..…..……..……..………………..$235,000
*Annual depreciation = = $85,000
b.
Payback period = = = 3.62 years
where
Exercise 24-6 (20 minutes)
a.
Net present value of investment*
Present value of six $235,000** cash inflows ($235,000 x 4.3553)..........
$1,023,496
Present value of $10,000 at end of six years ($10,000 x 0.5645)………….. 5,645
Present value of cash inflows………………………………..……………….….….…. 1,029,411
*Present value factors from tables at the end of Appendix B:
**Cash inflow = net income + straight-line depreciation, $150,000 + $85,000
Cost of investment
Annual net cash flow
$520,000
$235,000
$520,000 – $10,000
6
$380,000
$105,000
Cost of investment
Annual net cash flow
Exercise 24-6 (continued)
b.
Net present value of investment*
Present value of eight $105,000** cash inflows ($105,000 x 5.3349)….....$560,165
Present value of $20,000 at end of eight years ($20,000 x 0.4665)…....... 9,330
*Present value factors from tables at the end of Appendix B:
5.3349 = Present value of an annuity of 1, where n = 8, i = 10% (from Table B.3)
0.4665 = Present value of 1, where n = 8, i = 10% (from Table B.1)
**Cash inflow = net income + straight-line depreciation, $60,000 + $45,000
Exercise 24-7 (15 minutes)
Financial and Managerial Accounting, 6th Edition
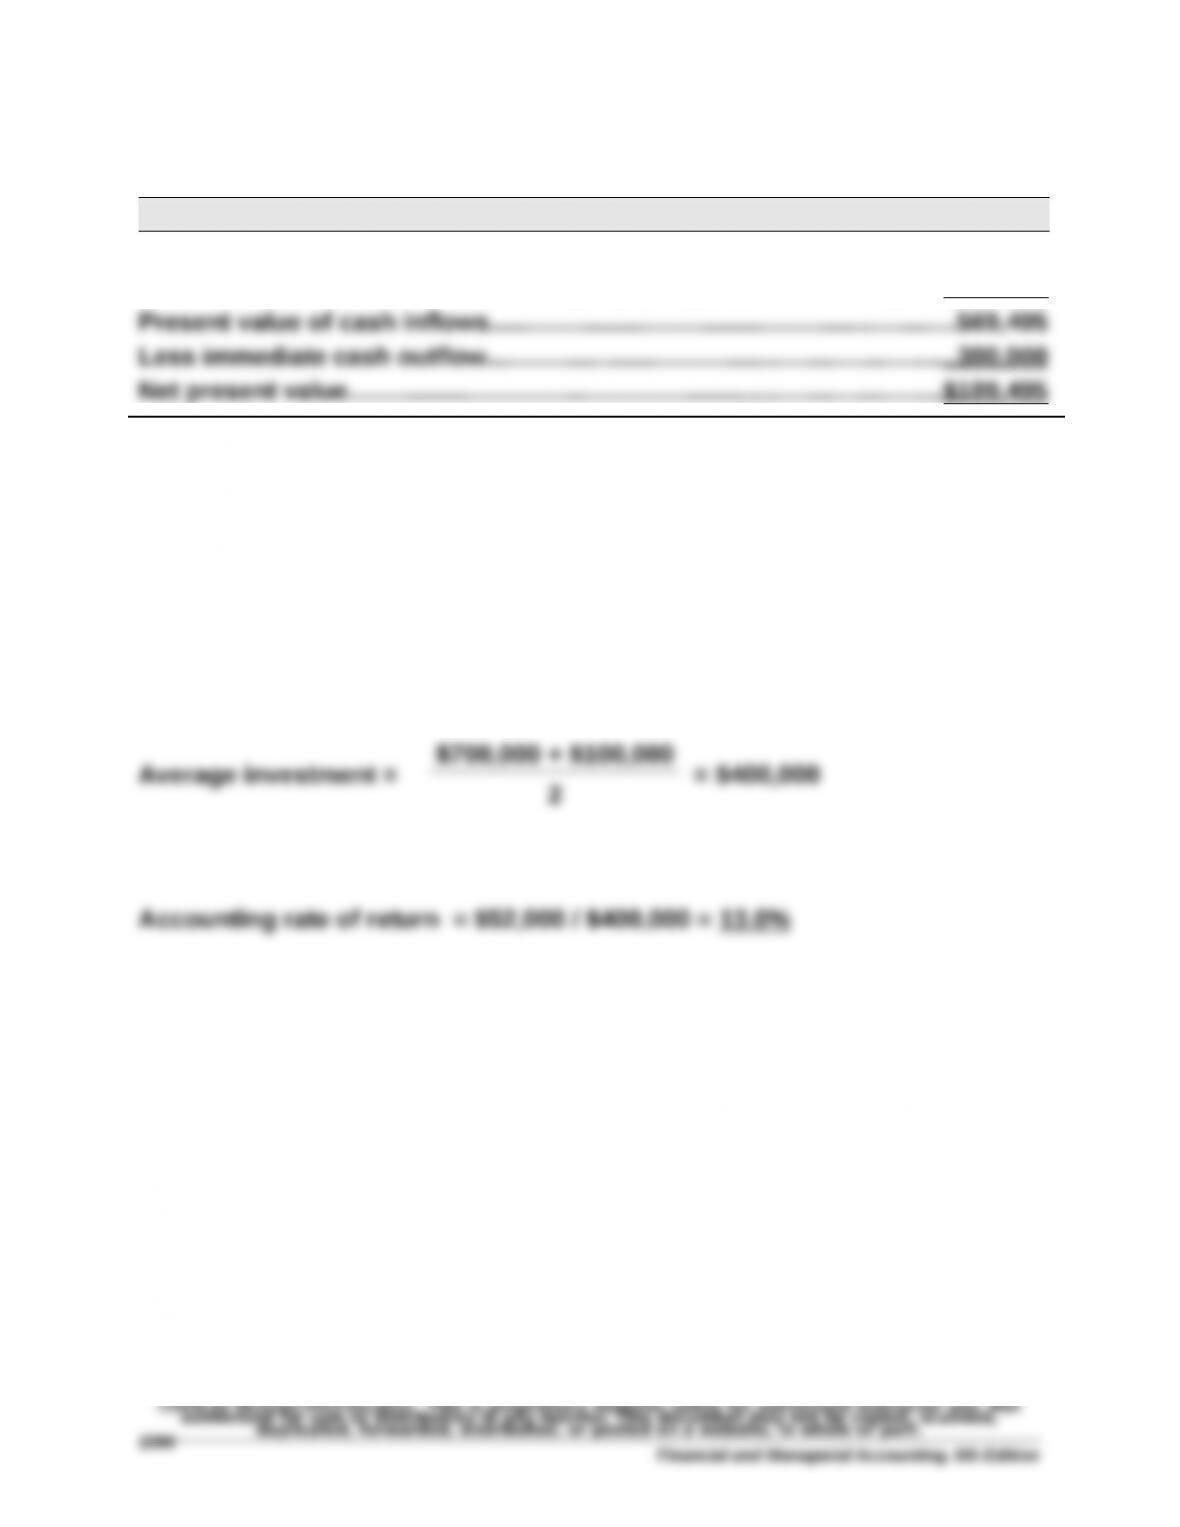
$700,000 + $100,000
Exercise 24-8 (20 minutes)
COMPUTING NET CASH FLOWS FROM NET INCOME
Net income Cash flows
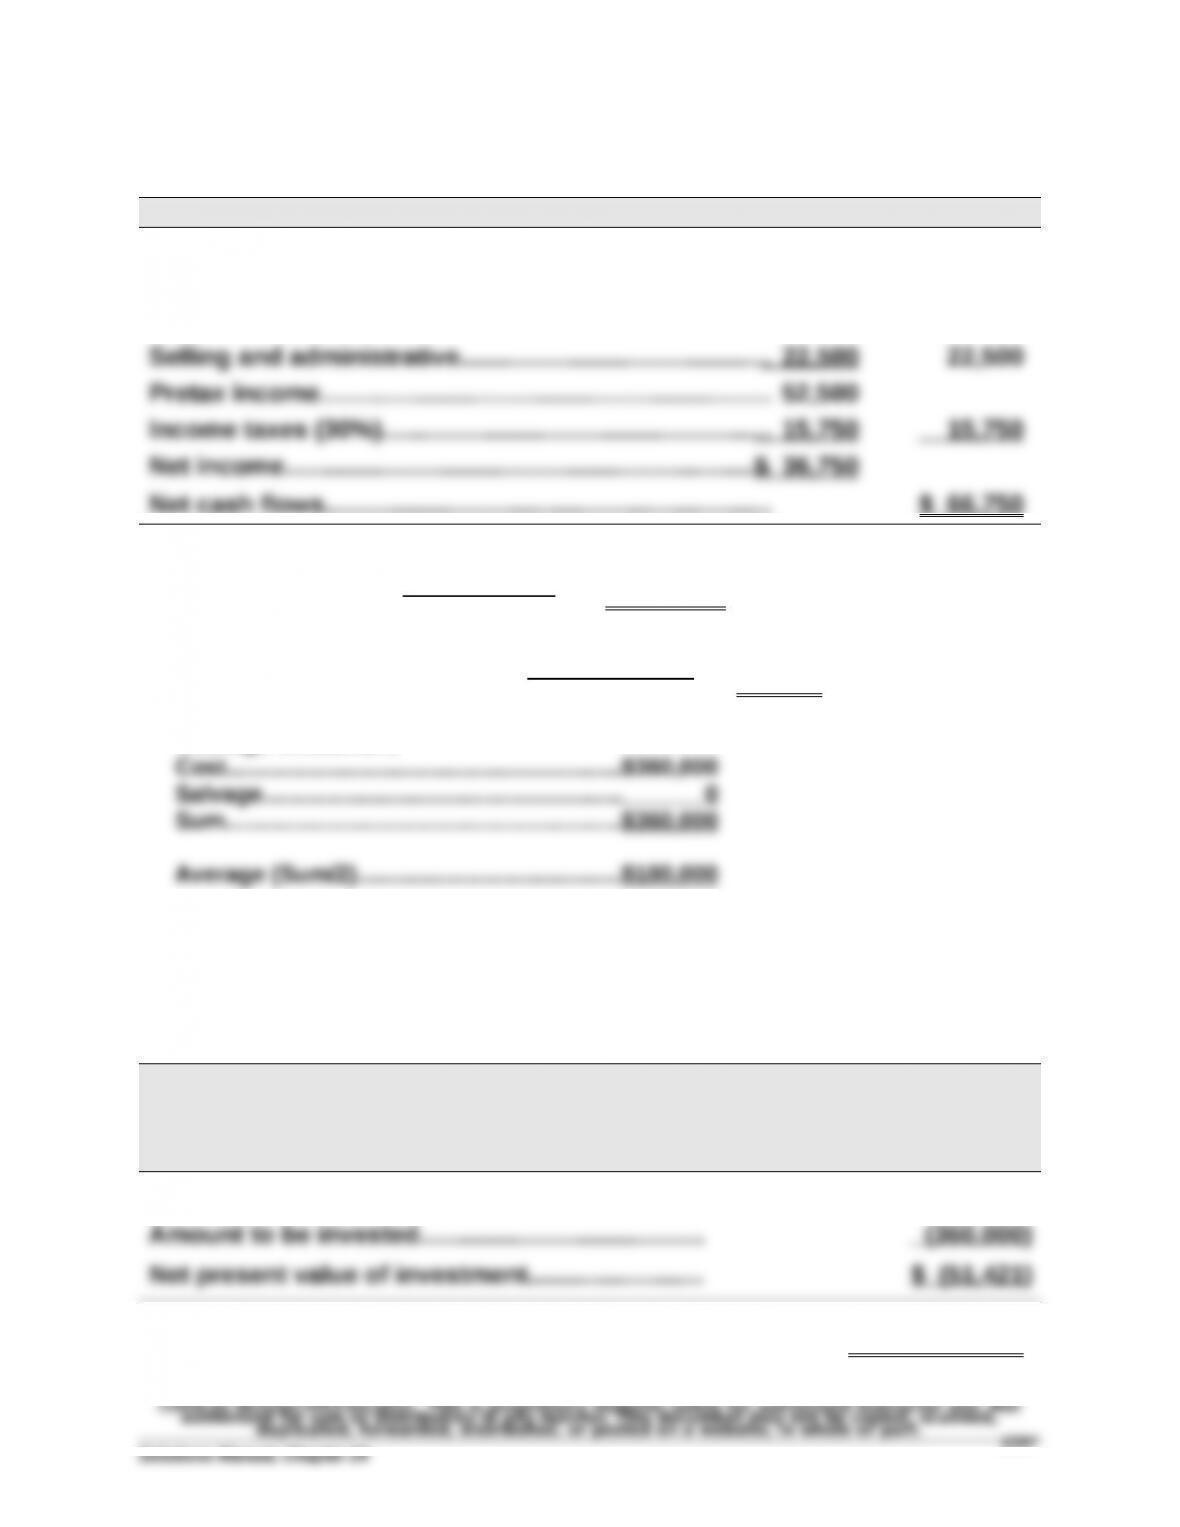
Sales……………..………………………………….…………….….…$225,000 $225,000
Materials, labor & overhead…………….…………….….…...120,000 120,000
Depreciation……….…………………………..…….….….…….… 30,000
1. Payback period = = 5.39 years
2. Accounting rate of return = = 20.42%
*Average investment
Exercise 24-9 (15 minutes)
Annual
Net Cash
Flows
Present
Value of
Annuity
at 8%
Present
Value of
Net Cash
Flows
Years 1 through 6………………………..….….….….….$ 66,750 4.6229 $ 308,579
Based on this net present value analysis, the investment is not acceptable.
$360,000
$66,750
$36,750
$180,000*
Exercise 24-10 (20 minutes)
PROJECT A
Net Cash
Flows
Present
Value of
1 at 10%
Present
Value of
Net Cash
Flows
Year 1…………………………………………………………...$ 40,000 0.9091 $ 36,364
Year 2…………………………………………………………...56,000 0.8264 46,278
Year 3…………………………………………………………...80,295 0.7513 60,326
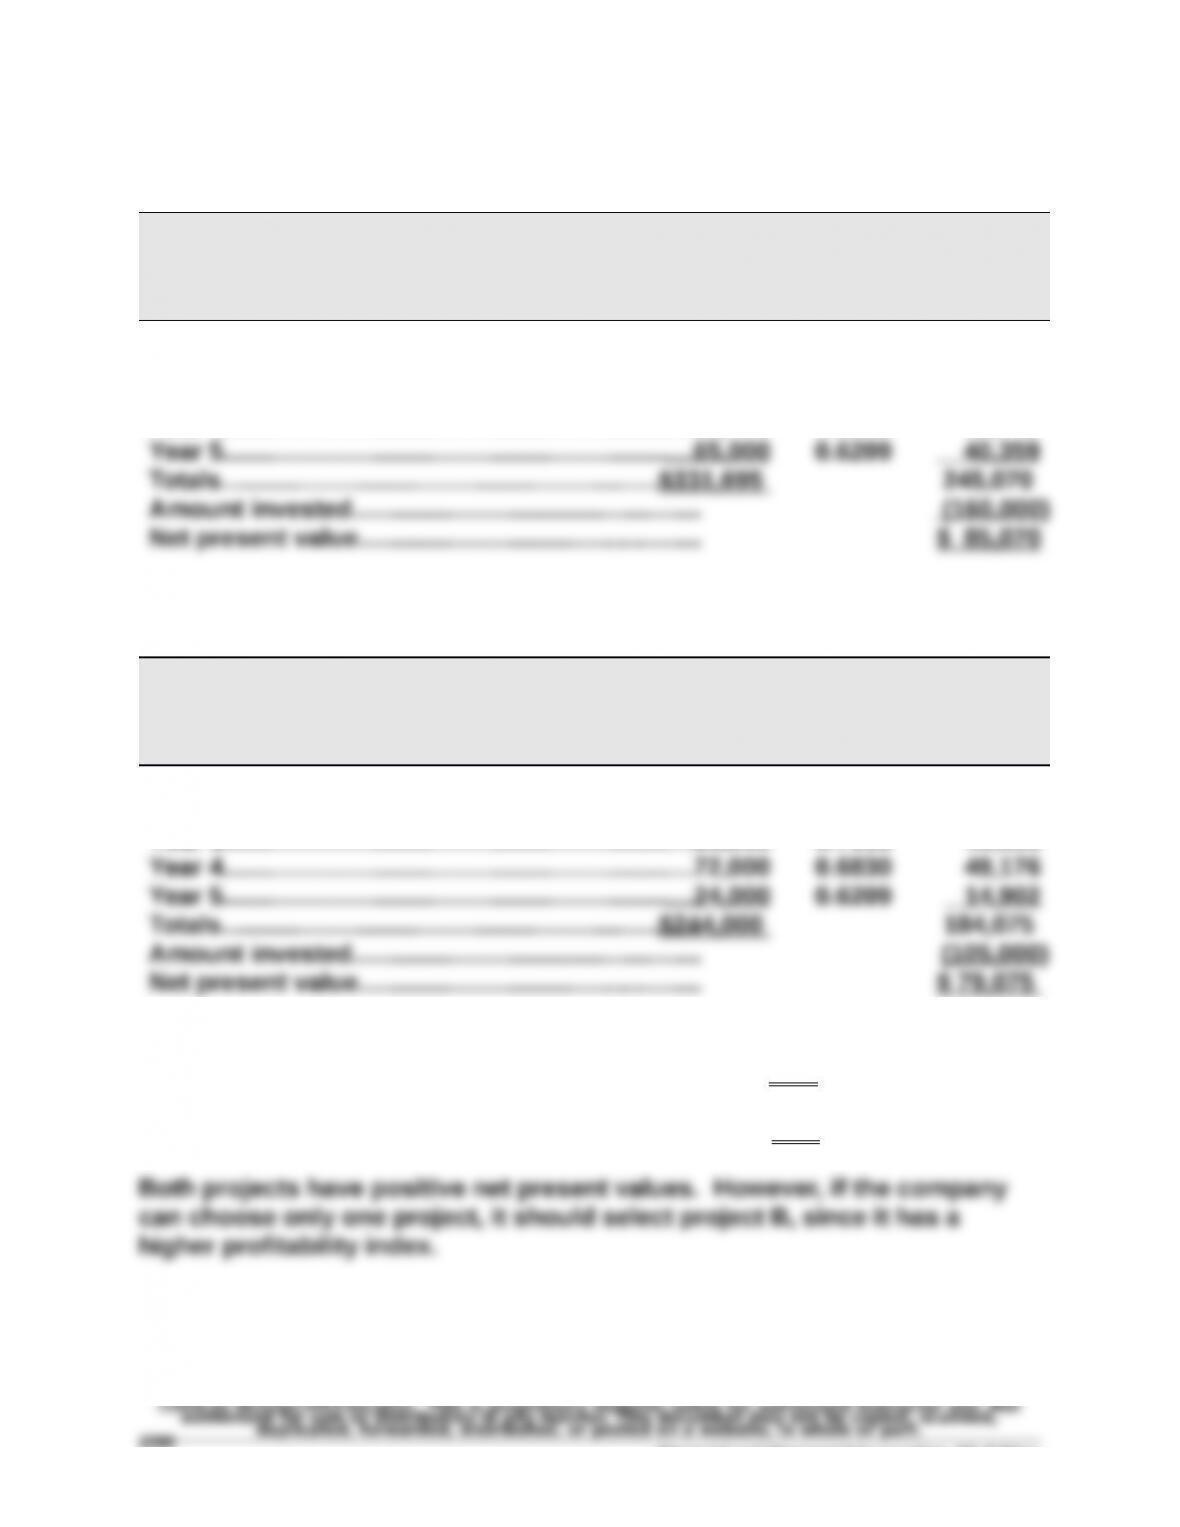
Year 4…………………………………………………………...90,400 0.6830 61,743
PROJECT B
Net Cash
Flows
Present
Value of
1 at 10%
Present
Value of
Net Cash
Flows
Year 1…………………………………………………………... $ 32,000 0.9091 $ 29,091
Year 2…………………………………………………………...50,000 0.8264 41,320
Year 3…………………………………………………………...66,000 0.7513 49,586
Project A’s profitability index = $245,070 / $160,000 = 1.53
Project B’s profitability index = $184,075 / $105,000 = 1.75
Financial and Managerial Accounting, 6th Edition
1398
Exercise 24-11 (25 minutes)
a.
Project X1 Net Cash
Flows
Present
Value of
1 at 4%
Present
Value of
Net Cash
Flows
Year 1…………………………………………………………...$ 25,000 0.9615 $ 24,038
Year 2…………………………………………………………...35,500 0.9246 32,823
Project X2 Net Cash
Flows
Present
Value of
1 at 4%
Present
Value of
Net Cash
Flows
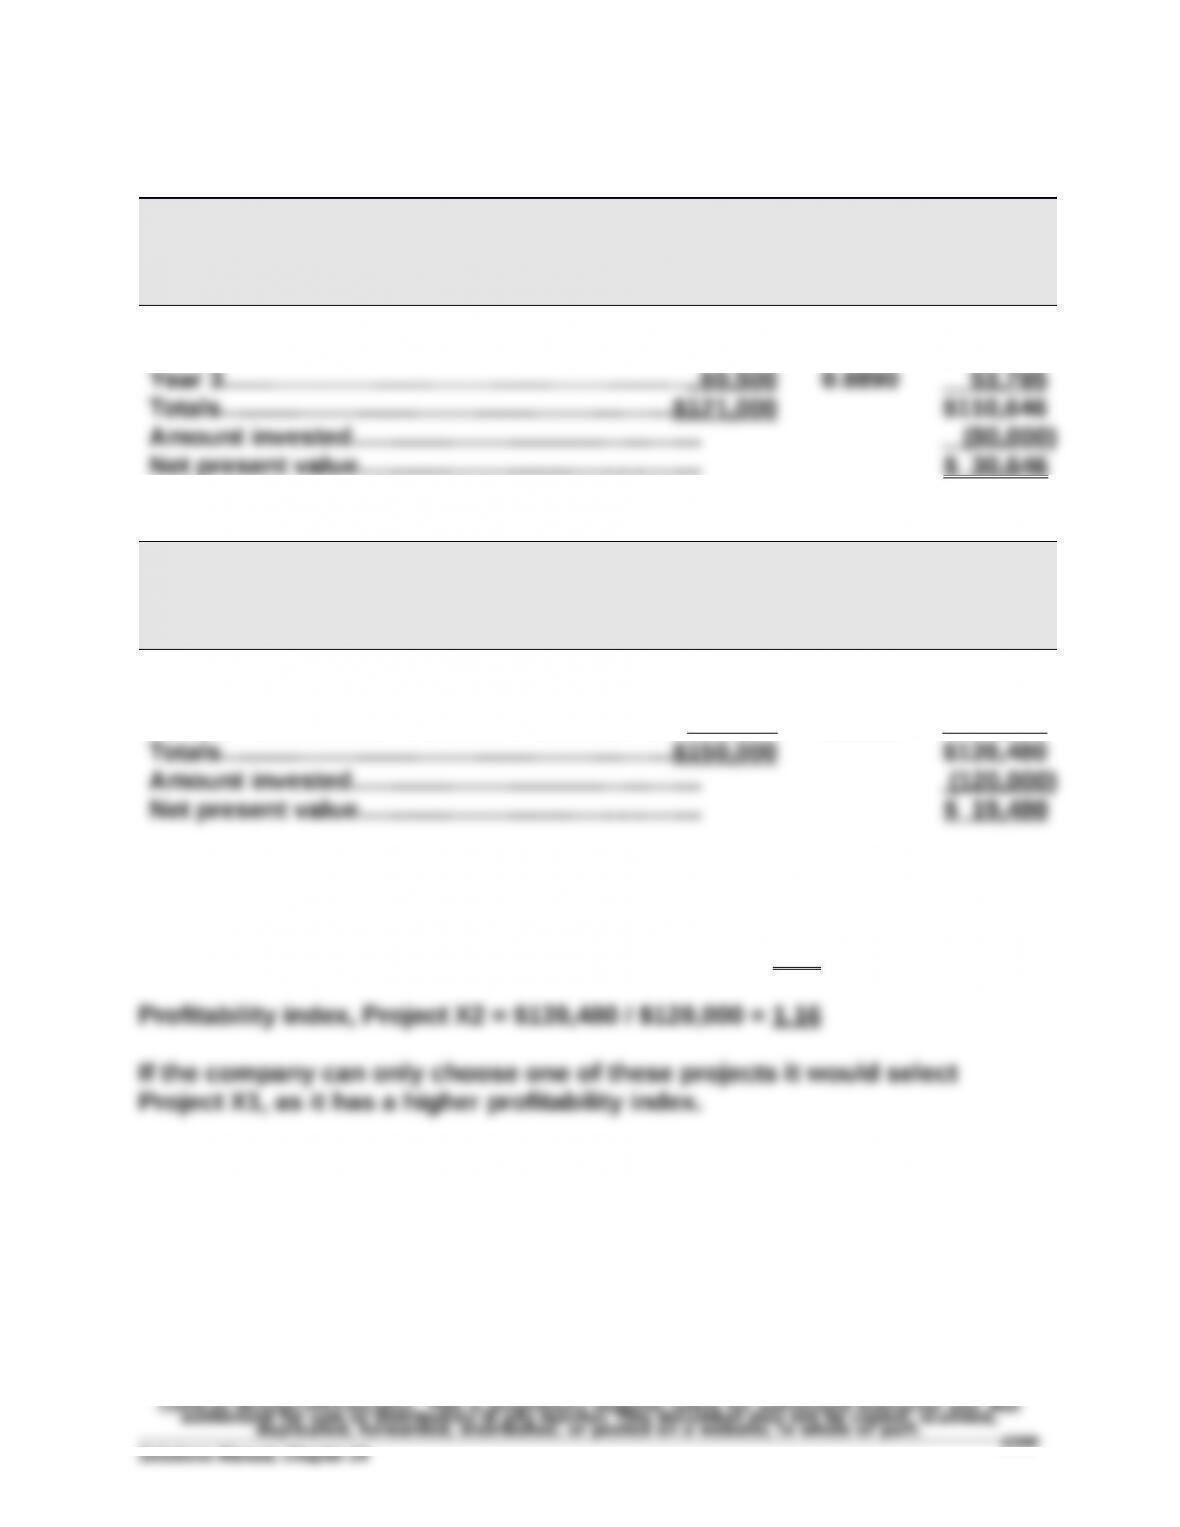
Year 1…………………………………………………………...$ 60,000 0.9615 $ 57,690
Year 2…………………………………………………………...50,000 0.9246 46,230
Year 3…………………………………………………………... 40,000 0.8890 35,560
b.
Profitability index, Project X1 = $110,646 / $80,000 = 1.38
Exercise 24-12 (25 minutes)
a.
Project X1 Net Cash
Flows
Present
Value of
1 at 12%
Present
Value of
Net Cash
Flows
Year 1…………………………………………………………...$ 25,000 0.8929 $ 22,323
Year 2…………………………………………………………...35,500 0.7972 28,301
Year 3…………………………………………………………... 60,500 0.7118 43,064
Project X2 Net Cash
Flows
Present
Value of
1 at 4%
Present
Value of
Net Cash
Flows
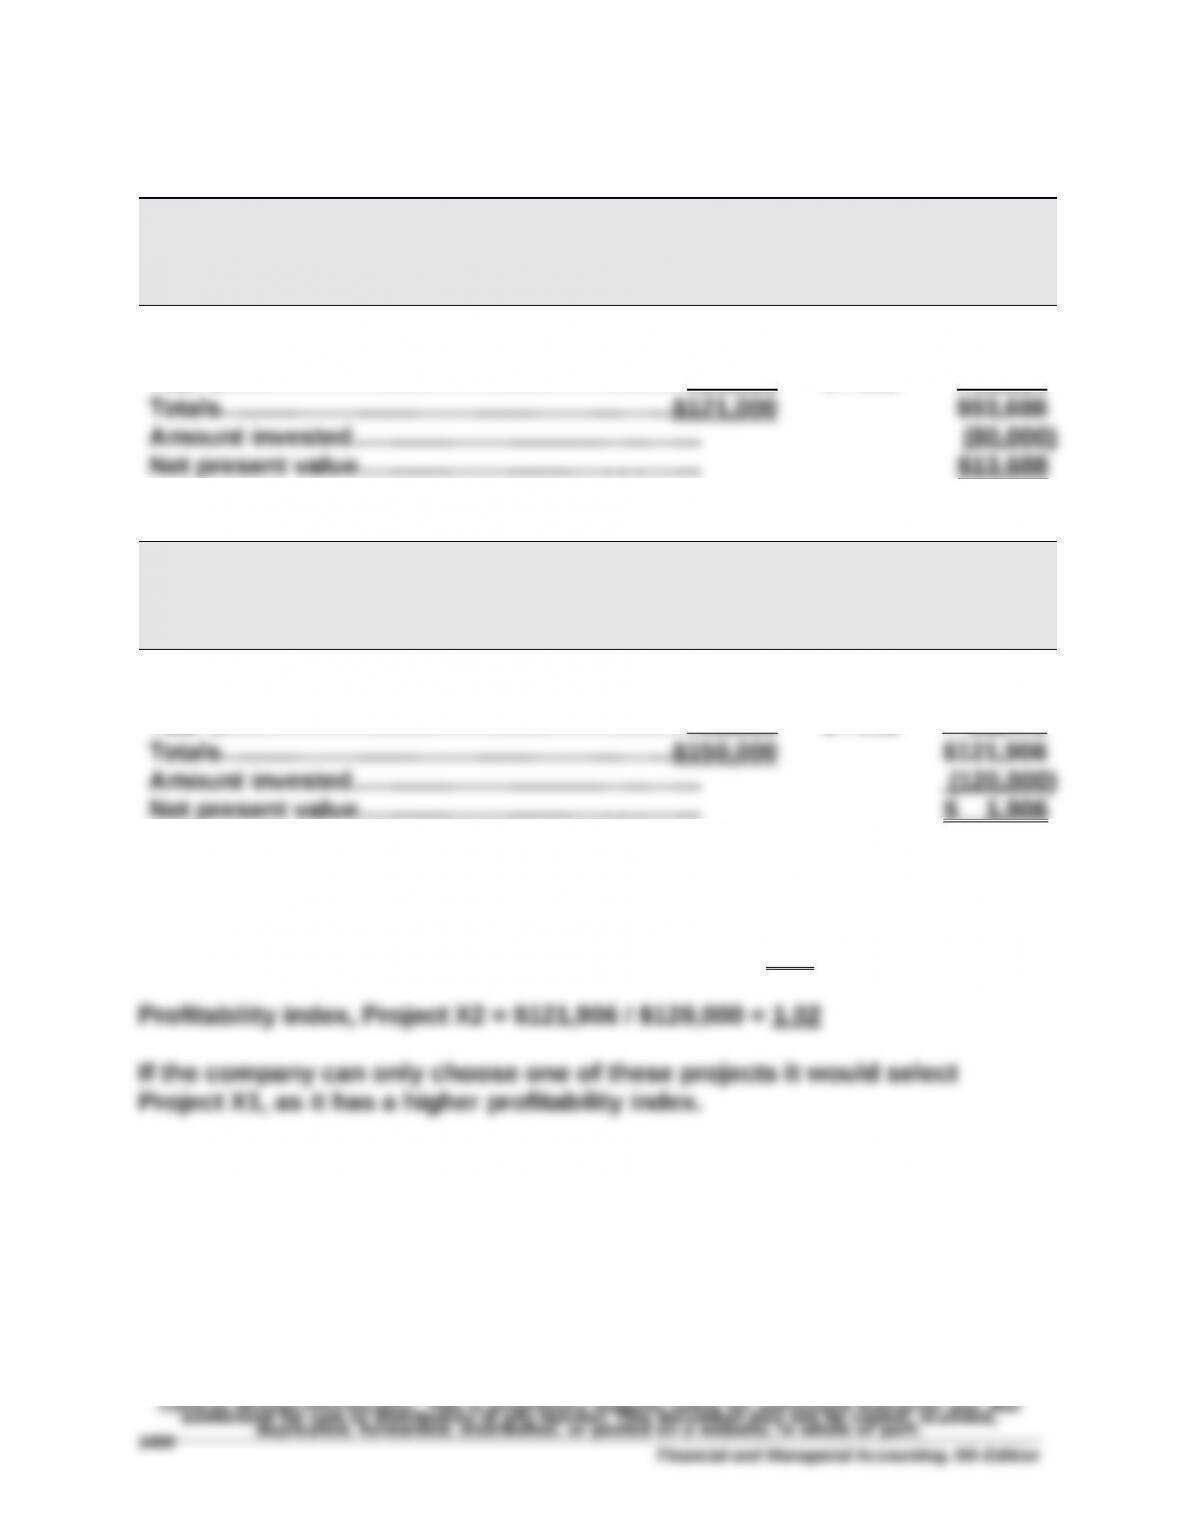
Year 1…………………………………………………………...$ 60,000 0.8929 $ 53,574
Year 2…………………………………………………………...50,000 0.7972 39,860
Year 3…………………………………………………………... 40,000 0.7118 28,472
b.
Profitability index, Project X1 = $93,688 / $80,000 = 1.17
Financial and Managerial Accounting, 6th Edition
Exercise 24-13 (20 minutes)
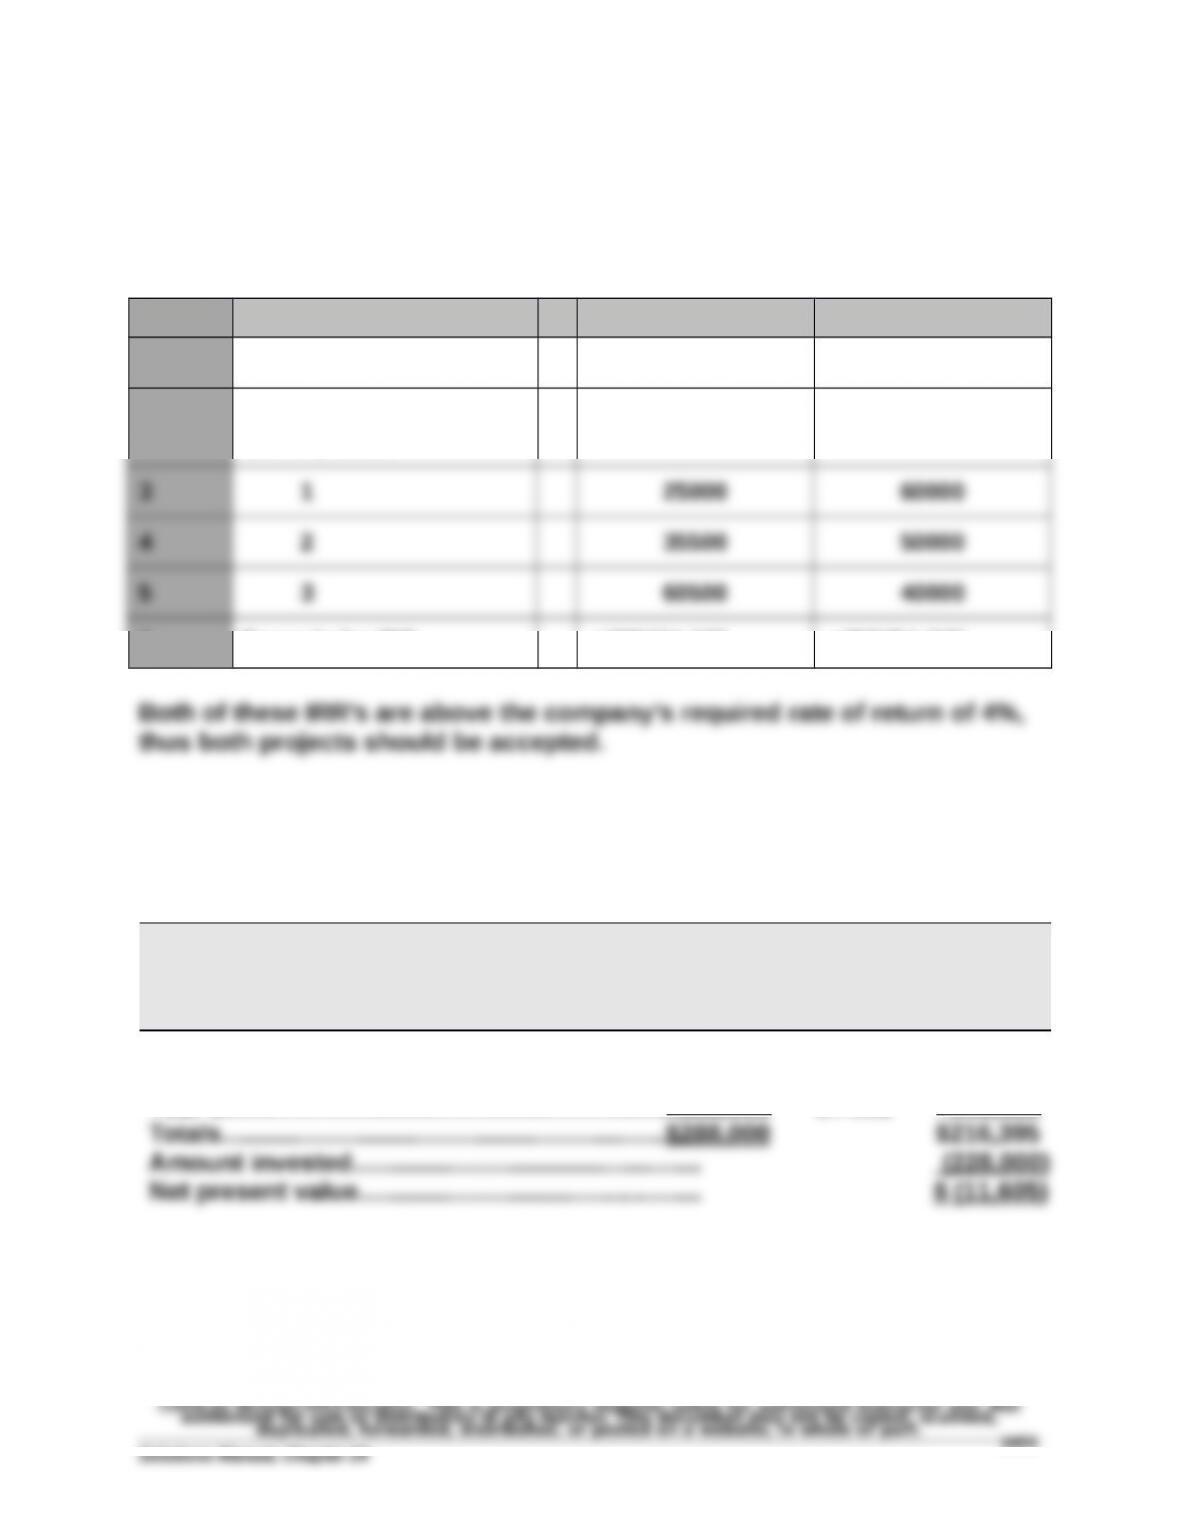
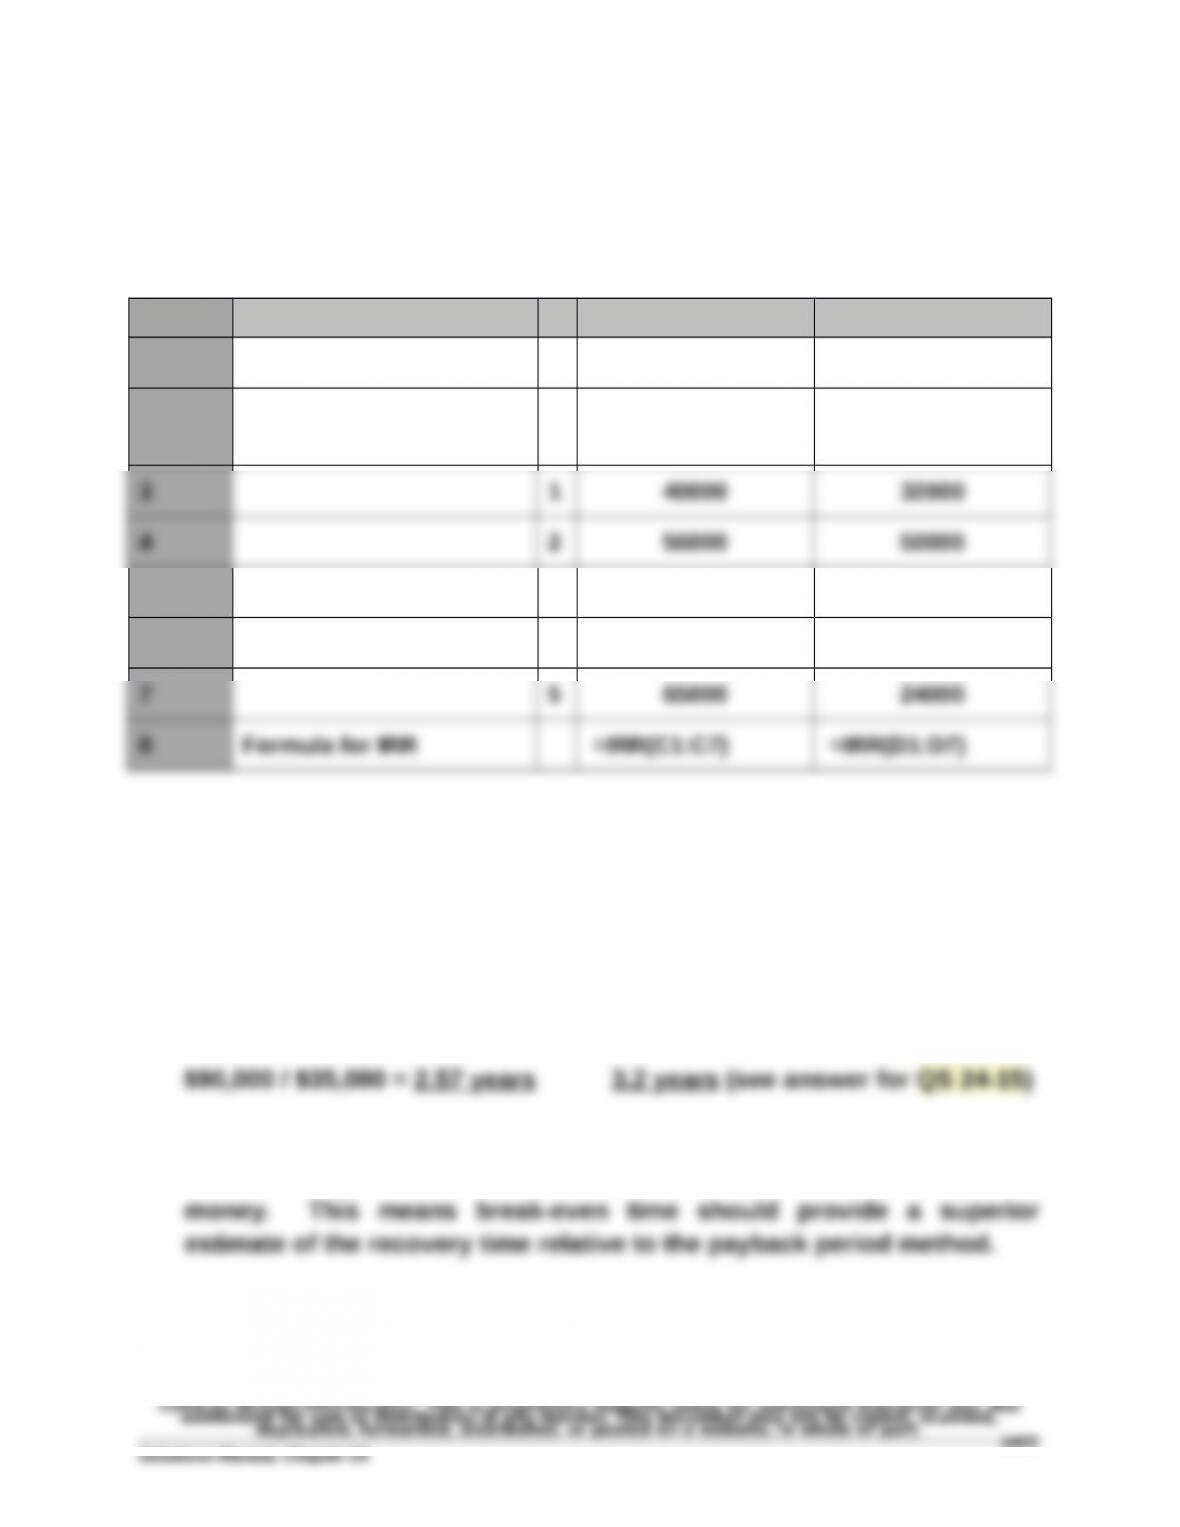
Using Excel, Project X1 (X2) has an internal rate of return of 20.34% (12.99%).
Project X1 Project X2
A B C D
1 Initial investment -80000 -120000
2Annual cash flows,
end of period
8 Formula for IRR =IRR(C1:C5) =IRR(D1:D5)
Exercise 24-14 (35 minutes)
1.
PROJECT C1
Net Cash
Flows
Present
Value of
1 at 12%
Present
Value of
Net Cash
Flows
Year 1…………………………………………………………...$ 12,000 0.8929 $ 10,715
Year 2…………………………………………………………...108,000 0.7972 86,098
Year 3…………………………………………………………... 168,000 0.7118 119,582
Exercise 24-14 (continued)
PROJECT C2
Net Cash
Flows
Present
Value of
1 at 12%
Present
Value of
Net Cash
Flows
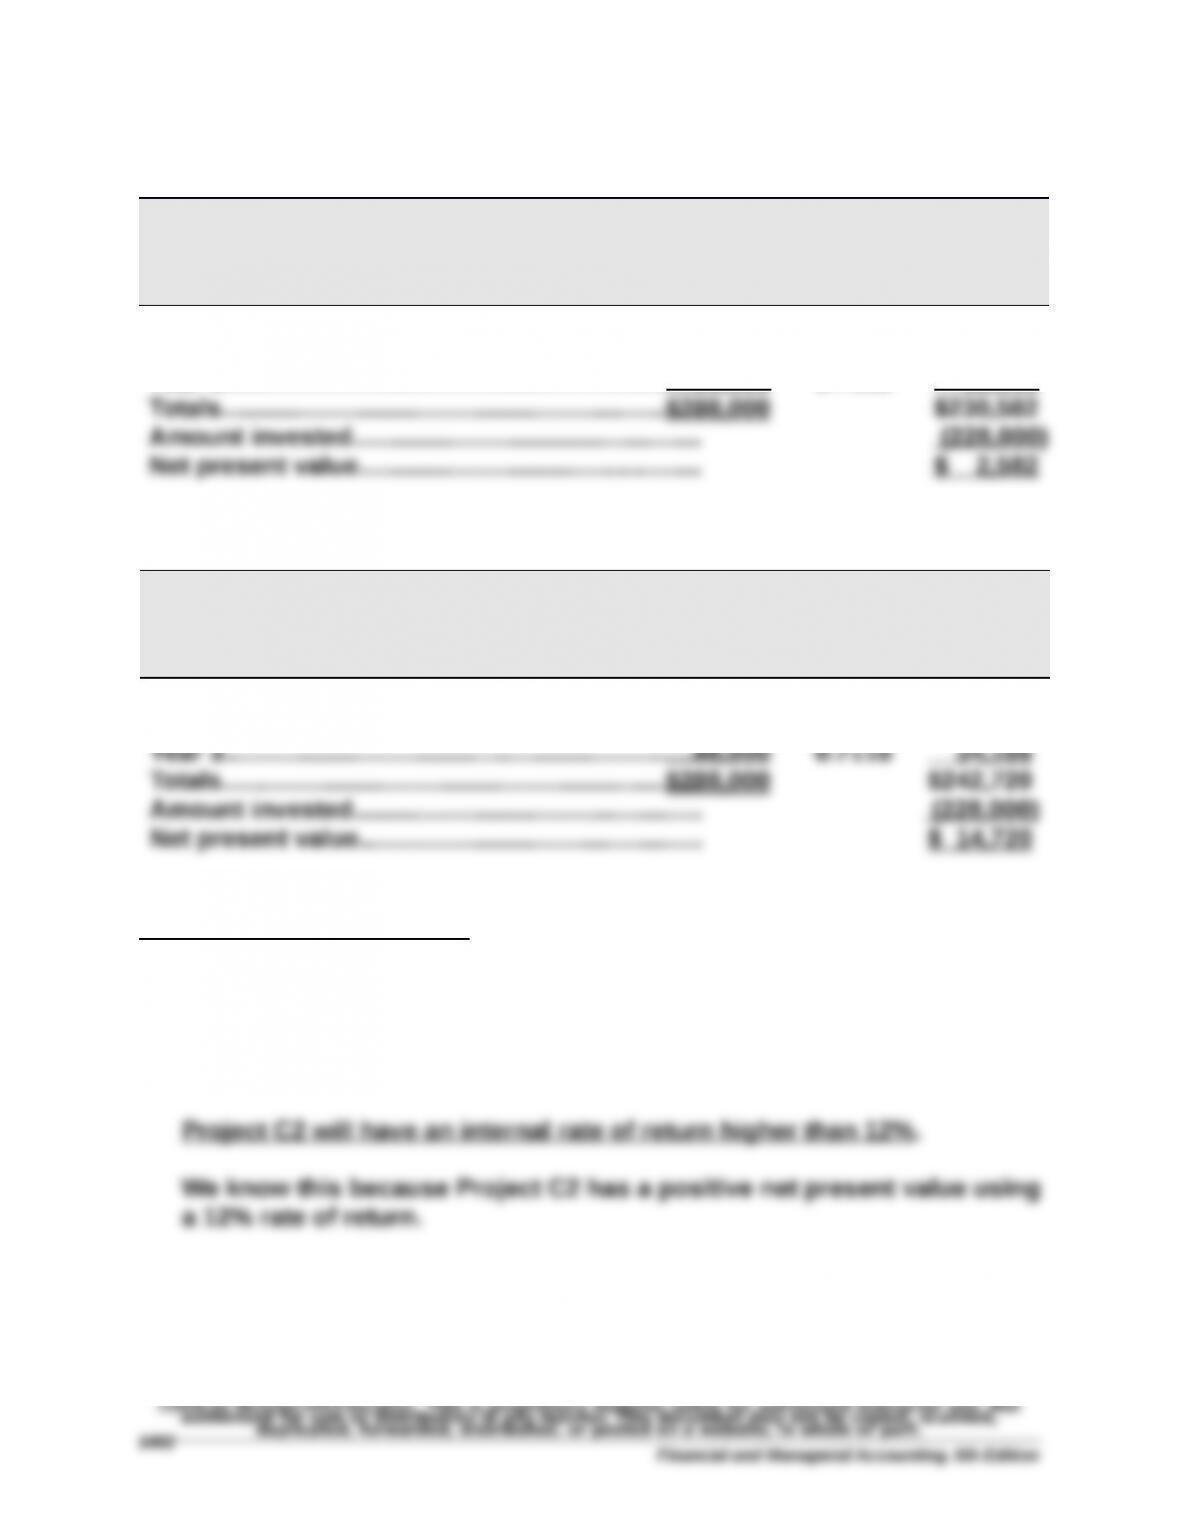
Year 1…………………………………………………………...$ 96,000 0.8929 $ 85,718
Year 2…………………………………………………………...96,000 0.7972 76,531
Year 3…………………………………………………………... 96,000 0.7118 68,333
PROJECT C3
Net Cash
Flows
Present
Value of
1 at 12%
Present
Value of
Net Cash
Flows
Year 1…………………………………………………………...$180,000 0.8929 $160,722
Year 2…………………………………………………………...60,000 0.7972 47,832
Analysis and Interpretation: Both Project C2 and C3 yield a positive net
present value. Accordingly, both C2 and C3 are acceptable investments.
Project C1 has a negative net present value, so it should be rejected.
2. INTERNAL RATE OF RETURN VS. NET PRESENT VALUE FOR C2
Financial and Managerial Accounting, 6th Edition
Exercise 24-15A (20 minutes)
Using Excel, Project A (B) has an internal rate of return of 26.96 (35.00%).
Project A Project B
A B C D
1 Initial investment -160000 -105000
2Annual cash flows,
end of period
5 3 80295 66000
6 4 90400 72000
Exercise 24-16 (15 minutes)
1. Recovery time computation
Payback Period Break-Even Time
2. The advantage of break-even time is that it considers the time value of

3. When (1) the interest rate is very low, 1% for example, and (2) the
Financial and Managerial Accounting, 6th Edition