
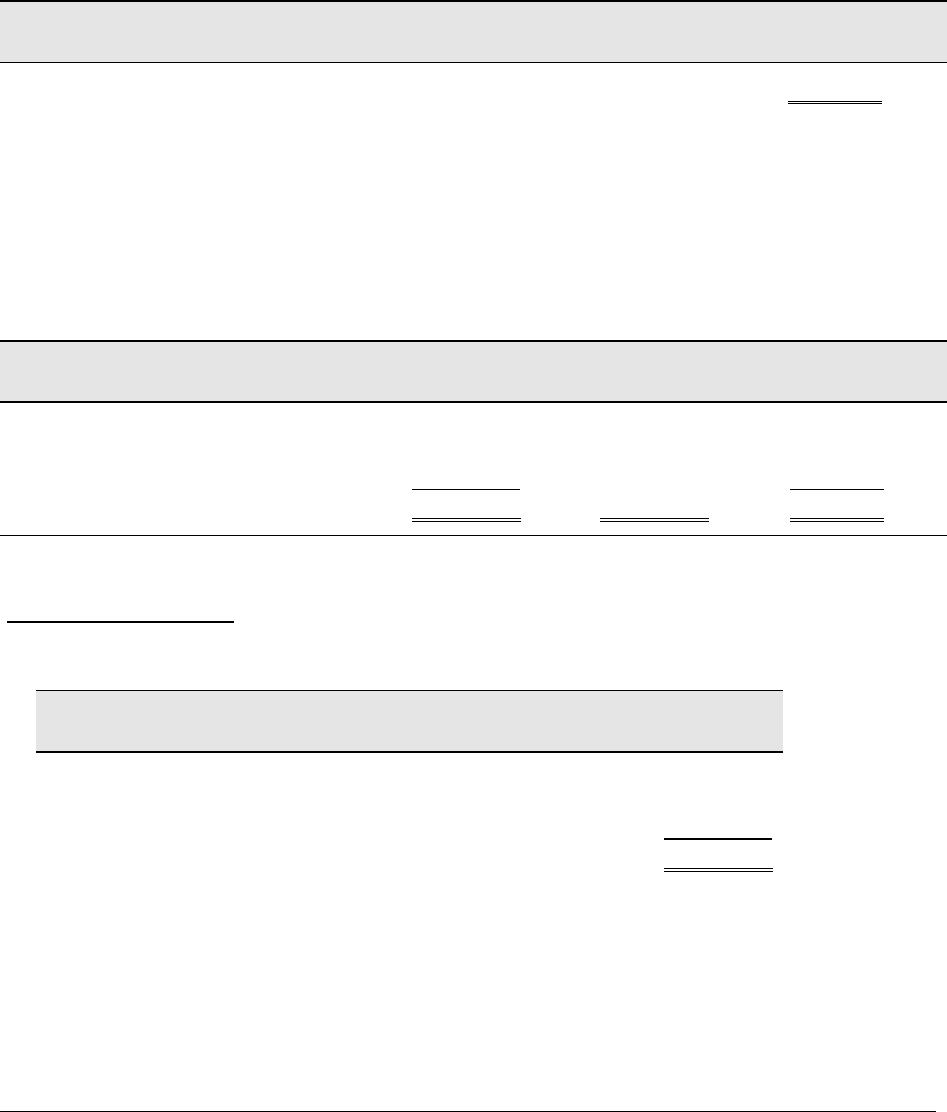
Problem 22-2A (Continued)
Value-based costs are allocated to departments in two steps
(i) Compute market value of each floor
Floor
Square
Footage
Value per
Sq. Ft. Total
(ii) Allocate $54,000 to each floor based on its percent of market value
Floor
Market
Value
% of
Total
Allocated
Cost
Cost per
Sq. Ft.
First floor……………………….…..$120,000 60% $32,400 $8.10
Second floor….….….……......... 80,000 40 21,600 5.40
Totals………..…..….….…….….….$200,000 100% $54,000
Usage-based costs allocation rate = $12,000 / 8,000 sq. ft.
= $1.50 per sq. ft.
12
Floor Value Usage Total
Department
Square
Footage Rate Total
Part 3
A second-floor manager would prefer allocation based on market value. This is a
reasonable and logical approach to allocation of occupancy costs. The current
method implies all square footage has equal value. This is not logical for this
Problem 22-3A (70 minutes)
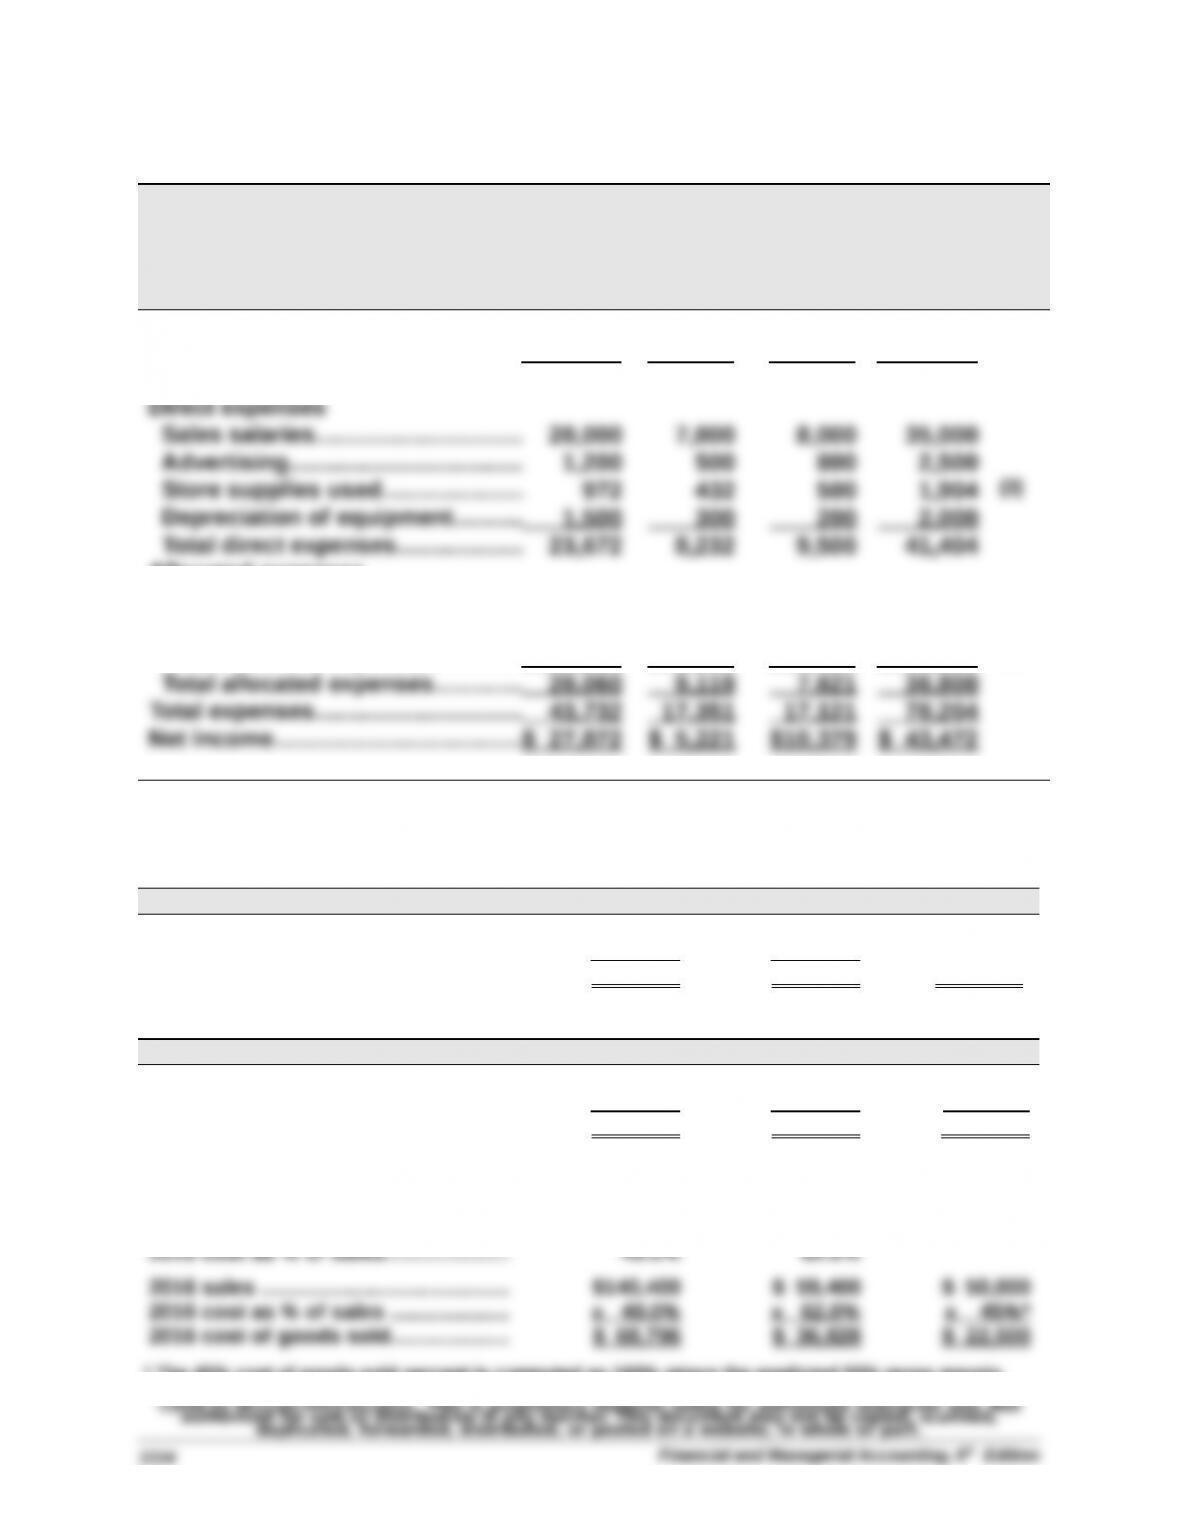
Williams Company
Forecasted Departmental Income Statements
For Year Ended December 31, 2016
Clock Mirror Paintings Combined
Sales………………..…………...…………..$140,400 $59,400 $50,000 $249,800 (1)
Cost of goods sold…….………......... 68,796 36,828 22,500 128,124 (2)
Gross profit………………..…………...... 71,604 22,572 27,500 121,676
Allocated expenses
Rent expense…..…………..……….…. 5,616 2,835 2,349 10,800 (4)
Utilities expense………………..…….. 2,080 1,048 872 4,000 (4)
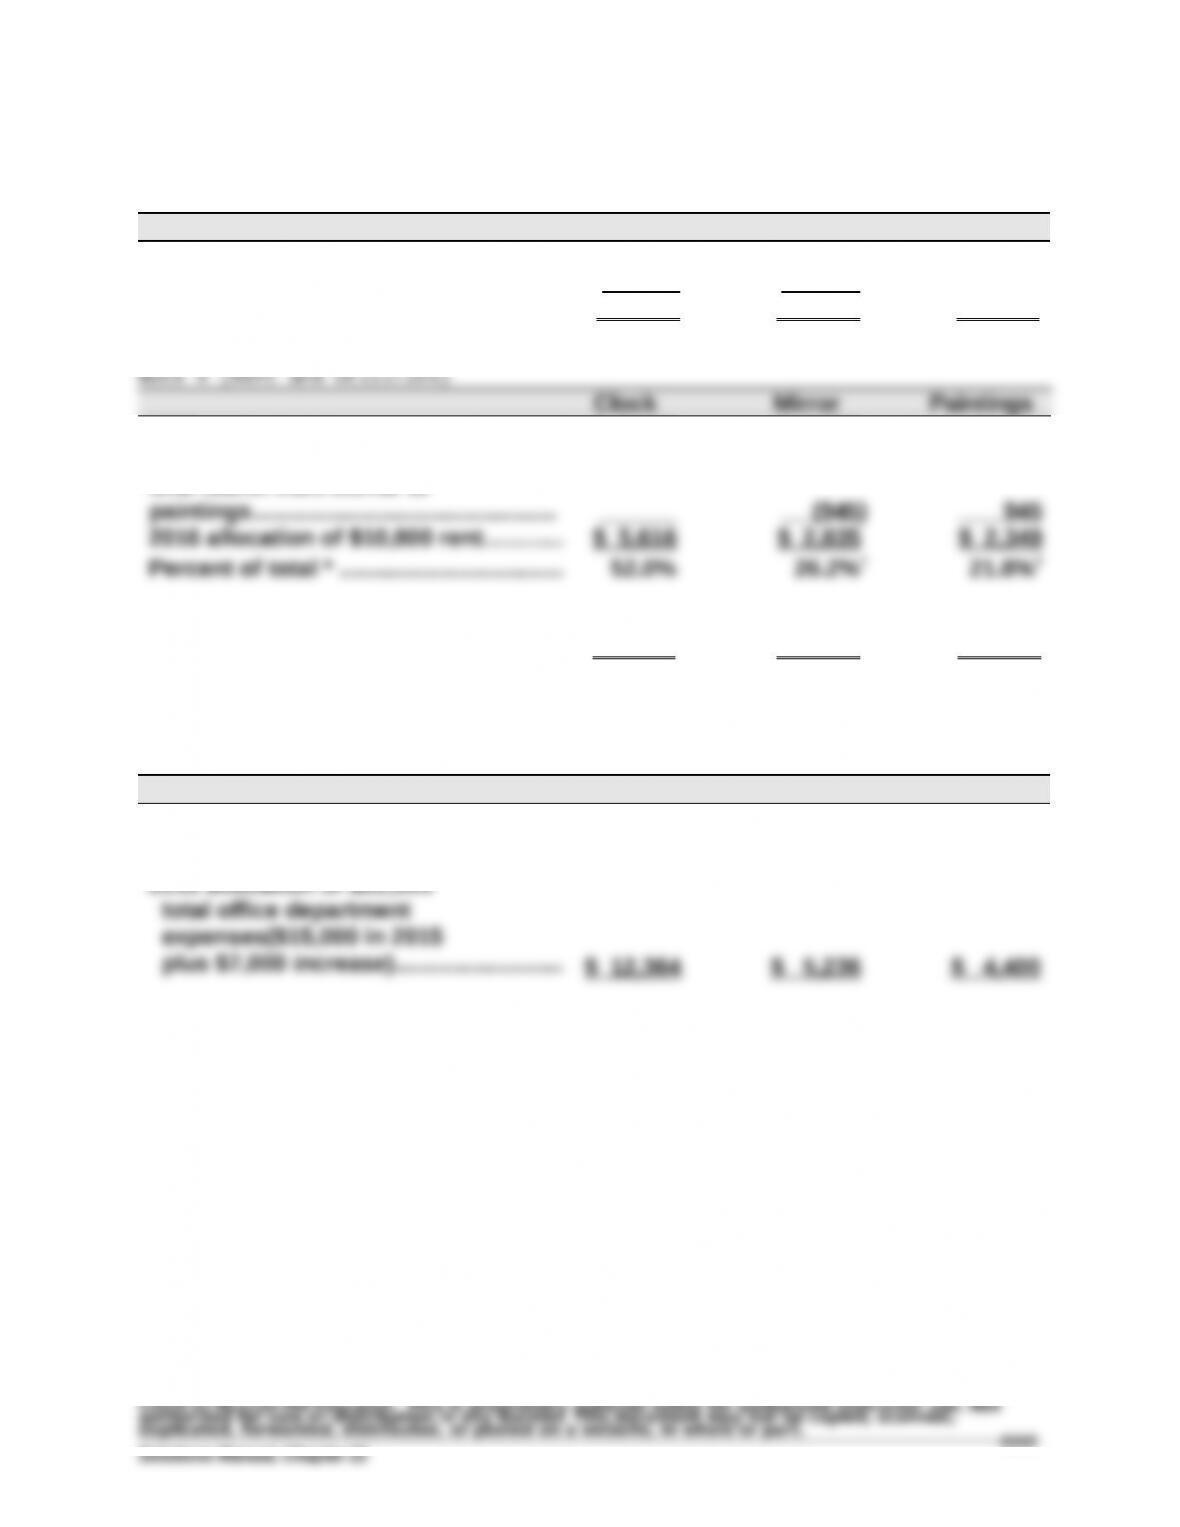
Share of office dept. expenses.... 12,364 5,236 4,400 22,000 (5)
Supporting Computations—coded (1) through (5) in statement above
Note 1 (Sales)
Clock Mirror Paintings
2015 sales…………………........….......... $130,000 $ 55,000
Growth rate (8% increase)..…........... x 108% x 108%
2016 sales…………………........….......... $140,400 $ 59,400 $ 50,000
Note 2 (Cost of Goods Sold)
Clock Mirror Paintings
2015 cost of goods sold…................ $ 63,700 $ 34,100 $ 50,000
Growth rate (8% increase)..…........... x 108% x 108% x 45%*
2016 cost of goods sold…................ $ 68,796 $ 36,828 $ 22,500
ALTERNATIVELY
2015 cost of goods sold…................ $ 63,700 $ 34,100
2015 sales…………………........….......... $130,000 $ 55,000
* The 45% cost of goods sold percent is computed as 100% minus the predicted 55% gross margin.
Problem 22-3A (Continued)
Note 3 (Store Supplies Used)
Clock Mirror Paintings
2015 store supplies used ………........... $ 900 $ 400
Growth rate (8% increase)……….………. x 108% x 108%
2016 store supplies ………….…..………… $ 972 $ 432 $ 500
2015 rent …….…………..…………..…………. $ 7,020 $ 3,780
One-fifth from clock to paintings……… (1,404) $ 1,404
One-fourth from mirror to
2016 allocation of $4,000
total utilities …………………..………..…… $ 2,080 $ 1,048 $ 872
†Adjusted to eliminate rounding difference.
Note 5 (Office Department Expenses)
Clock Mirror Paintings
2015 sales …..………….……………………... $140,400 $ 59,400 $ 50,000
Percent of total sales *…….………………. 56.2% 23.8% 20.0%
2016 allocation of $22,000
* Instructor note: If students round to something other than one-tenth of a percent, their
numbers will slightly vary.
Problem 22-4A (45 minutes)
Part 1
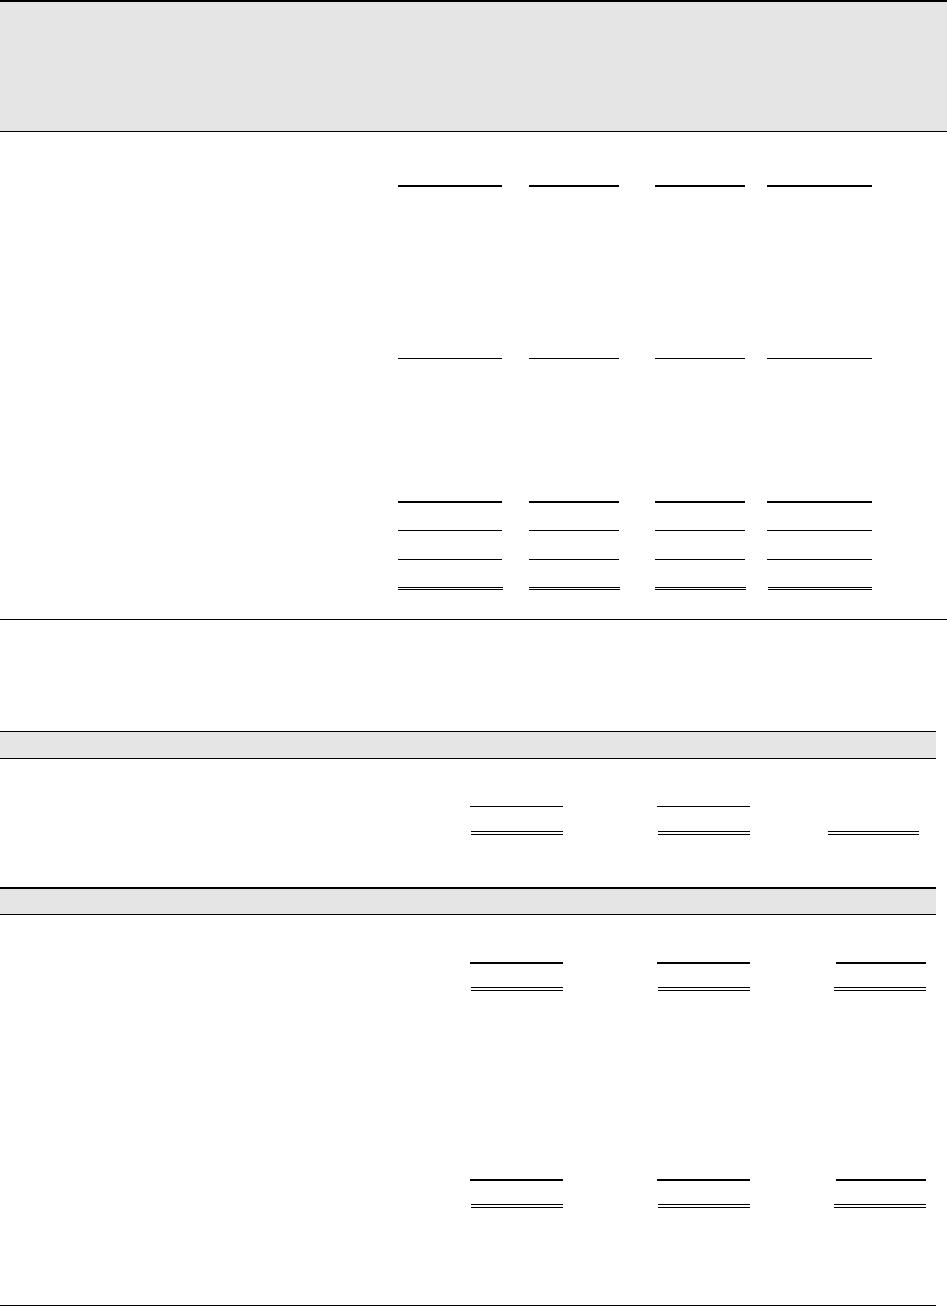
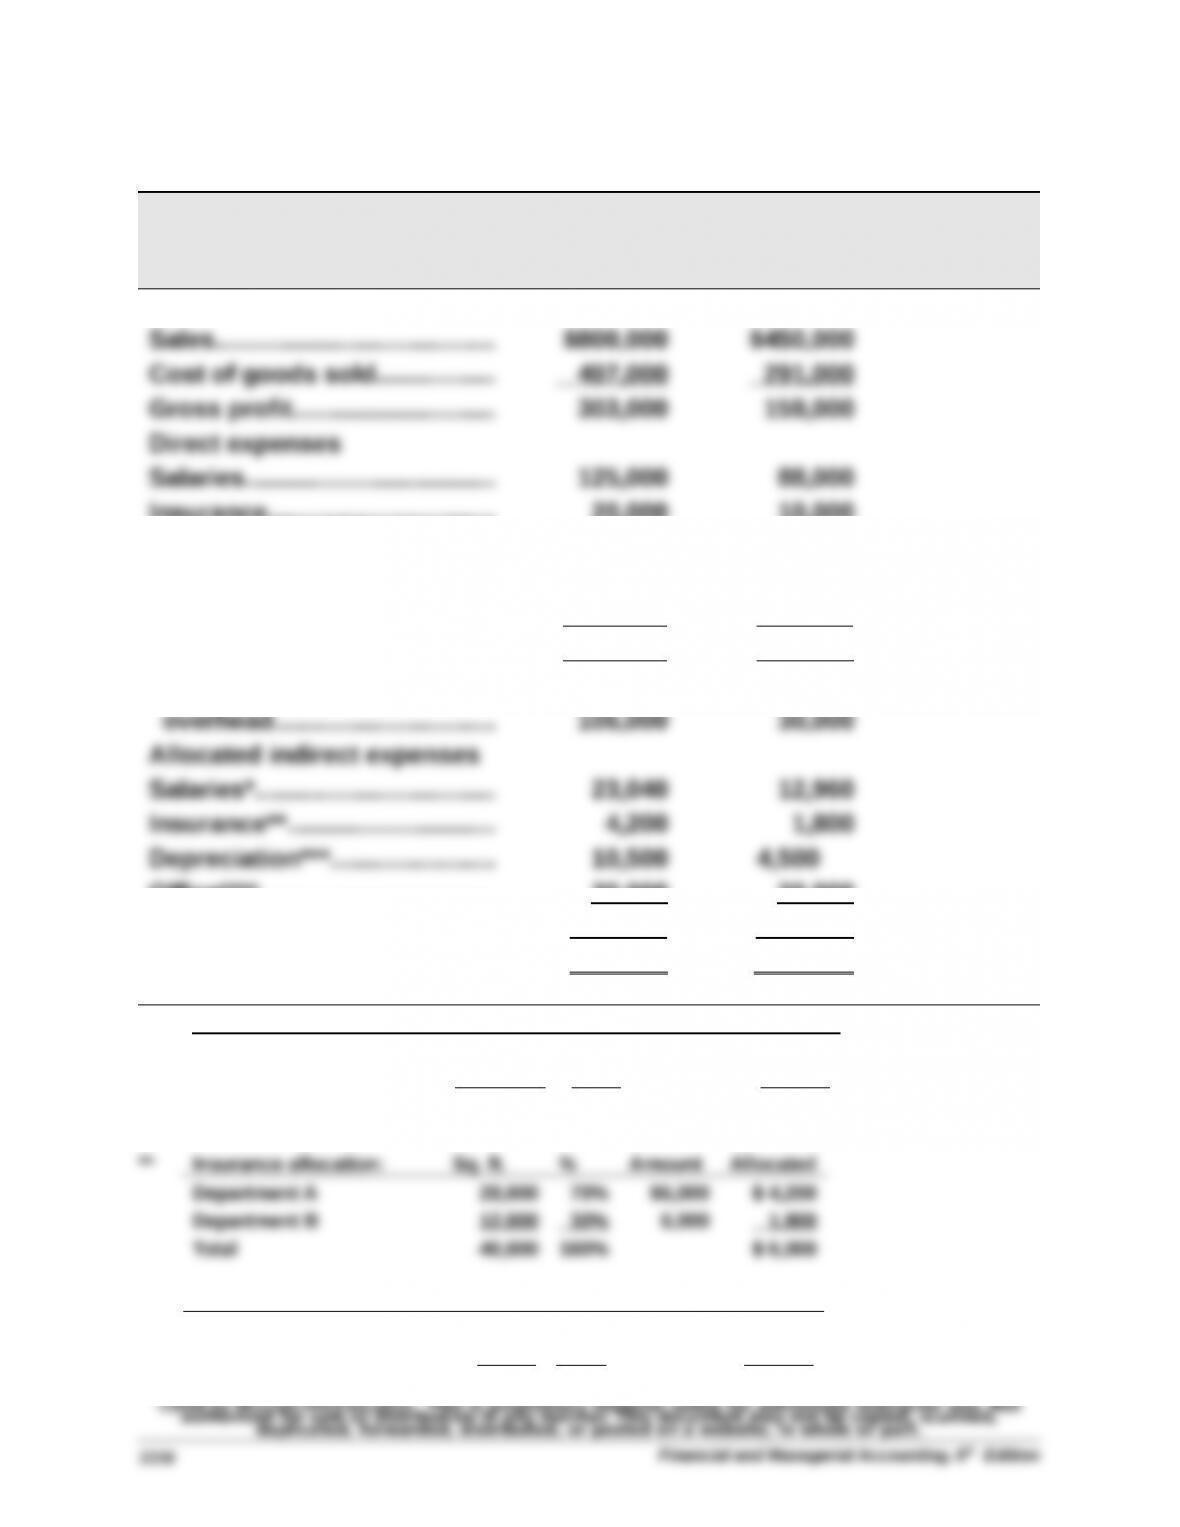
VORTEX COMPANY
Departmental Contribution Statements
Dept. A Dept. B
Insurance………………………..…
Utilities………………………………
Depreciation………………..……..
20,000
24,000
21,000
10,000
14,000
12,000
Maintenance………………..…….. 7,000 5,000
Total direct expenses…..…….. 197,000 129,000
Departmental contributions to
Office****…………….………….…..
Total indirect expenses……….
30,000
67,740
20,000
39,260
Operating income………….…... $ 38,260 $ (9,260)
*Salaries allocation: Sales % Amount Allocated
Department A $ 800,000 64% $36,000 $23,040
Department B 450,000 36% 36,000 12,960
Total $1,250,000 100% $36,000
*** Depreciation allocation: Sq. ft. % Amount Allocated
Department A 28,000 70% $15,000 $10,500
Department B 12,000 30% 15,000 4,500
Total 40,000 100% $15,000

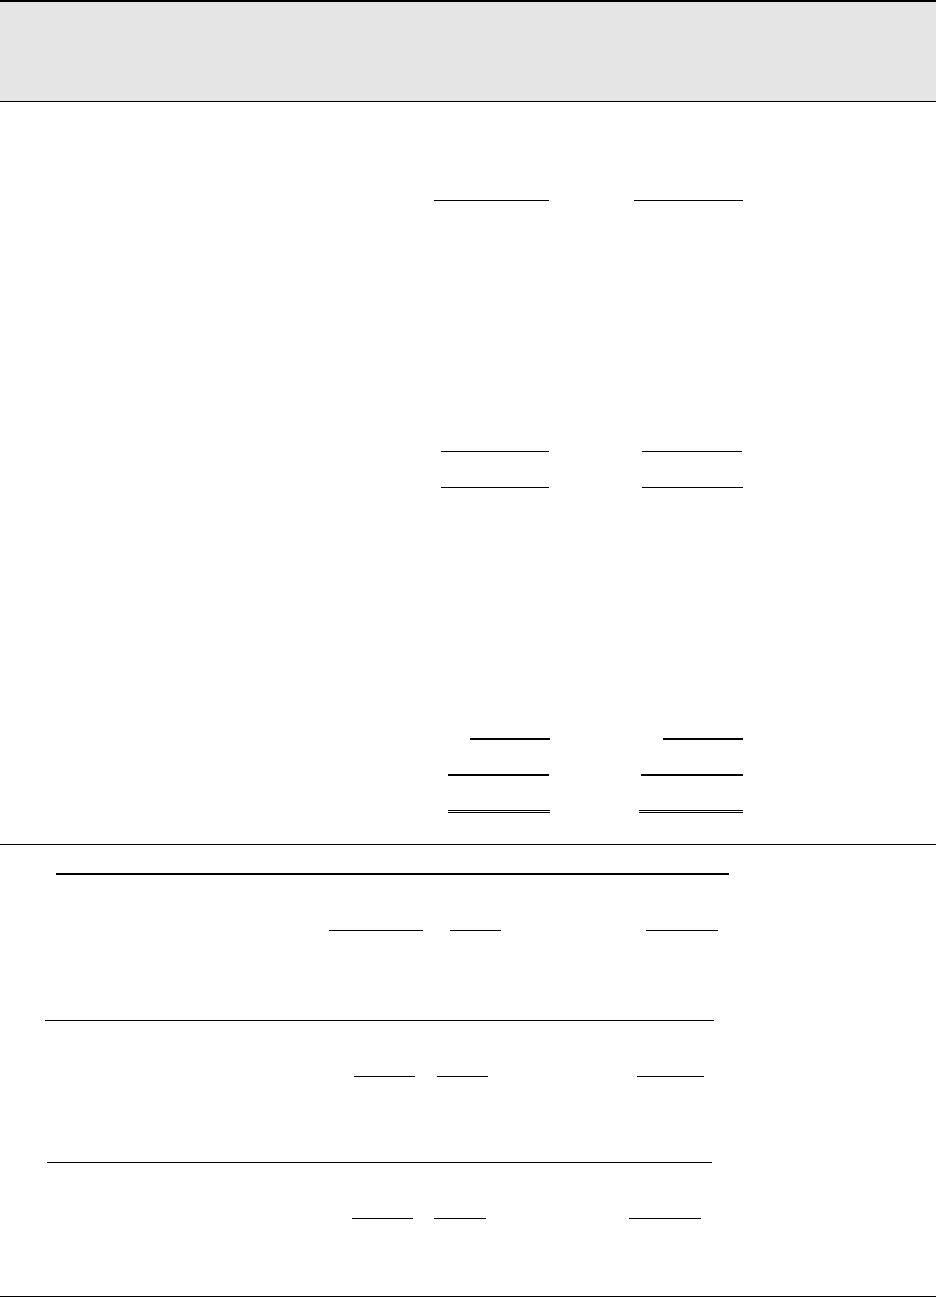
Problem 22-4A (Concluded)
**** Office expense allocation: Employees % Amount Allocated
Department A 75 60% $50,000 $30,000
Department B 50 40% 50,000 20,000
Total 125 100% $50,000
Part 2
Although Department B has a negative departmental income, it is
contributing $30,000 to overhead. If none of the indirect expenses can be

P
Problem 22-5AB (60 minutes)
Part 1
Allocations of joint costs on the basis of sales values
Tree pruning and care: $405,000
Grade
Sales
Value
Percent
of Total
Allocated
Cost
No. 1…………….……….…..$450,000 48.0% $194,400
No. 2…………….……….…..300,000 32.0 129,600
Picking, sorting, and grading: $202,500
Grade
Sales
Value
Percent
of Total
Allocated
Cost
No. 1…………….……….…..$450,000 48.0% $ 97,200
No. 2…………….……….…..300,000 32.0 64,800
Delivery: $30,000 to Grade Nos. 1 & 2
Grade
Sales
Value
Percent
of Total
Allocated
Cost
No. 1…………….……….…..$450,000 60.0% $18,000
* If students did not round percents to one-tenth, their answers will vary
slightly from those reported here.
**The No. 3 Grade delivery costs are given in the problem description.

Problem 22-5AB (Continued)
Part 2
GEORGIA ORCHARDS
Income Statement
For Year Ended December 31, 2015
No. 1 No. 2 No. 3 Combined
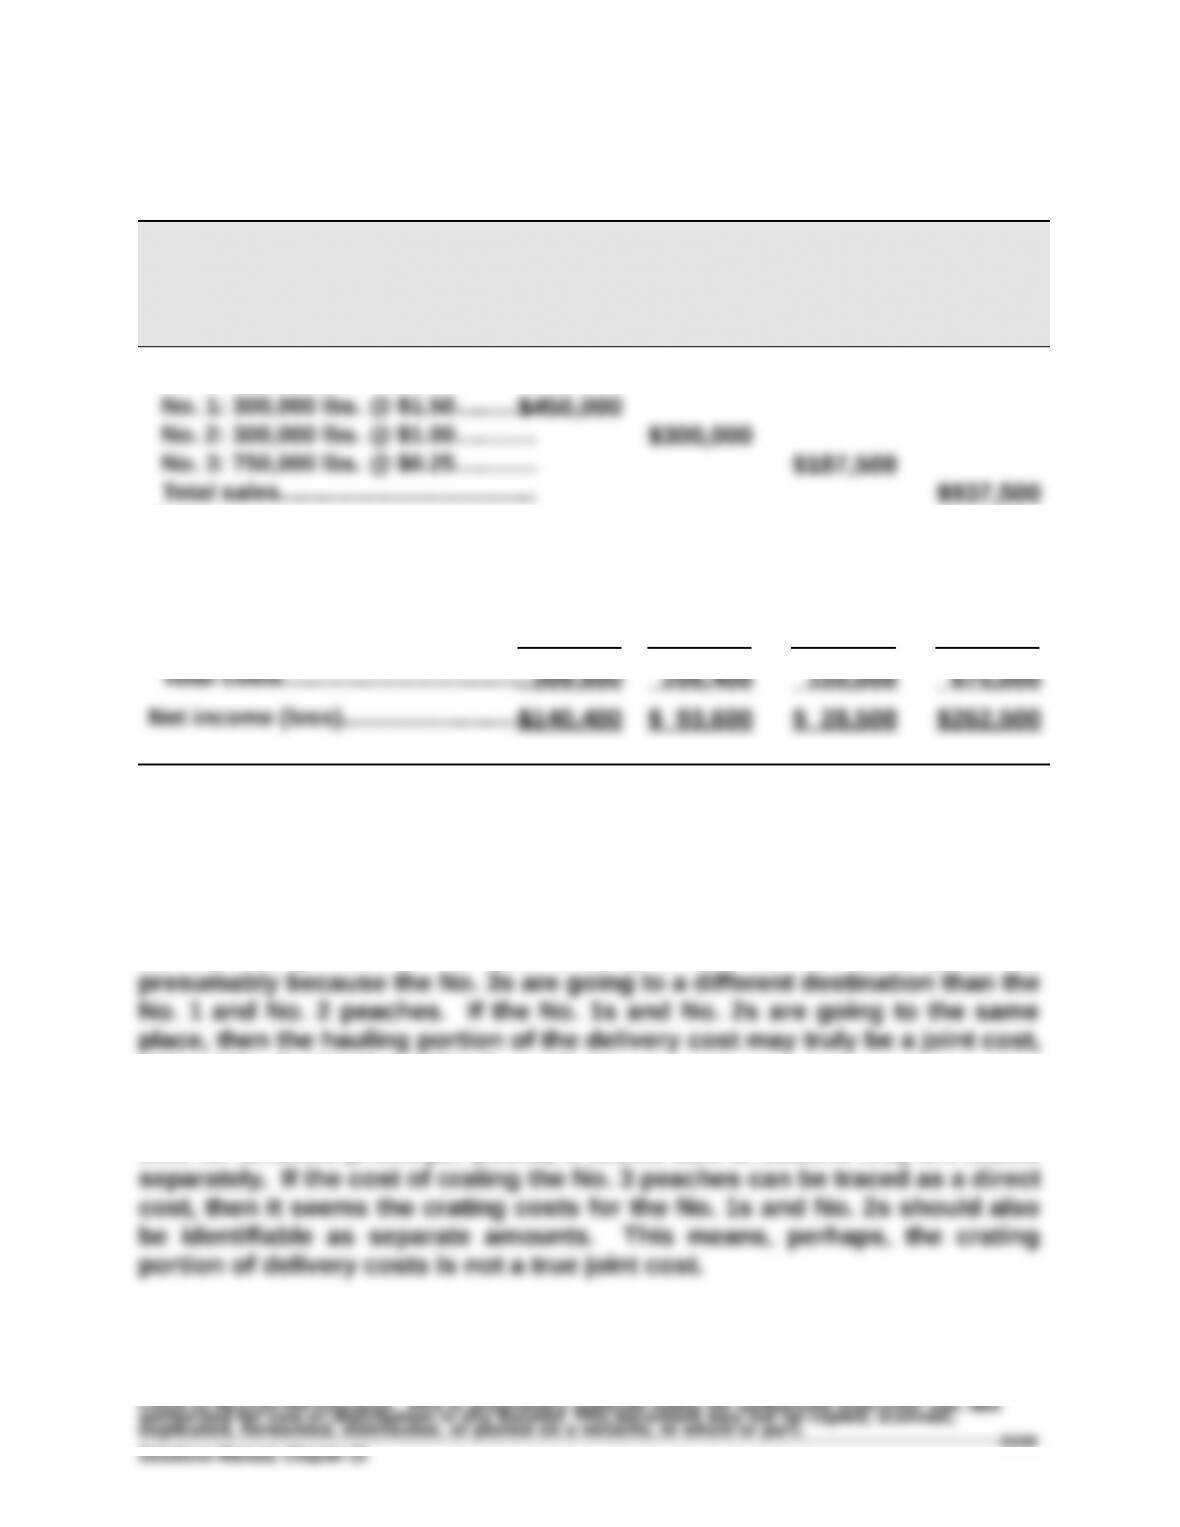
Sales (by grade)
Costs
Tree pruning and care…….…………..
194,400 129,600 81,000 405,000
Picking, sorting & grading….......... 97,200 64,800 40,500 202,500
Delivery..……………………………………
18,000 12,000 37,500 67,500
Part 3
Delivery costs include both crating and hauling costs. Georgia is able to
identify the portion of the cost directly related to the No. 3 peaches,
at least for the No. 1 and No. 2 peaches.
However, since the No. 1 and No. 2 peaches are different grades and are
sold for different prices per pound, it seems safe to assume they are crated
PROBLEM SET B
Problem 22-1B (50 minutes)
Part 1
a.
Responsibility Accounting Performance Report
Dept. Manager, Refrigerator Department
For the Month of April
Budgeted Actual Over (Under)
Amount Amount Budget
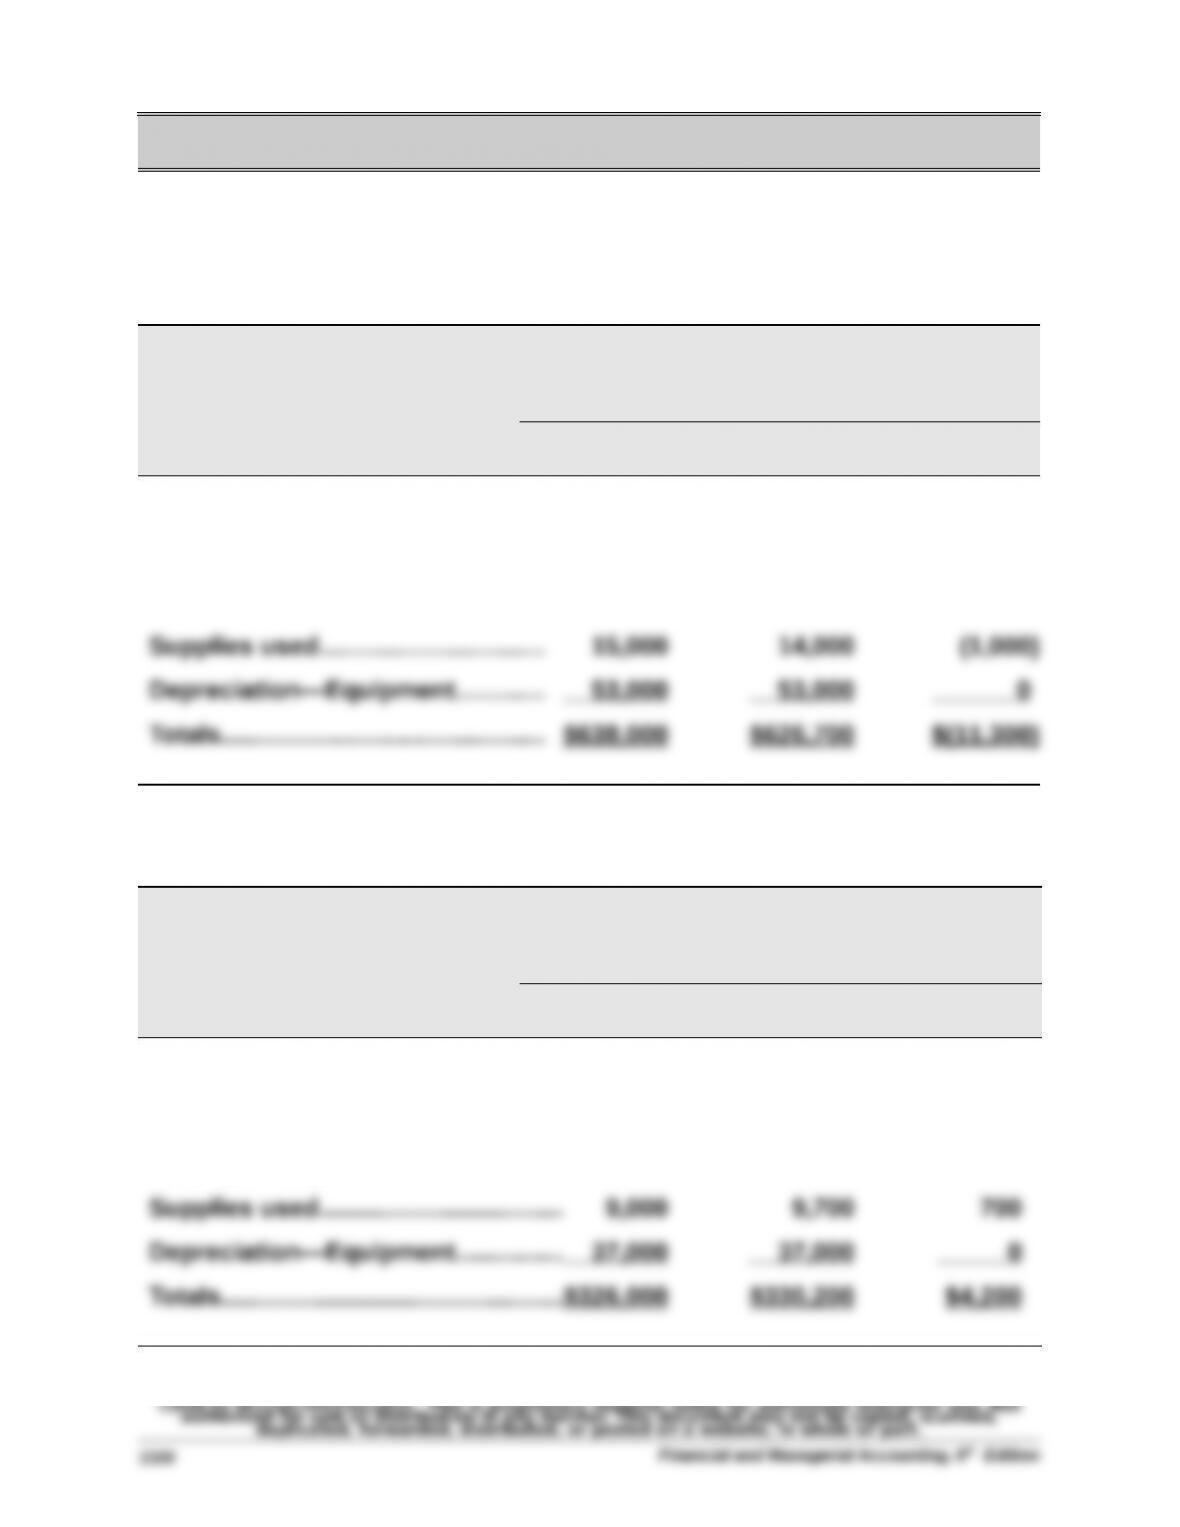
Controllable Costs
Raw materials….….…….….…….…... $400,000 $385,000 $(15,000)
Employee wages……………..…….…. 170,000 174,700 4,700
b.
Responsibility Accounting Performance Report
Dept. Manager, Dishwasher Department
For the Month of April
Budgeted Actual Over (Under)
Amount Amount Budget
Controllable Costs
Raw materials…………………..….….….$200,000 $202,000 $ 2,000
Employee wages………..….….…….…. 80,000 81,500 1,500
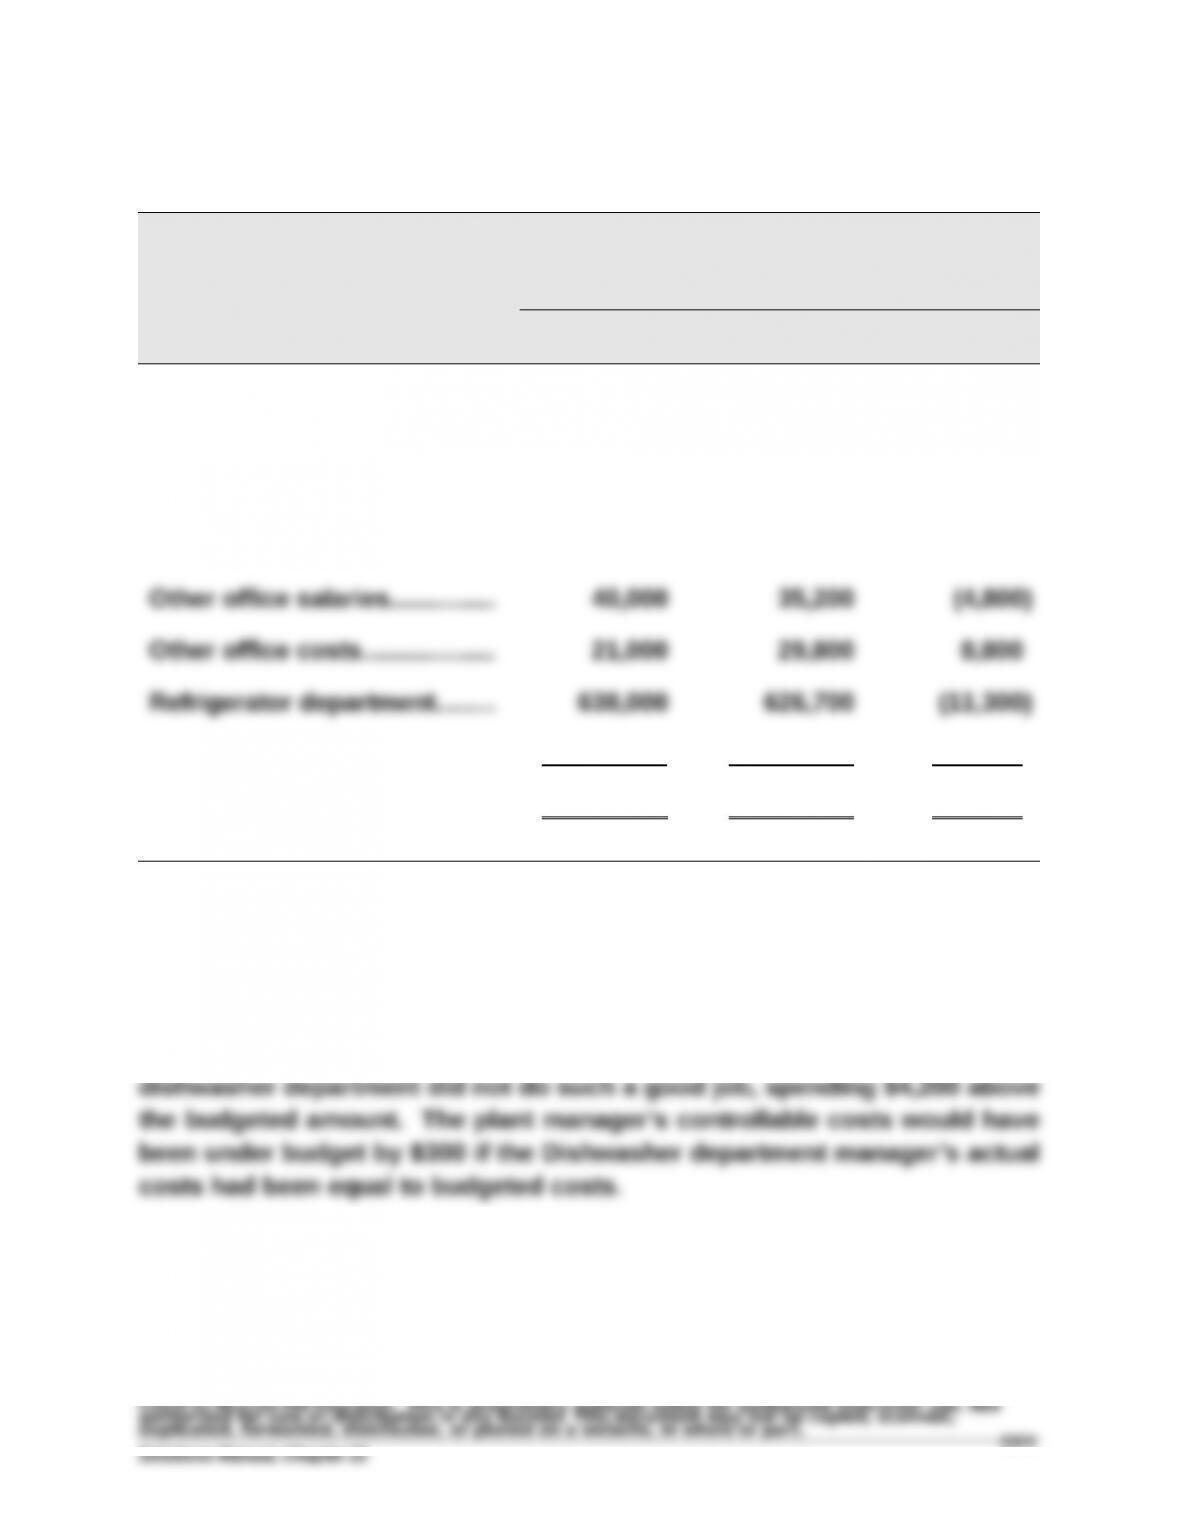

Problem 22-1B (Continued)
c.
Responsibility Accounting Performance Report
Plant Manager, Chicago Plant
For the Month of April
Budgeted Actual Over (Under)
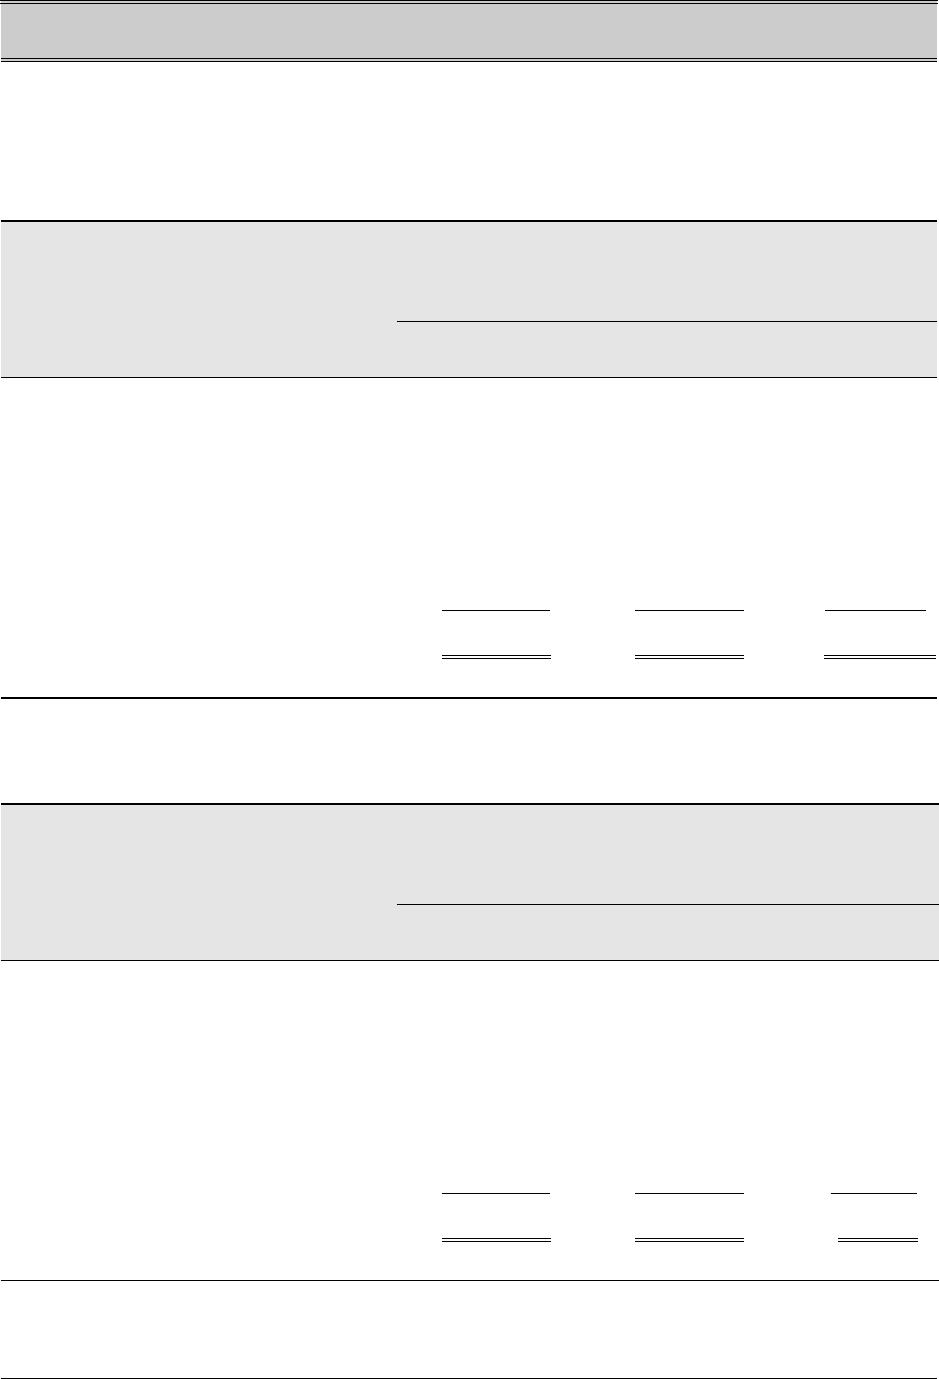
Amount Amount Budget
Controllable Costs
Dept. manager salaries…....... $ 104,000 $ 101,500 $ (2,500)
Utilities….….….…….….…….…... 48,000 55,200 7,200
Building rent….….….…….….…. 80,000 82,300 2,300
Dishwasher department……… 326,000 330,200 4,200
Totals………..…..….….…….….…. $1,257,000 $1,260,900 $ 3,900
Part 2
The refrigerator department manager did a good job of controlling costs
and meeting the budget, spending $11,300 below budget. However, the
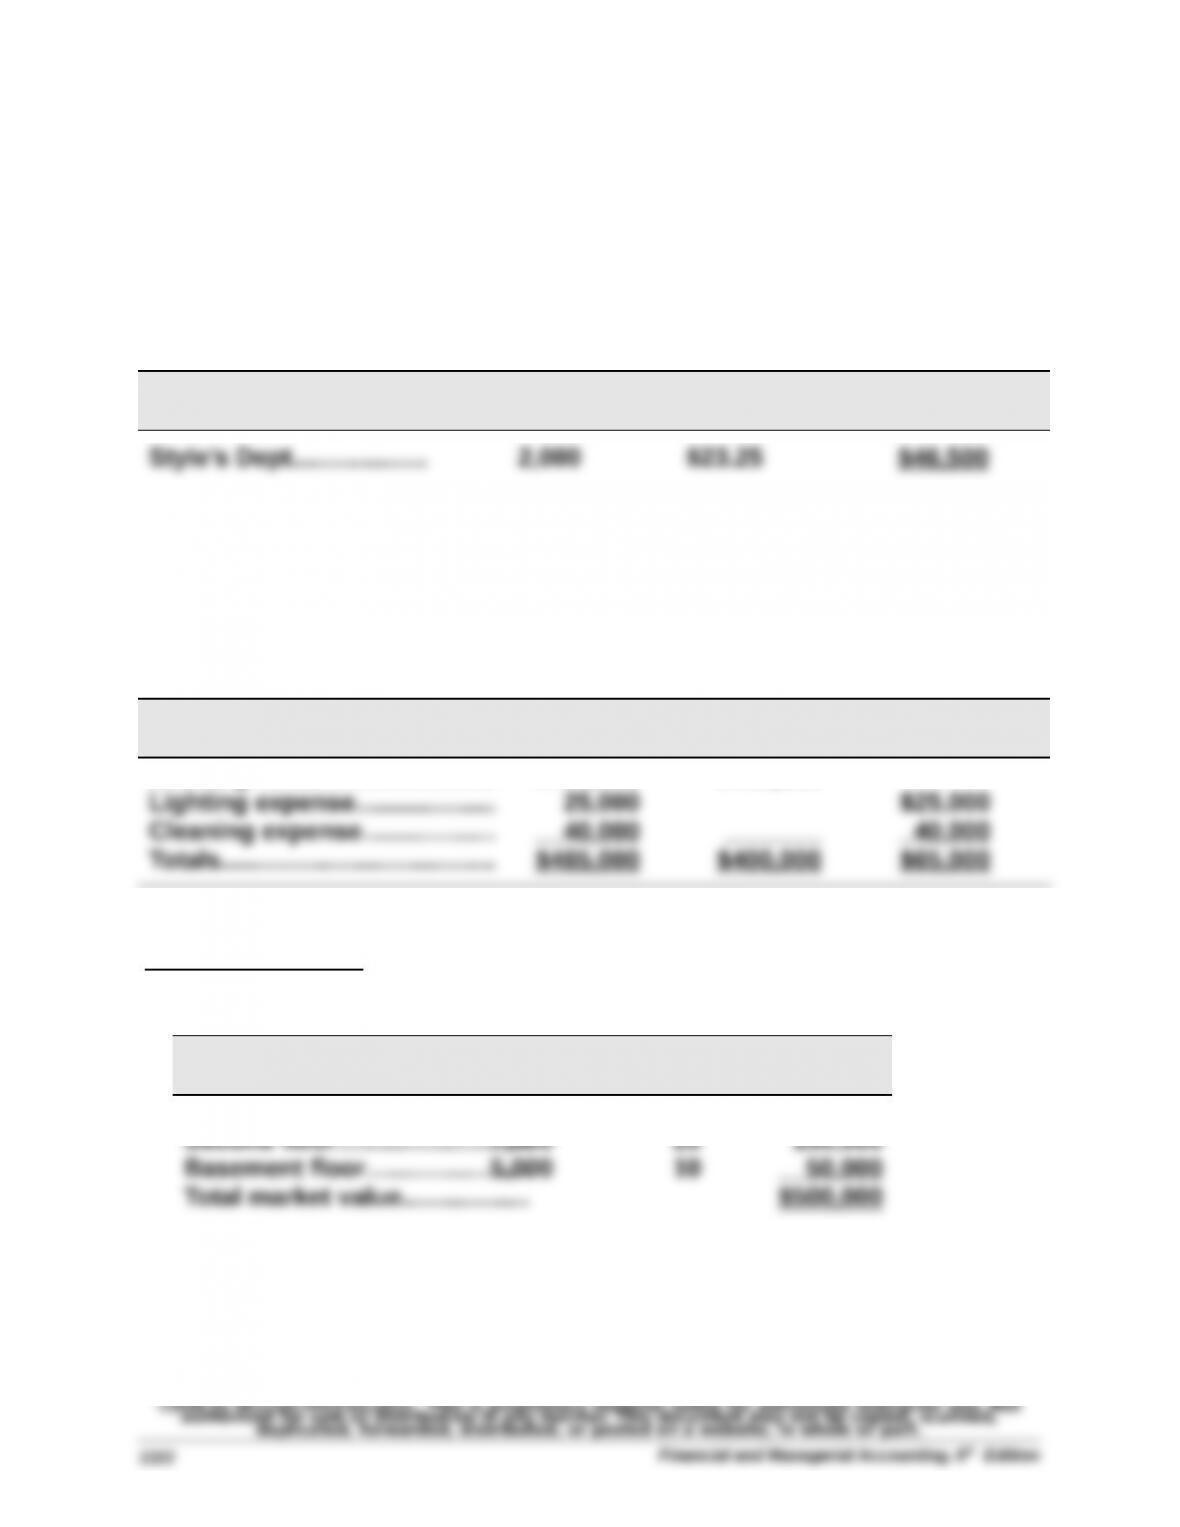
Problem 22-2B (60 minutes)
Part 1
Average occupancy cost = $465,000 / 20,000 sq. ft. = $23.25 per sq. ft.
These costs are assigned to Style’s department as follows
Department Square
Footage
Rate Total
Part 2
Market rates are used to allocate occupancy costs for the building rent.
Lighting and cleaning costs are allocated to the departments on all three
floors at the average rate per square foot. Costs assigned to each class are:
Occupancy Costs
Total
Costs
Value-Based
Costs
Usage-Based
Costs
Building rent….….….…….….…. $400,000 $400,000
Value-based costs are allocated in two steps
(i) Compute market value of each floor
Floor
Square
Footage
Value per
Sq. Ft. Total
First floor……………………….…..7,500 $40 $300,000