Chapter Outline
5. To help identify factors causing the overhead cost variance managers
will analyze the variance separately for controllable and volume
variances.
a. The controllable variance is the difference between the actual
overhead costs incurred and the budgeted overhead costs based on
a flexible budget; named because it refers to activities usually
under management control.
b. The volume variance is the difference between the budged fixed
overhead (at predicted capacity) and the applied fixed overhead).
i. Occurs when there is a difference between the actual volume
of production and the standard volume of production
ii. The budgeted fixed overhead is the same value regardless of
the volume of production.
iii. The applied overhead is based on the standard direct labor
hours allowed for the actual volume of production.
iv. When a company operates at a capacity different from what is
expected, the volume variance will differ from zero
6. Analyzing controllable and volume variances
a. An unfavorable volume means the company did not reach its
expected operating level – a favorable variance means the
7. Overhead Variance Reports
a. Help managers isolate the reasons for a controllable variance.
b. Provides information about specific overhead costs and how they
differ from budgeted amounts
V. Decision AnalysisSales VariancesSimilar to computation and analysis of
cost variances.
A. Sales price variance and sales volume variance can be computed.
B. Managers use sales variances for planning and control purposes.
1. Used to plan future actions to avoid unfavorable variances
2. Question why sales were higher/lower than expected.
3. Evaluate and reward salespeople.
C. When multiple products sold:
1. Sales mix variance is difference between actual and budgeted sales
mix of products.
2. Sales quantity variance is difference between total actual and total
Notes
21-10
Chapter Outline
Appendix 21A
I. Expanded Overhead Variances
A. Computing Overhead Cost Variancesassume predetermined rate is based
on relation between standard overhead and standard labor hours.
1. Framework uses classifications of overhead costs as either variable or
fixed
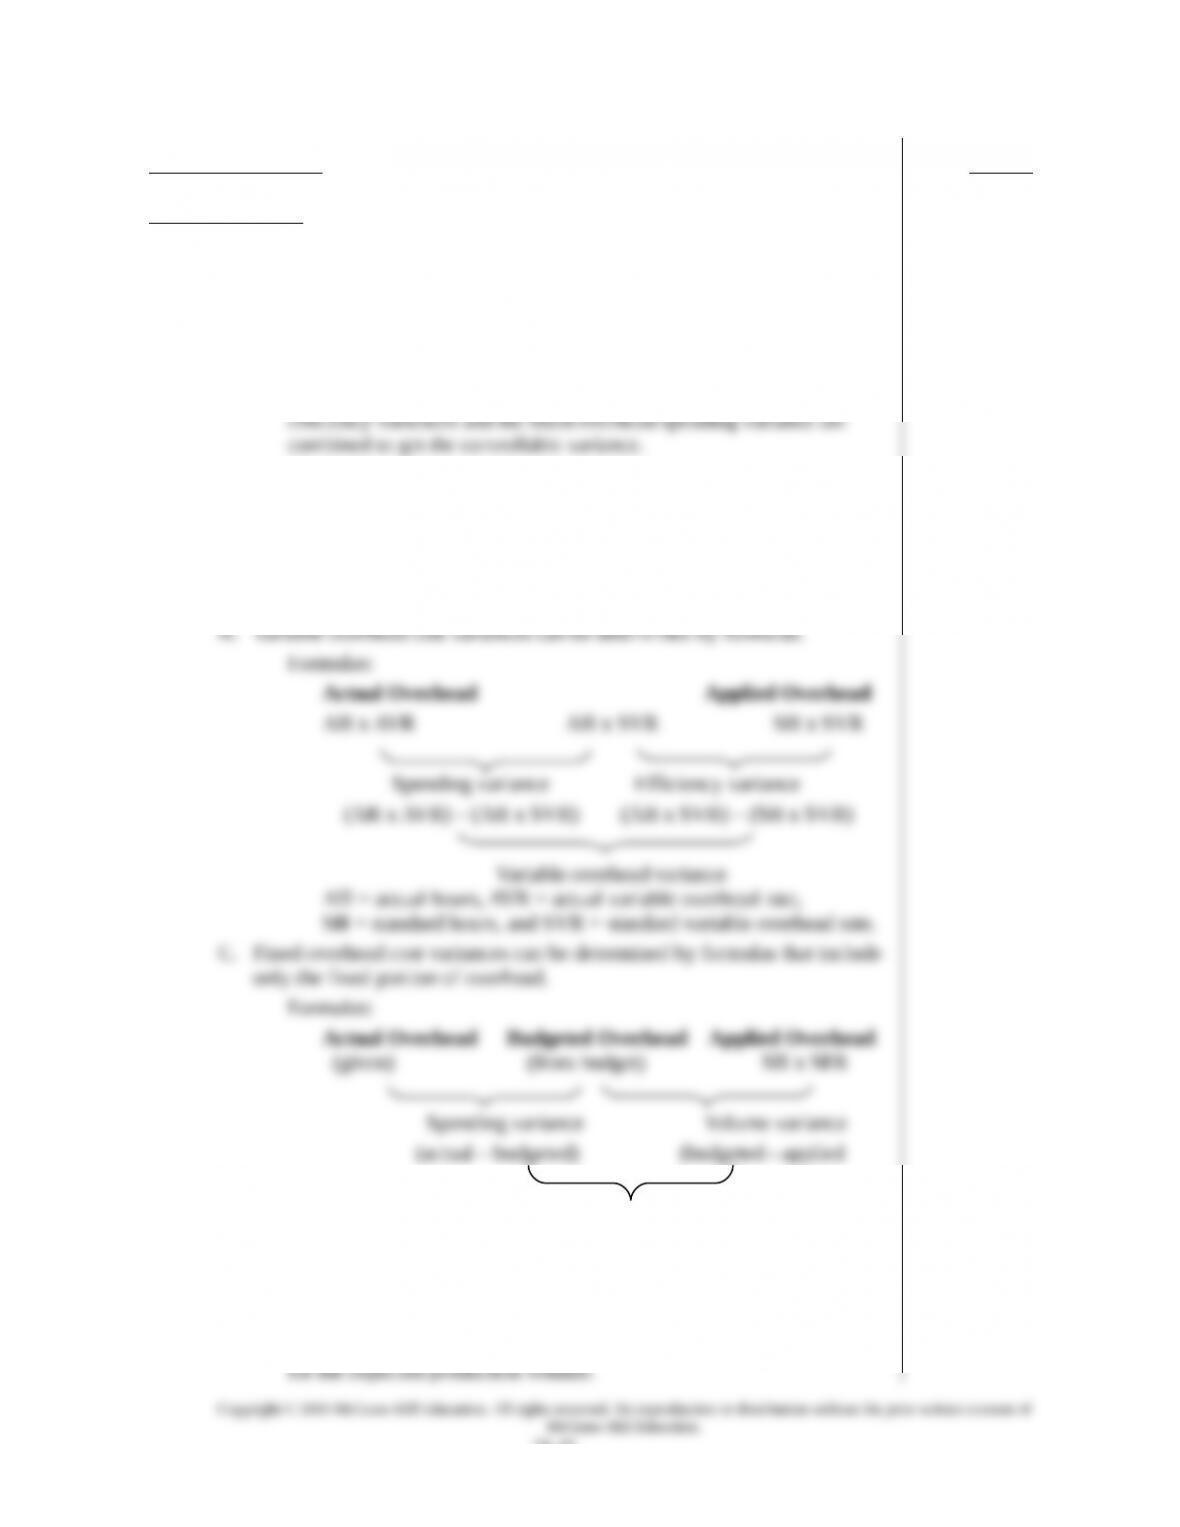
2. Exhibit 23A.1 shows that the variable overhead spending and
3. A spending variance results when amount paid to acquire overhead
items differs from standard price
4. An efficiency variance results when standard direct labor hours (the
assumed allocation base) expected for actual production are different
from actual direct labor hours used; reflects on the cost-effectiveness
in using the overhead allocation base such as direct labor hours.
Fixed overhead variance
SH = standard hours, and SFR = standard fixed overhead rate
1. Fixed overhead volume variance results when actual volume of
production differs from standard volume of production.
2. Budgeted fixed overhead amount remains same regardless of expected
volume, and is computed based on standard direct labor hours allowed
Notes
21-11
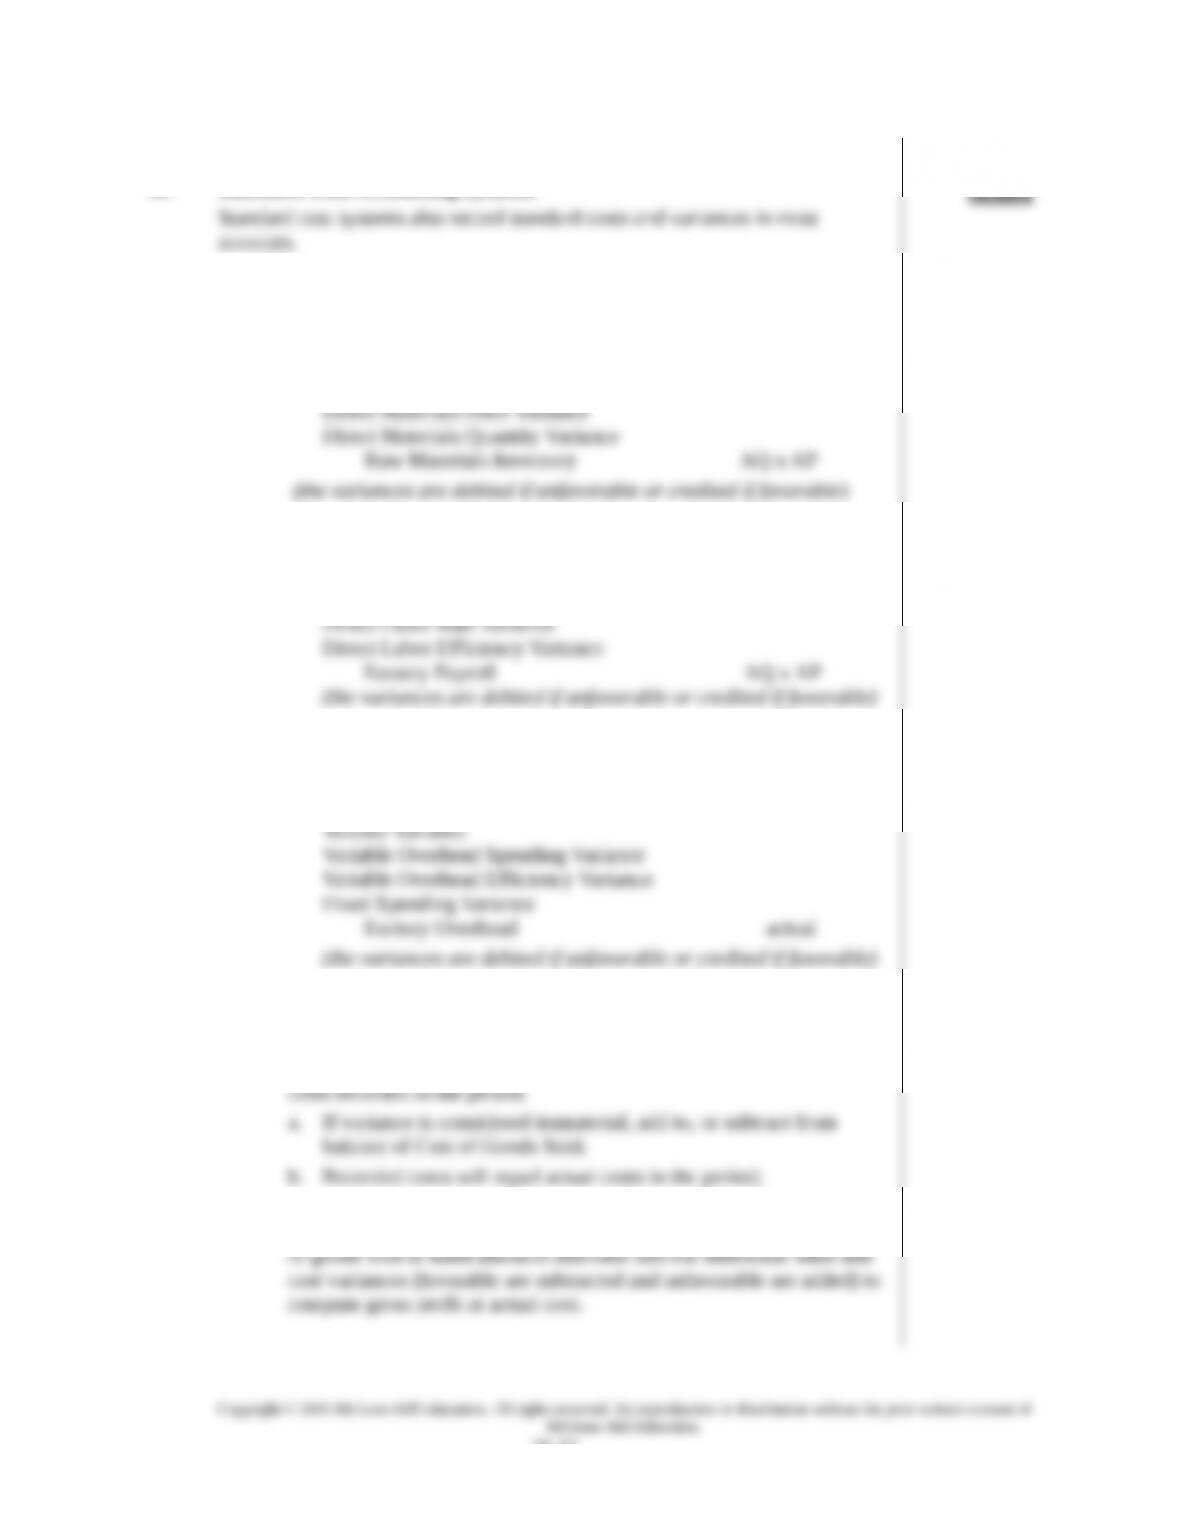
II. Standard Cost Accounting Systems
1. Simplifies recordkeeping
2. Helpful in report preparation.
3. Record standard materials costs incurred:
Work in Process Inventory SQ x SP
4. Record standard labor cost of goods manufactured:
Work in Process Inventory SQ x SP
5. Assign standard predetermined overhead to Work in Process:
Work in Process Inventory SQ x SPR
6. An alternative is to combine the spending and efficiency variances into
one account called “Controllable Variances”.
7. Accumulate balances in the different variance accounts until end of
accounting period; to close, add to or subtract from the manufacturing
8. Can use a standard costing income statement to summarize a
company’s performance. The Income Statement reports sales and cost
Notes
21-12
Alternate Demo Problems 21
Problem #1
XYZ Company manufactures tables. A standard cost card for the
manufacture of one table shows the following:
Standard Cost per Table:
Direct material: 4 sq. ft. @ $3/sq. ft. $12
Direct labor: 2 hours @ $8/hr 16
Total prime costs $28
In November, the company produced 1,000 tables. Actual production costs
and quantities were:
Direct material: 3,900 sq. ft. @ $3.10/sq. ft. $12
Direct labor: 2,300 hours @ $7.80/hr 16
Required:
Calculate the price and quantity variances for direct material and direct
labor.
21-13

Problem #2
Atlantic Company has the following monthly flexible budget information
based on an expectation of operating at 80% of the factory’s capacity or
10,000 units produced:
Operating Levels
70% 80% 90%
Budgeted output in units 8,000 10,000 12,000
Budgeted labor (standard hours) 16,000 20,000 24,000
Budgeted overhead
Variable overhead $ 48,000 $60,000 $ 72,000
Fixed overhead 40,000 40,000 40,000
Total overhead $ 88,000 $100,000 $112,000
During the current month, the company operated at 70% of capacity and employees worked 16,500 hours
and the flowing actual overhead costs were incurred:
Variable overhead $ 47,300
Fixed overhead 41,000
Total overhead $88,300
Required:
1. Compute the predetermined overhead rate per direct labor hour for
variable overhead, fixed overhead, and total overhead.
2. Compute the variable overhead spending and efficiency variances.
3. Compute the fixed overhead spending and volume variance.
21-14
Solution: Problem #1
Materials Variances
Units produced…………………………………….. 1,000 tables
X std. quantity of materials per unit………….. X 4 Sq. ft per table
Standard quantity of materials for 1,000 tables 4,000 Sq ft
Labor Variances
Units produced…………………………………….. 1,000 tables
X standard direct labor hrs per unit………….. X 2 hours
Standard quantity of hours for 1,000 tables 2,000 hours
AQ 2,300 Hrs. AQ 2,300 Hrs. SQ 2,000 Hrs.
X AP X $7.80 X SP X 8.00 X SP X 8.00
21-15
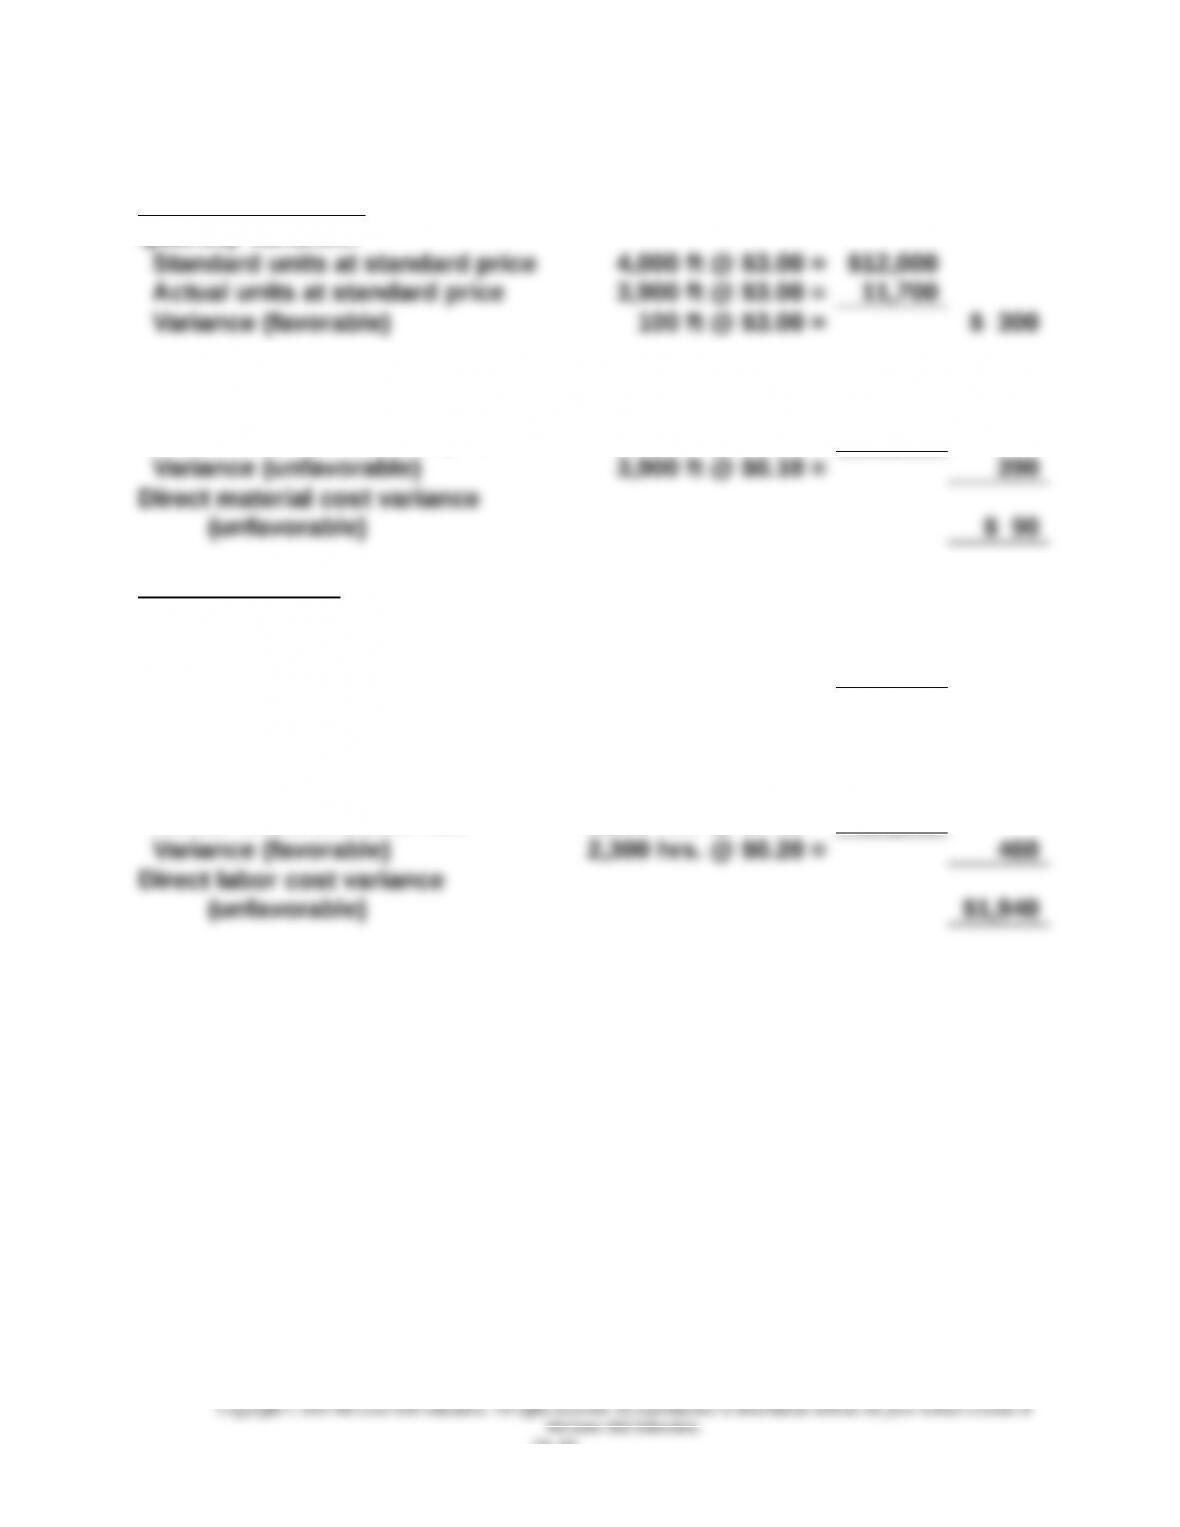
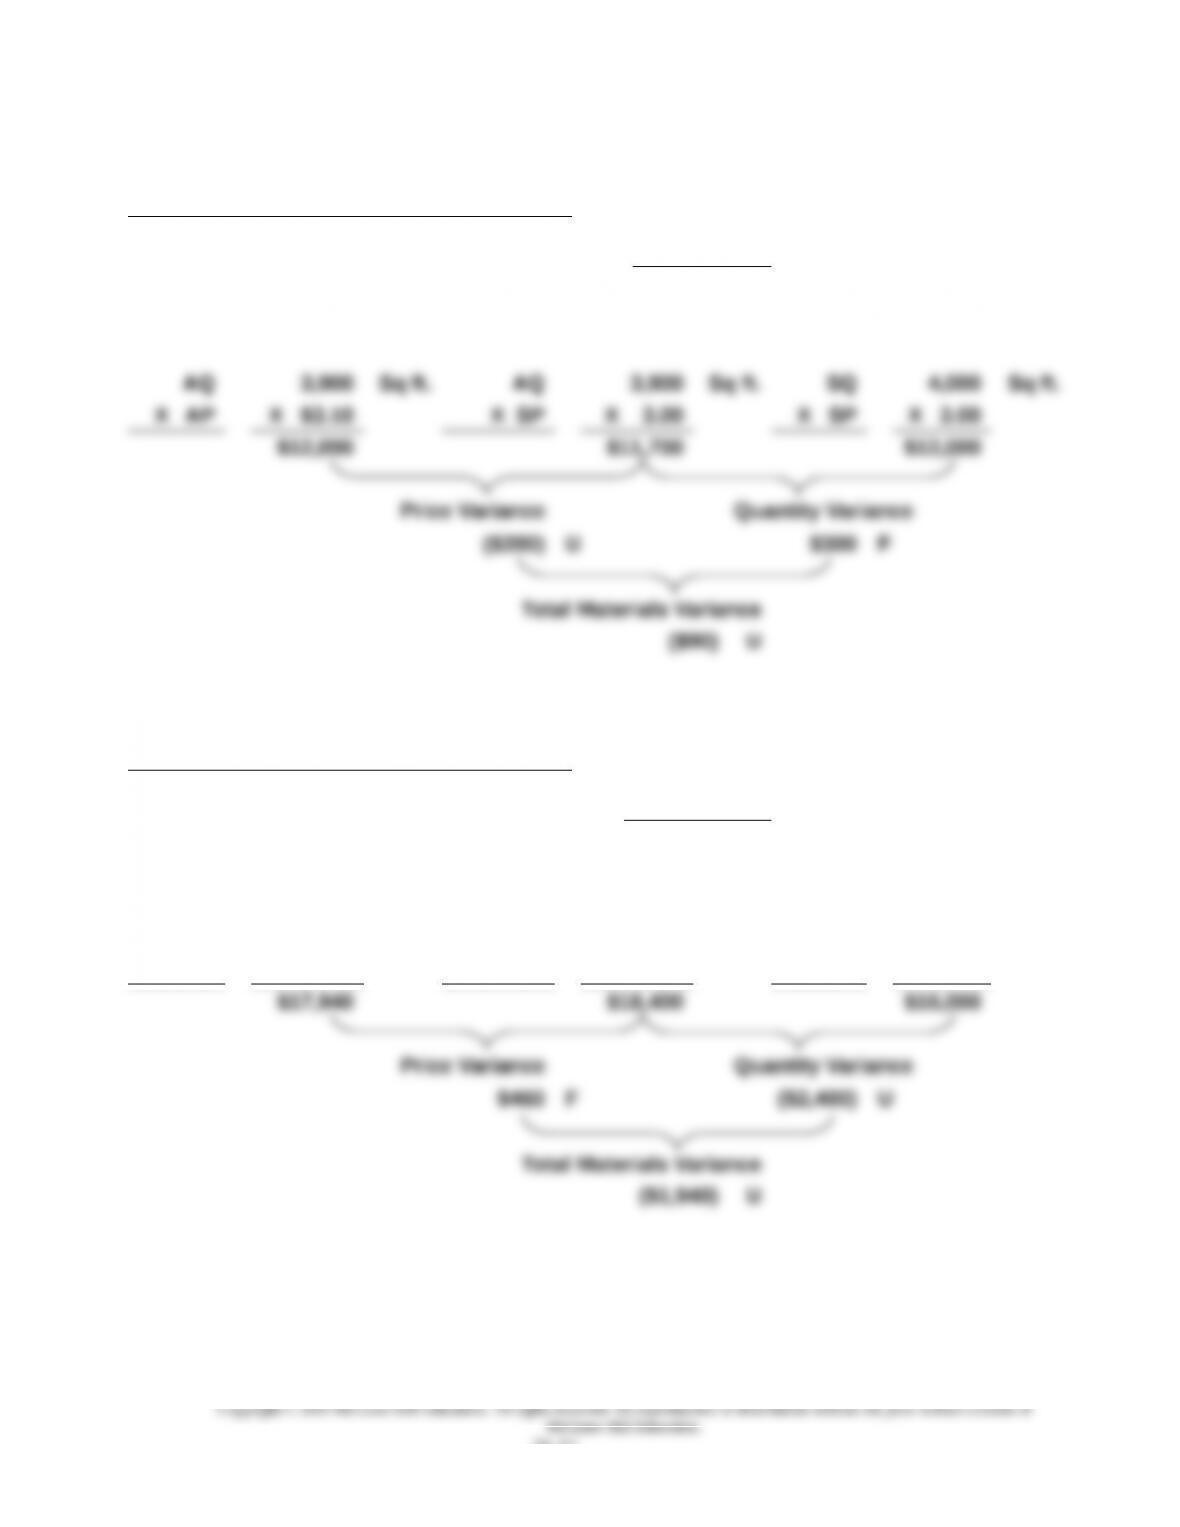
Material Variances:
Quantity Variance:
Price Variance:
Actual units at actual price 3,900 ft @ $3.10 = $12,090
Actual units at standard price 3,900 ft @ $3.00 = 11,700
Labor Variances:
Efficiency (Quantity) Variance
Actual hours at standard rate 2,300 hrs. @ $8.00 = $18,400
Standard hours at standard rate 2,000 hrs. @ $8.00 = 16,000
Variance (unfavorable) 300 hrs. @ $8.00 = $2,400
Rate (Price) Variance:
Actual hours at standard rate 2,300 hrs. @ $8.00 = $18,400
Actual hours at actual rate 2,300 hrs. @ $7.80 = 17,940
21-16
Solution: Problem #2
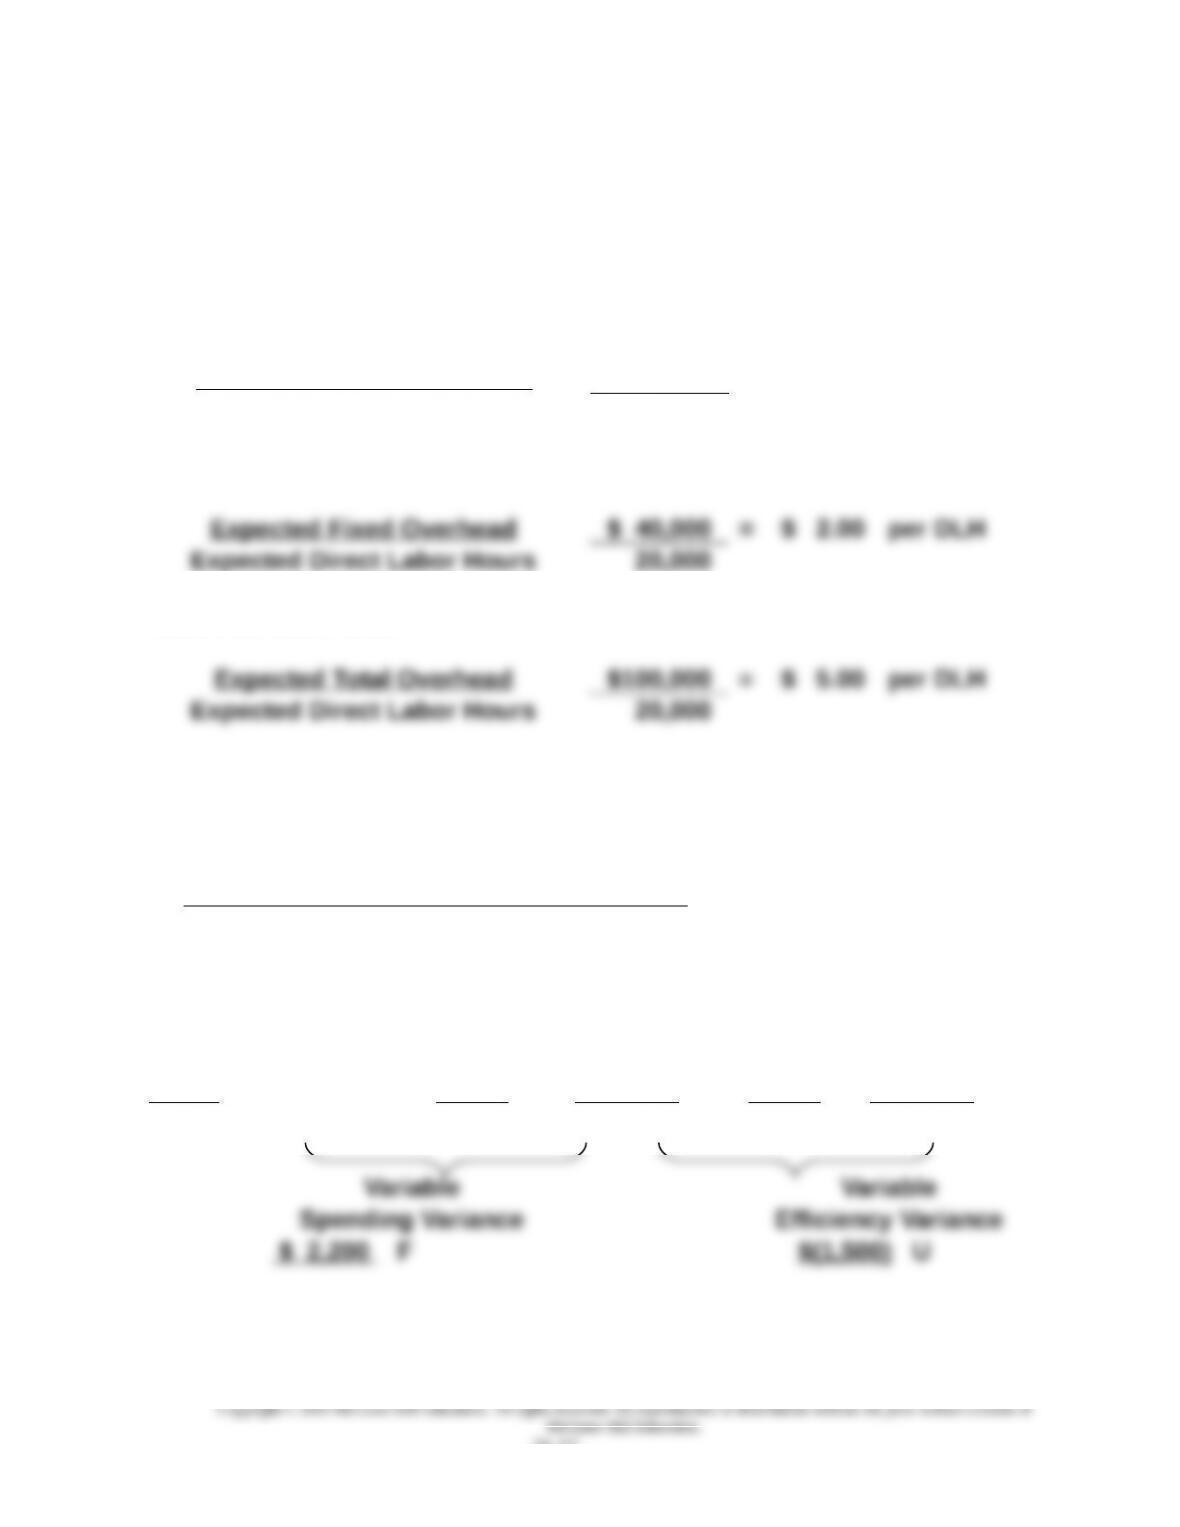
1. Compute the predetermined overhead rates
Overhead at operating level expected (80%) or 10,000 units
Variable Overhead Rate:
Expected Variable Overhead $ 60,000 = $ 3.00 per DLH
Expected Direct Labor Hours 20,000
Fixed Overhead Rate:
Total Overhead Rate:
2. Variable Overhead Variance Computations
Actual Variable Applied Variable
Overhead Overhead
AH AH 16,500 SH 16,000
x AVR x SVR $ 3.00 x SVR $ 3.00
total $47,300 $49,500 $48,000
21-17
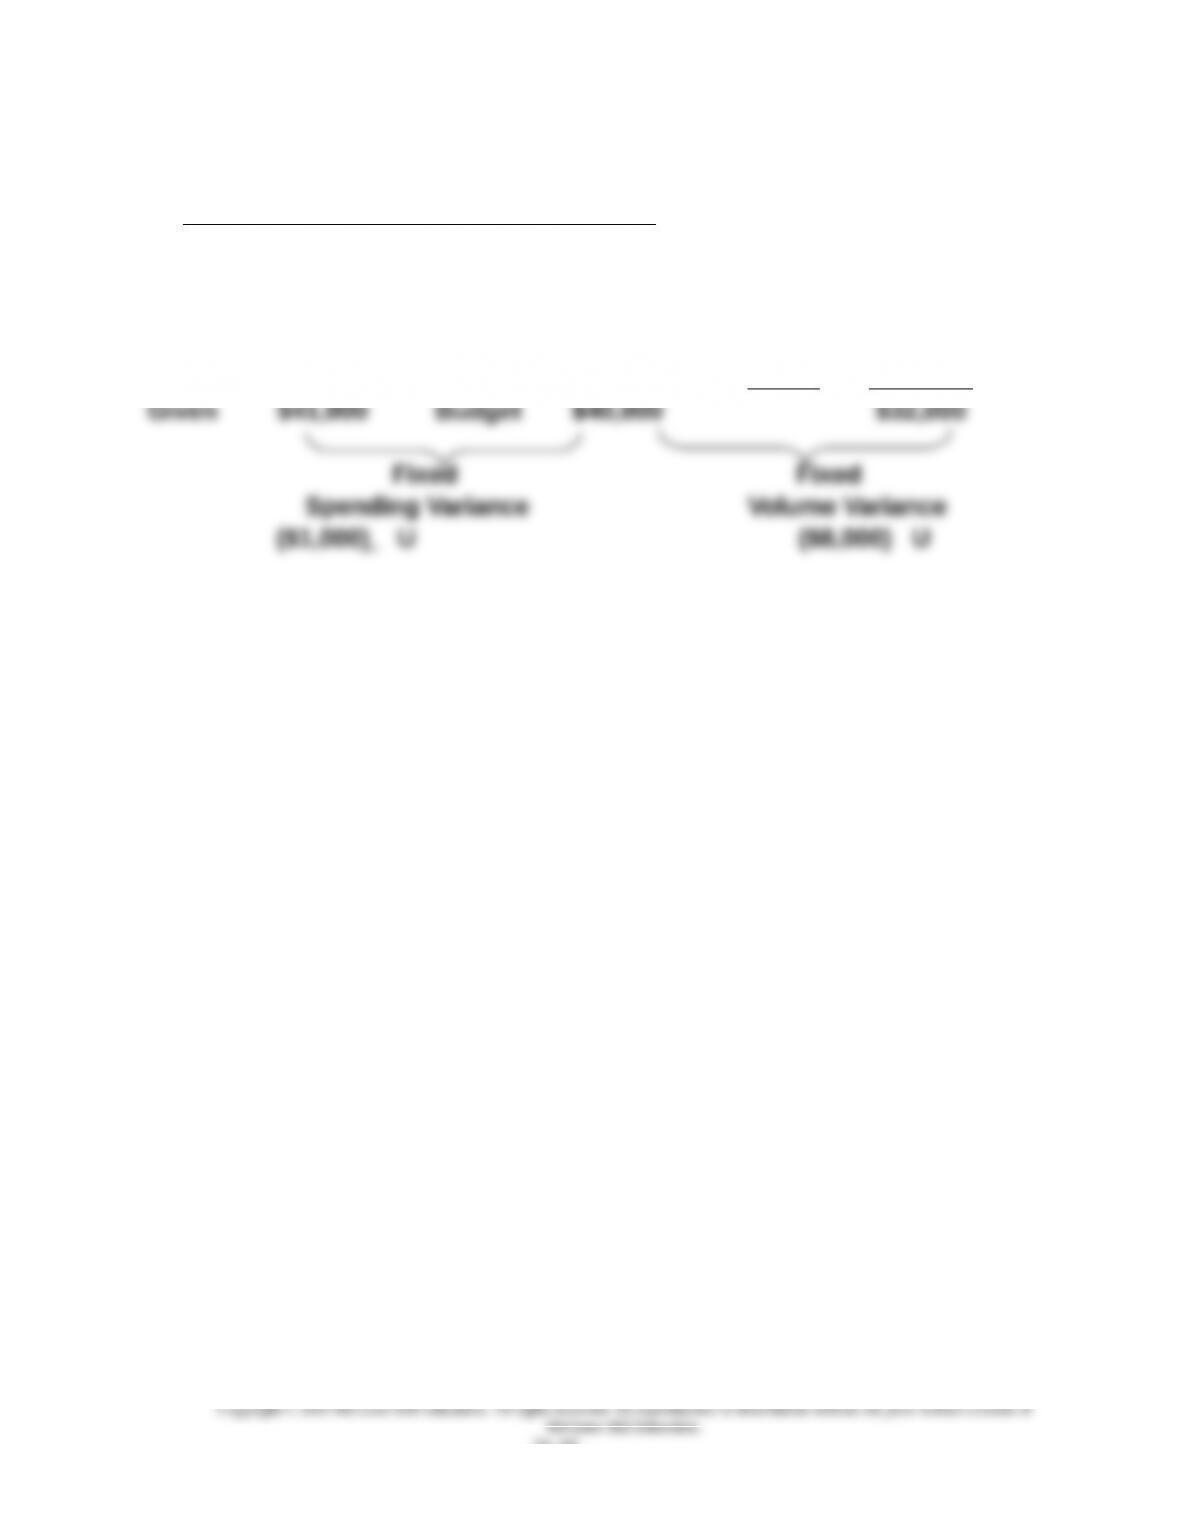
3. Fixed Overhead Variance Computations
Actual Fixed Applied Fixed
Overhead Overhead
SH 16,000
From x SVR $ 2.00
21-18