Exercise 18-23 (25 minutes)
1. Selling price per composite unit
5 Easy returns @ $50 each………………..…………….….….….….….….. $ 250
2. Variable costs per composite unit
5 Easy returns @ $30 each………………..…………….….….….….….….. $ 150
3 Moderate returns @ $75 each………………………………..………….… 225
3. Break-even point in composite units
Fixed costs .
= Contribution margin per composite unit
4. Unit sales of Easy, Moderate, and Business returns at break-even point
Easy: 5 x 30 units (from 3)…..….….…..…..150 units
Exercise 18-24 (30 minutes)
Instructor note: This exercise is solved in 3 steps
1. Prepare a contribution margin income statement for Co. A to compute its DOL;
Step 1.
Company A
Contribution Margin Income Statement
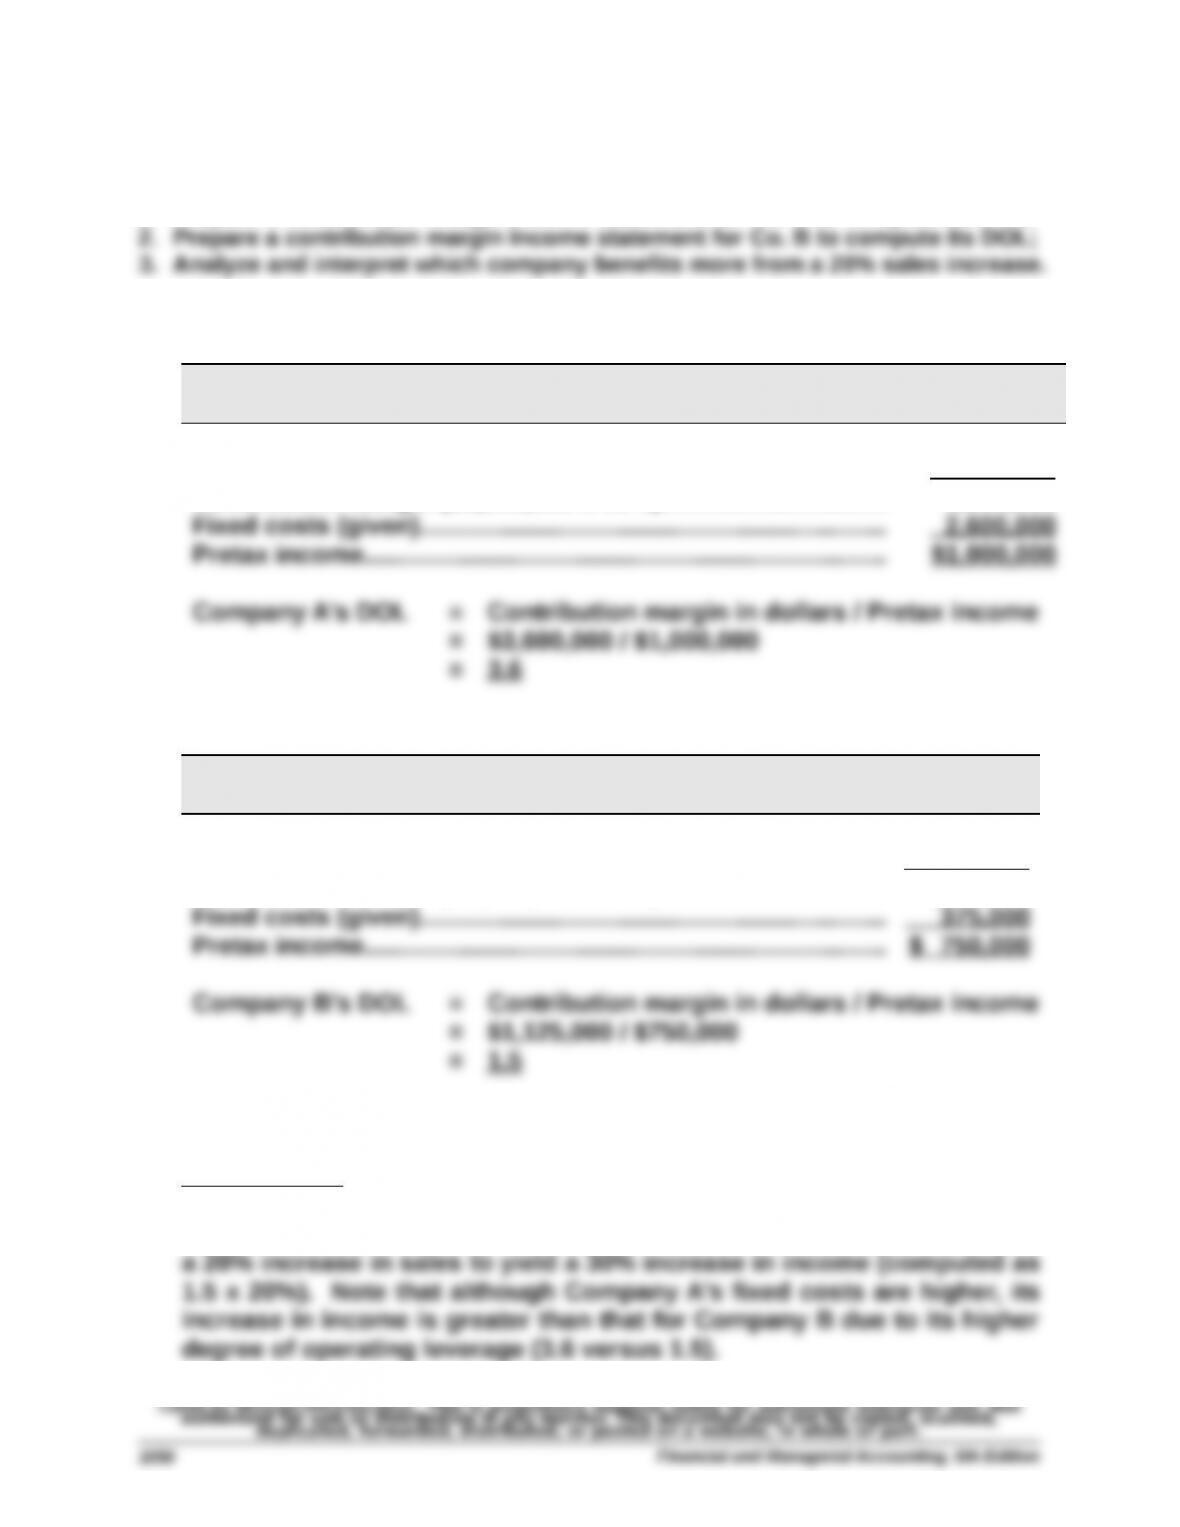
Sales (given)………………………………..………………….….…..….…. $6,000,000
Variable costs [$6,000,000 x (100% – 60%)]……….……………... 2,400,000
Contribution margin ($6,000,000 x 60%)…………….….….….…. 3,600,000
Step 2.
Company B
Contribution Margin Income Statement
Sales (given)………………………………..………………….….…..….…. $4,500,000
Variable costs [$4,500,000 x (100% – 25%)]……….……………... 3,375,000
Contribution margin ($4,500,000 x 25%)…………….….….….…. 1,125,000
Step 3.
Interpretation: Company A benefits more from a 20% increase in sales.
This is because we expect a 20% increase in sales to yield a 72%
increase in income (computed as 3.6 x 20%). For Company B we expect
Exercise 18-25 (10 minutes)
1. Degree of operating leverage = Total contribution margin
Pretax income
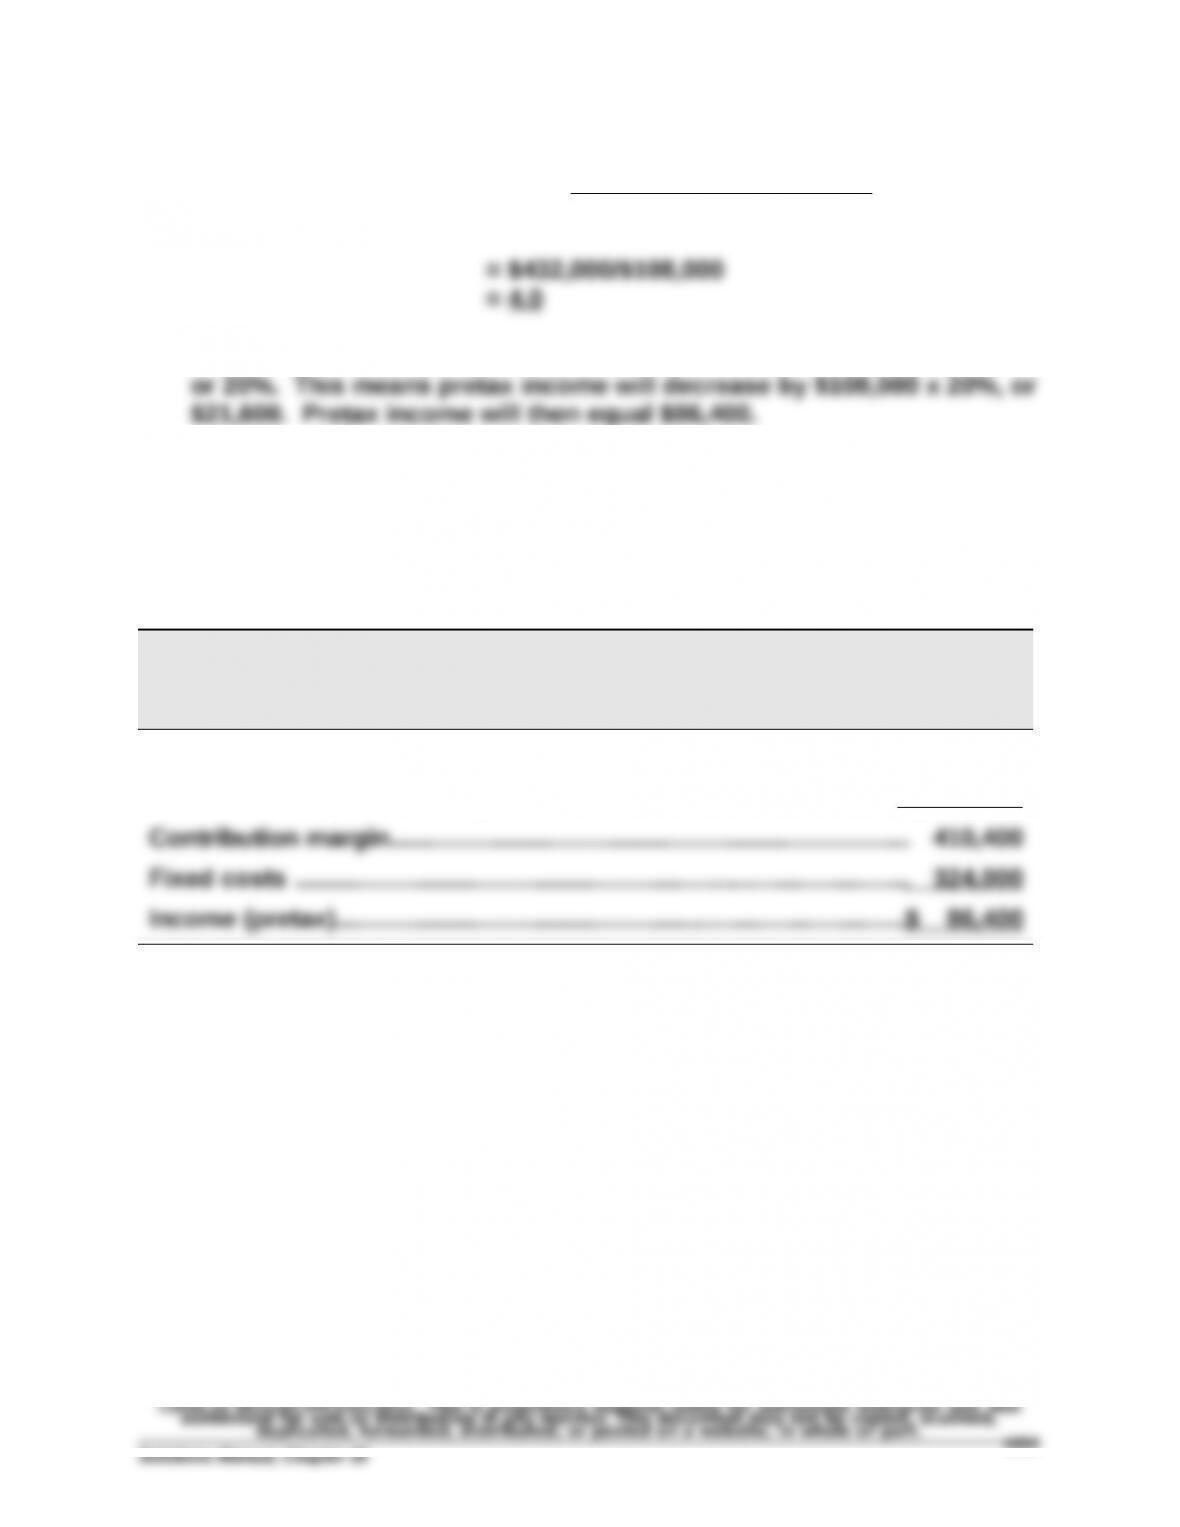
2. If sales decrease by 5%, then pretax income will decrease by 4.0 x 5%,
3. If sales decrease by 5%, a total of 9,120 (computed as 9,600 x 95%)
units will be sold.
Contribution margin income statement, assuming 5% sales decrease:
HUDSON CO.
Forecasted Contribution Margin Income Statement
For Year Ended December 31, 2016
Sales (9,120 x $225)……………….…………………………….….….….….…...$2,052,000
Variable costs (9,120 x $180)……………….……….….….….….….….….… 1,641,600
PROBLEM SET A
Problem 18-1A (25 minutes)
Parts 1 and 2
Tight Drums Company
Contribution Margin Income Statement
For Year Ended December 31, 2015
(1,000 units) Per unit % of sales
Sales ($500 x 1,000)……..……………….. $500,000 $500 100%
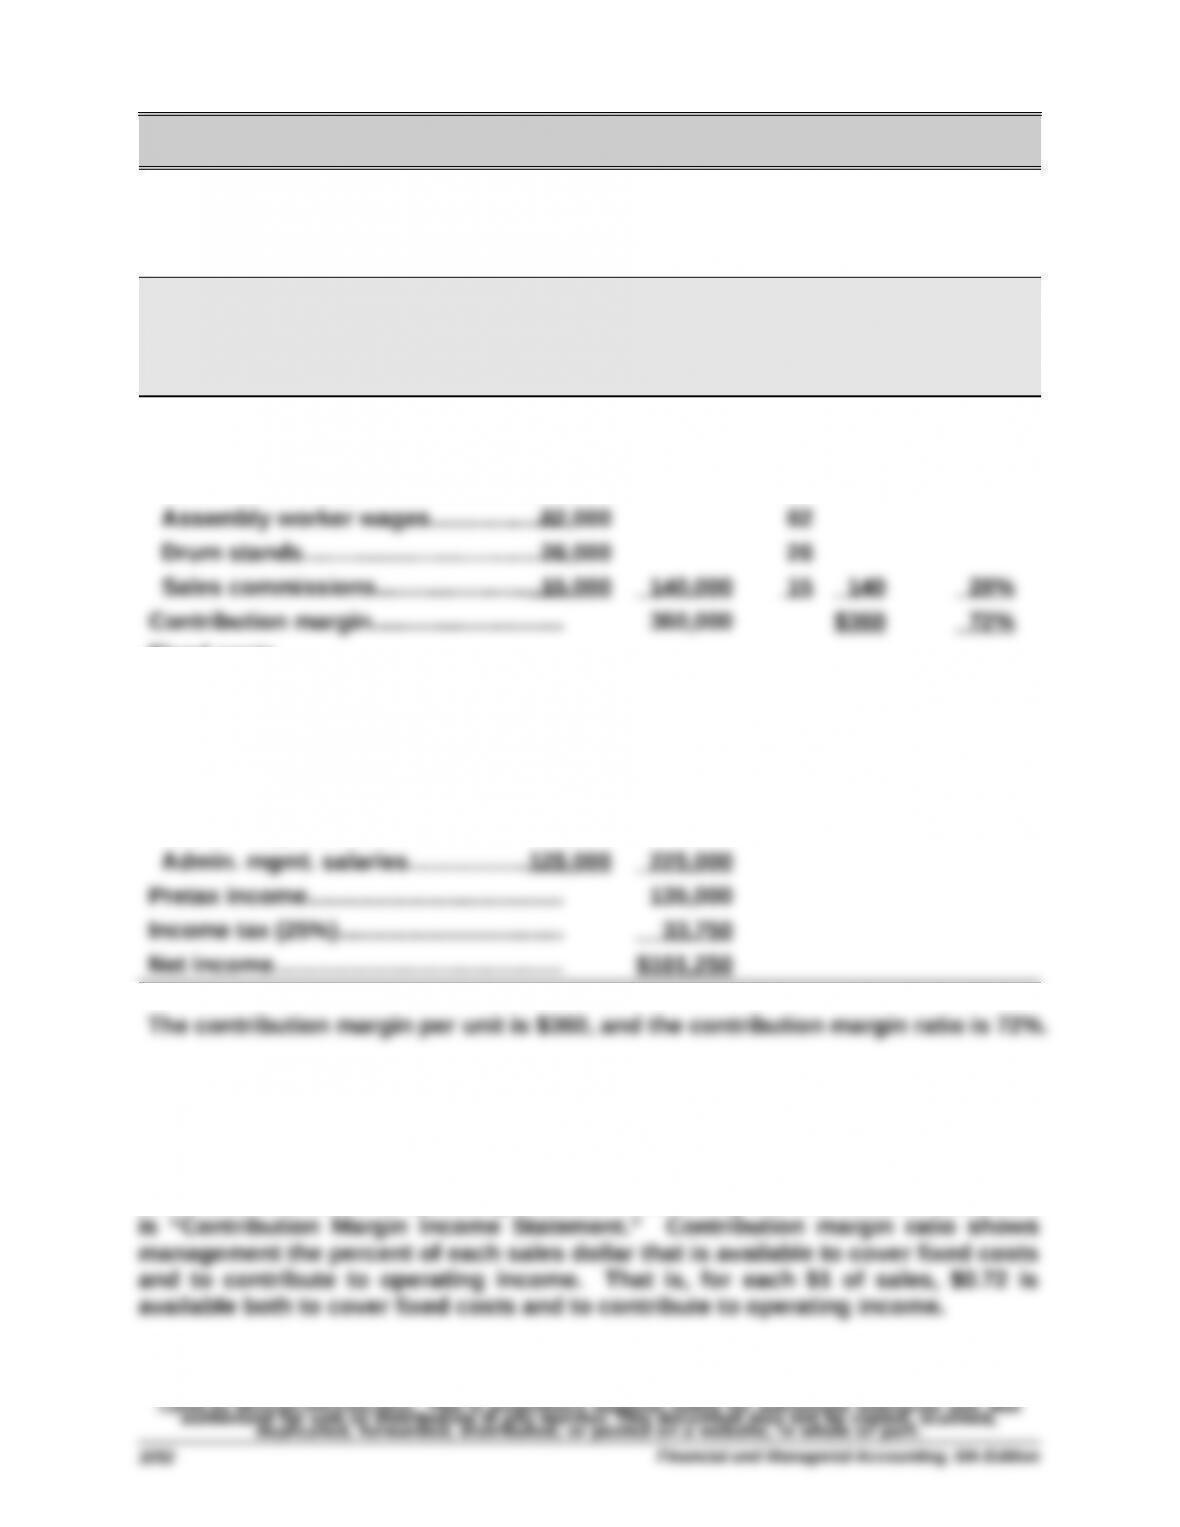
Variable costs
Plastic for casing…………………….…..$17,000 $17
Fixed costs
Taxes on factory……..……………..……...5,000
Factory maintenance……..………….…..10,000
Factory machinery deprec…...…........40,000
Sales equipment lease…..……..………..10,000
Accounting staff salaries…….............35,000
Part 3 Analysis Component
Contribution margin shows how much of total sales are available to cover fixed
costs and contribute to operating income. This is why the title for this statement
Problem 18-2A (45 minutes)
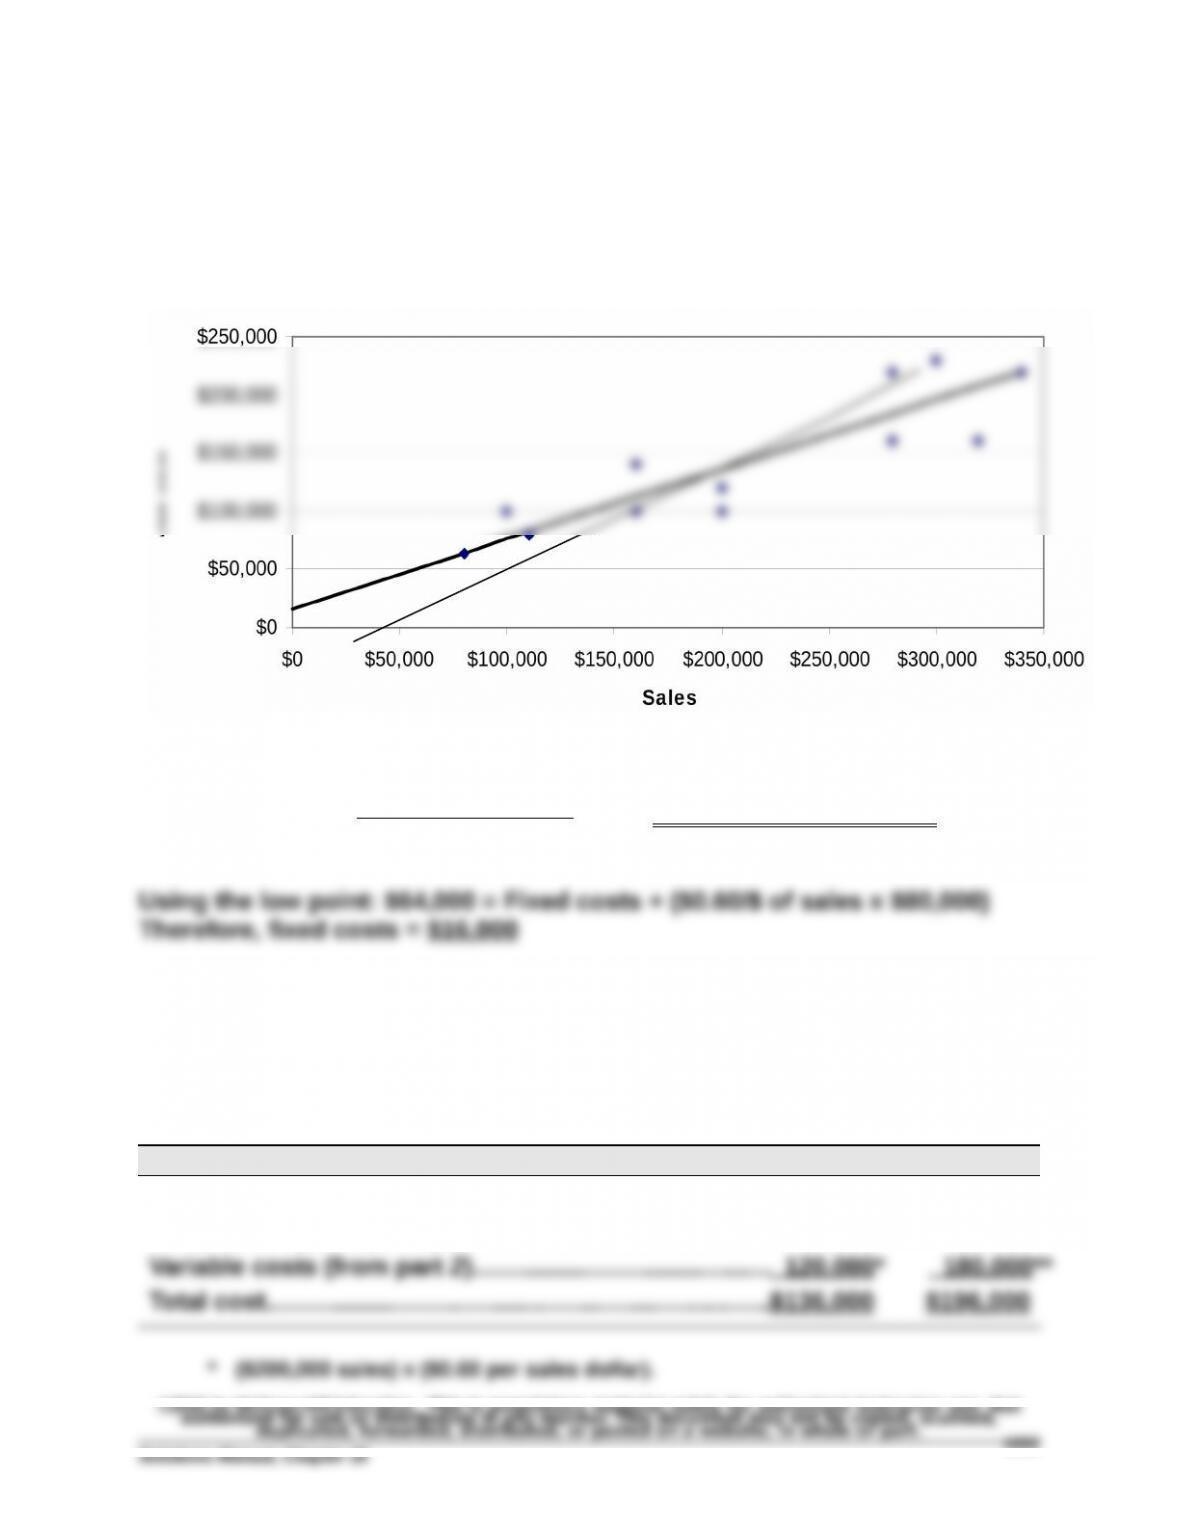
Parts 1 and 2
The scatter diagram and its estimated line of cost behavior appear below.
Part 2 – Calculation of variable and fixed costs
Variable costs = = $0.60 per dollar of sales
Part 3
The estimates in Part 2 can be used to predict the total costs that will be
incurred at sales levels of $200,000 and $300,000.
Predictions
Sales (given)………………………………..……………..….….….$200,000 $300,000
Fixed costs (from part 2)……………………….….….….….… 16,000 16,000
$220,000 – $64,000
$340,000 – $80,000
Alden Co.
Problem 18-3A (40 minutes)
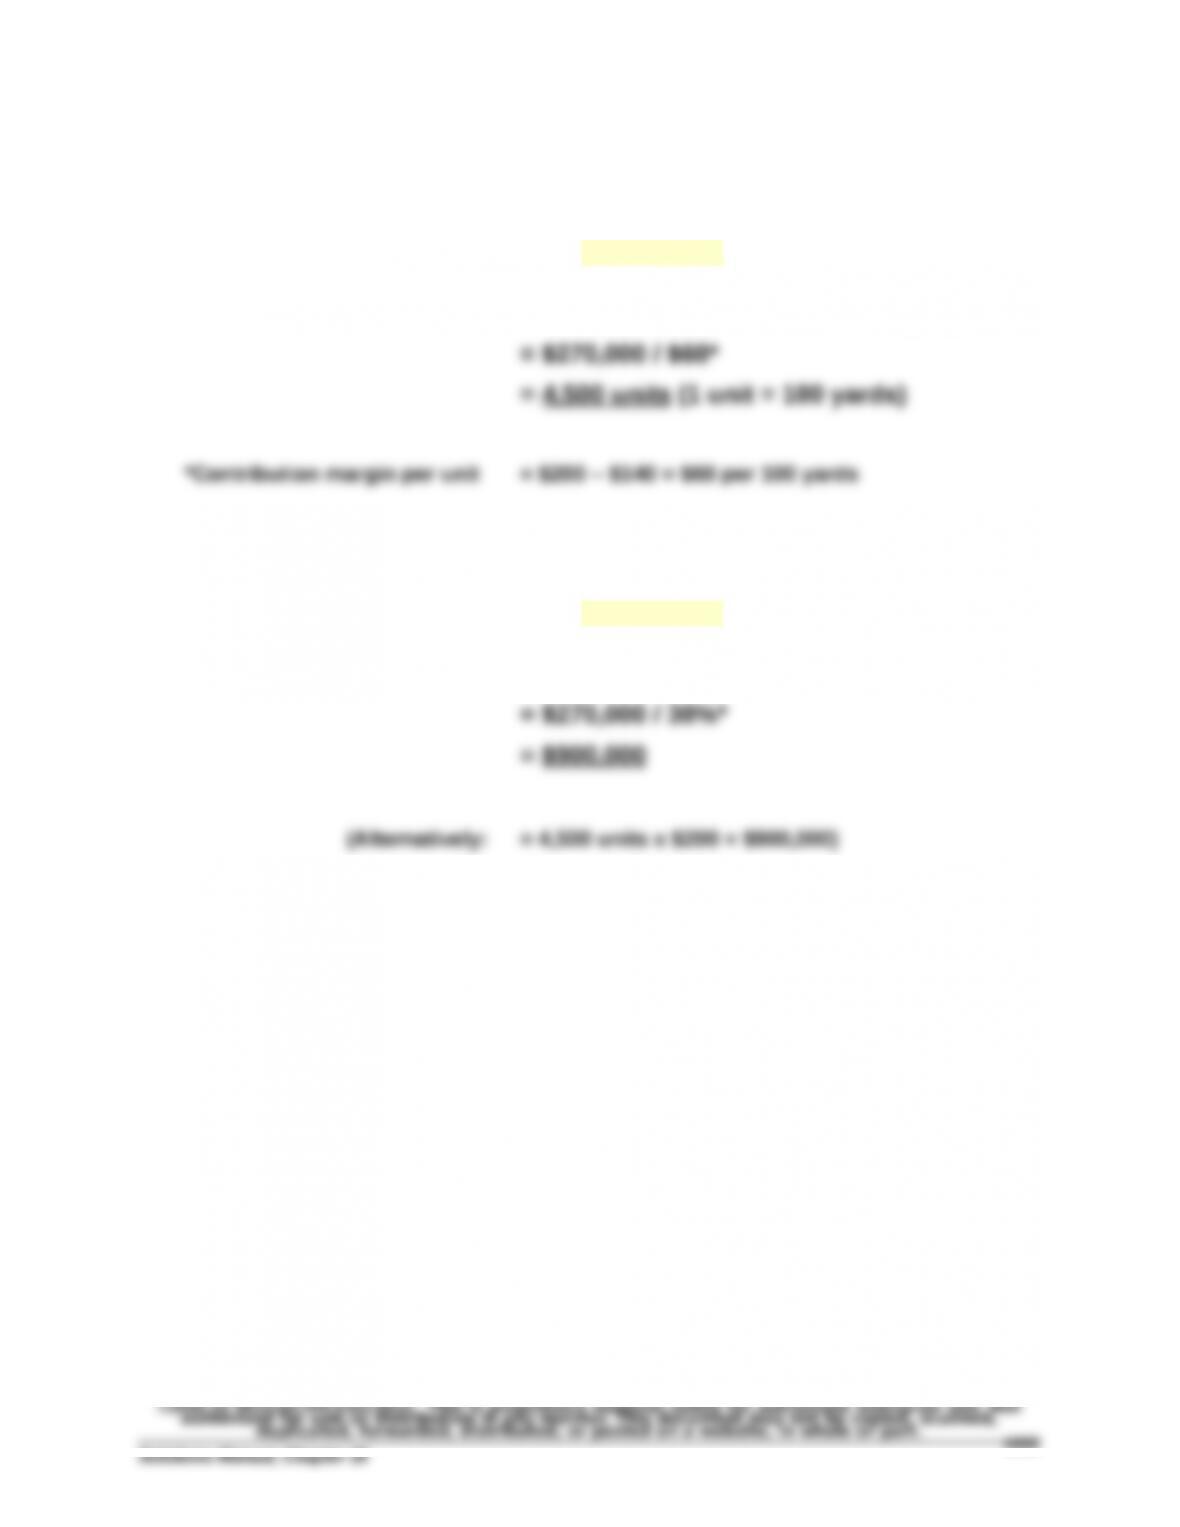
Part 1
(a)Instructor note: Use the equation in Exhibit 18.11
Break-even in sales units = Fixed costs / Contribution margin per unit
(b)Instructor note: Use the equation in Exhibit 18.12
Break-even in sales dollars = Fixed costs / Contribution margin ratio
*Contribution margin ratio = $60 / $200 = 30%
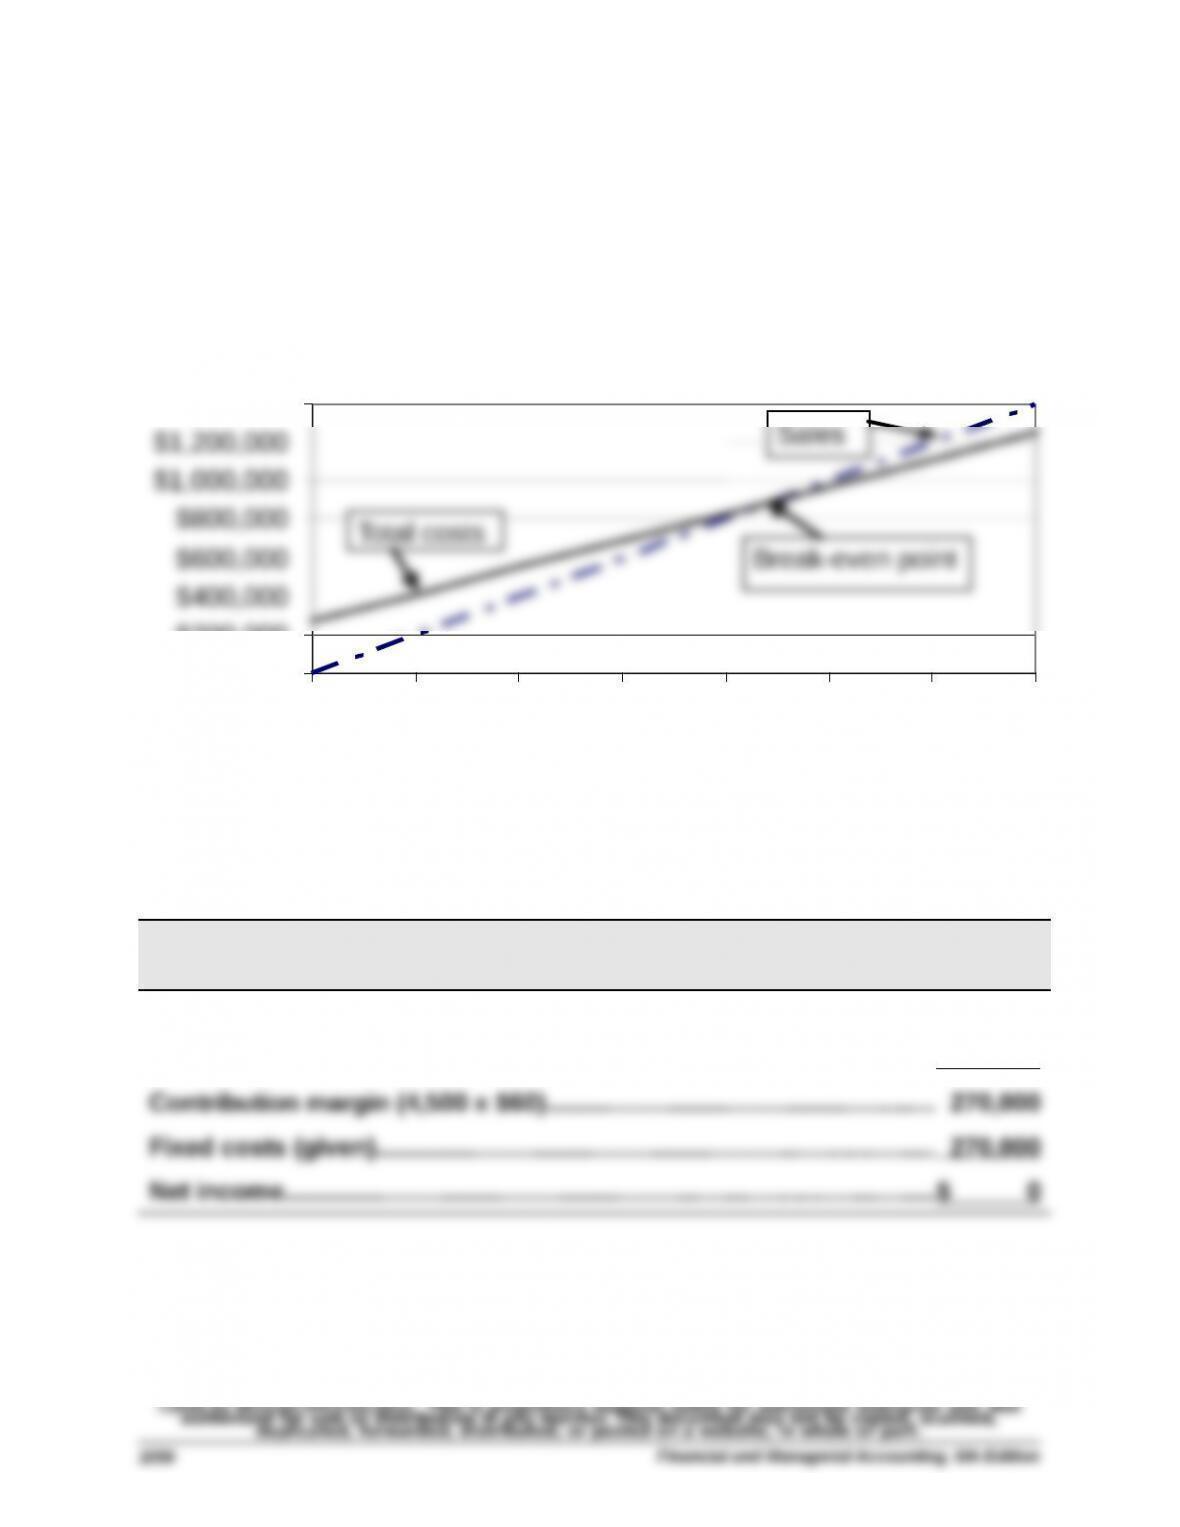
Problem 18-3A (Continued)
Part 2
CVP Chart for Praveen Company
$800,000
$1,000,000
$1,200,000
$1,400,000
Sales
Problem 18-4A (75 minutes)
Part 1 Instructor note: Use the equation in Exhibit 18.12
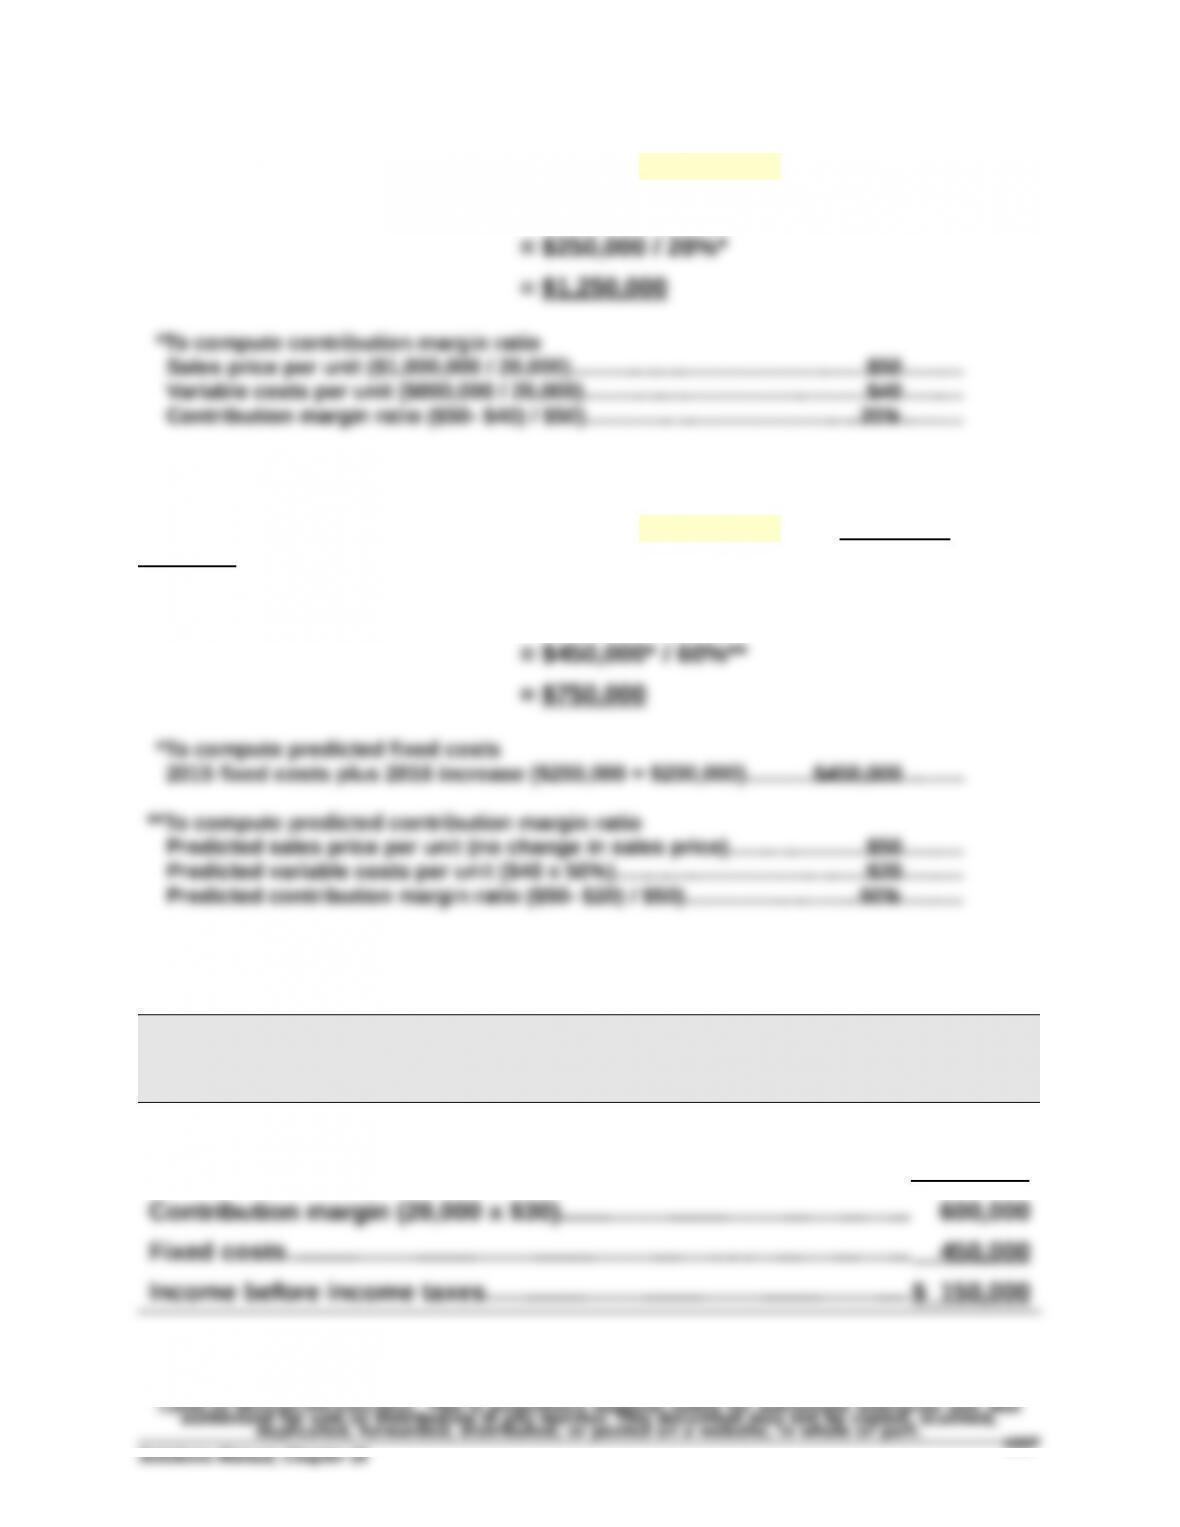
2015 break-even in sales dollars = Fixed costs / Contribution margin ratio
Part 2 Instructor note: Use the equation in Exhibit 18.12 with predicted
numbers
2016 break-even in sales dollars = Fixed costs / Contribution margin ratio
Part 3
ASTRO COMPANY
Forecasted Contribution Margin Income Statement
For Year Ended December 31, 2016
Sales (20,000 x $50)……………….…………………………….….….….….…...$1,000,000
Variable costs (20,000 x $20)……………….……….….….….….….….….… 400,000
Problem 18-4A (Continued)
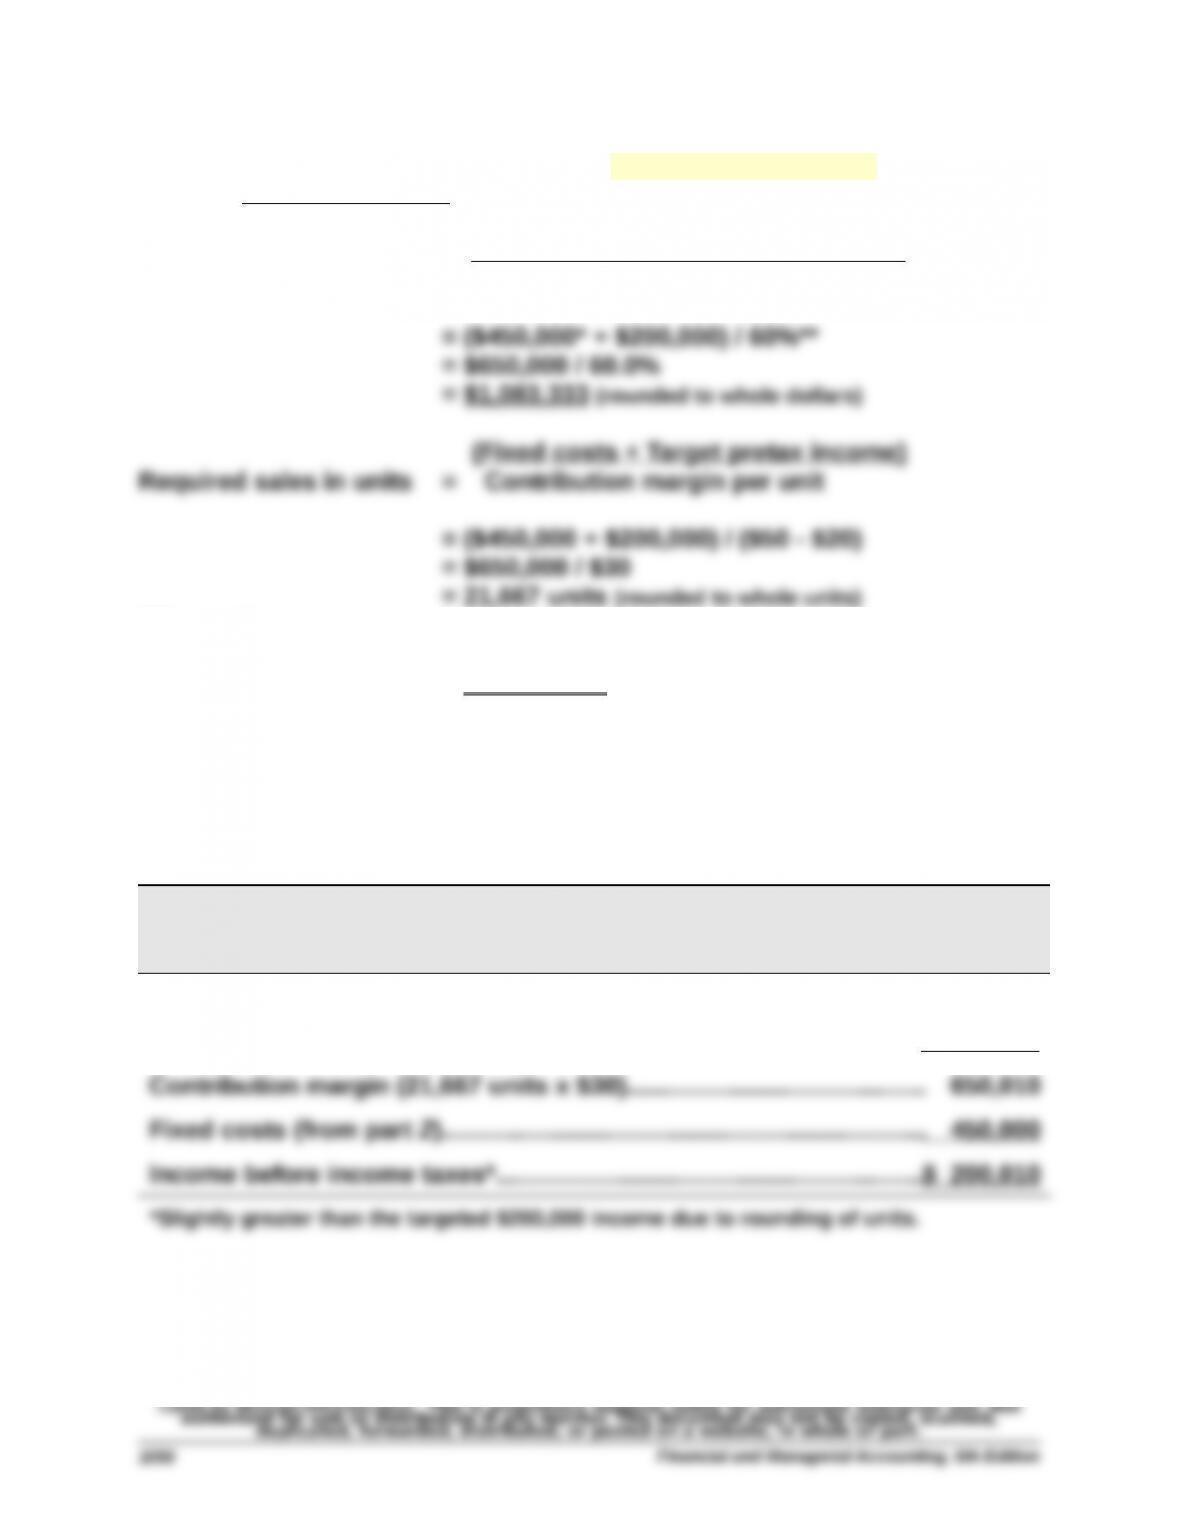
Part 4 Instructor note: Use equations in Exhibits 18.22 and 18.23 with
predicted numbers
(Fixed costs + Target pretax income)
Required sales in dollars = Contribution margin ratio
Alternately:
Required sales in units = $1,083,333† / $50 Sales price per unit
= 21,667 units (rounded to whole units)
* 2015 fixed costs plus 2016 increase ($250,000 + $200,000)……………….….…..…$450,000
** Predicted contribution margin ratio ($50- $30) / $50)—from part 2……............. 60%
† Taken from “required sales in dollars” above
Part 5
ASTRO COMPANY
Forecasted Contribution Margin Income Statement
For Year Ended December 31, 2016
Sales (21,667 units x $50)………………….……………….………….….…..…..$1,083,350
Variable costs (21,667 units x $20)………….………………….….….….…... 433,340