
Chapter Outline
C. Sensitivity Analysisknowing the effects of changing some estimates
used in CVP analysis by substituting new estimated amounts (in total
or per unit as appropriate) in the related formula can be helpful in
making predictions. Can also use the contribution margin income
statement.
D. Multiproduct Break-Even PointModify basic CVP analysis when
company produces and sells several products.
1. Important assumptionSales mix of the different products is
known and remains constant.
2. Sales mix is the ratio (proportion) of the sales volumes for
various products.
3. To apply multiproduct CVP analysis, estimate break-even point
by using a composite unit.
a. Determine sales mix of various products.
b. Composite Unit—a specific number of units of each product
in proportion to their expected sales mix. Multi-product CVP
treats this composite unit as a single product
c. Using sales mix, determine the selling price of a composite
unit by multiplying the sales mix ratio times the selling price
of each product and then adding the totals for all of the
products.
d. Compute the variable cost of a composite unit in the same
manner.
e. Determine the CM per composite unit by subtracting the total
variable price from the total selling price of the composite
unit
f. In break-even analysis, a composite unit is treated as a unit
of a single product.
g. Break-even point in composite units is computed as:
Fixed Costs _ = Composite Units to break-even
CM per composite unit
h. To determine how many units of each product must be sold to
break even, multiply the number of units of each product in
the composite (sales mix) by the break-even point in
composite units.
Notes
18-8

Chapter Outline
E. Assumptions of Cost-Volume-Profit Analysis
1. Usefulness depends on validity of three assumptions.
a. Constant selling price per unit.
b. Constant variable costs per unit.
c. Constant total fixed costs.
2. If expected cost and revenue behavior is different from three
assumptions stated above, CVP analysis may still be useful.
a. Summing of costs can offset individual
deviationsIndividual variable cost items may not be
perfectly variable, but when summed, individual deviations
can offset each other. The same can be said for fixed costs.
b. Relevant range of operationsAssumes a specific cost is
variable or fixed is more likely valid when operations are
within the relevant range. (If normal range of activity
changes, some costs may need reclassification.)
c. Estimates from CVP analysisManagers need to understand
that CVP analysis provides approximate estimates about
future, not precise answers, and that other qualitative factors
should also be considered.
V. Decision Analysis–Degree of Operating Leverage
A. Useful tool in assessing the effect of changes in the level of sales on
income is the degree of operating leverage computation.
B. Operating leverage is the extent, or relative size, of fixed costs in the
total cost structure.
C. Degree of operating leverage (DOL) is computed as:
Total Contribution margin (dollars)
pretax income
D. Use DOL to measure the effect of changes in the level of sales on
pretax income by multiplying DOL by the percentage change in sales.
Notes
18-9

Alternate Demo Problem 18
Problem #1
Trimble Company sells an electronic toy for $40. The variable cost is $24
per unit and the fixed cost is $32,000 per year. Management is considering
the following changes:
Alternative #1
Lease a new packaging machine for $4,000 per year, which will reduce
variable cost by $1 per unit.
Alternative #2
Increase selling price 10 percent to counteract an expected 25 percent
increase in fixed cost.
Alternative #3
Reduce fixed cost by 25 percent by moving to a lower rent location. This
would have the effect of increasing variable costs by 10 percent.
Required:
Consider and answer each of the following questions independently:
Round calculations to the nearest unit
(a) Determine the current break-even point in units and dollars.
(b)Determine the expected profit assuming alternative #1 and sales of
3,200 units.
(c) Determine the break-even point in units and dollars assuming
alternative #2.
(d)Determine the break-even point required in units and dollars
assuming alternative #3.
(e) Determine the volume of sales required to earn $23,600 assuming
alternative #3.
.
18-10

Alternative Demo Problem 18
Multi-product breakeven point
Problem #2
Handy Home sells window and doors in the ratio of 8:2 (windows:doors).
The selling price of each window is $200 and of each door is $500. The
variable cost of a window is $125 and of a door is $350. Fixed costs are
$900,000.
Required:
1. Determine the contribution margin for one composite unit
2. Compute the break-even point in composite units
3. Compute the number of units of each product that will be sold at the
Break-even point.
4. Compute the number of units of each product that need to be sold to
achieve a net income of $180,000.
.
18-11
Solution: Alternate Demo Problem 18
Problem #1
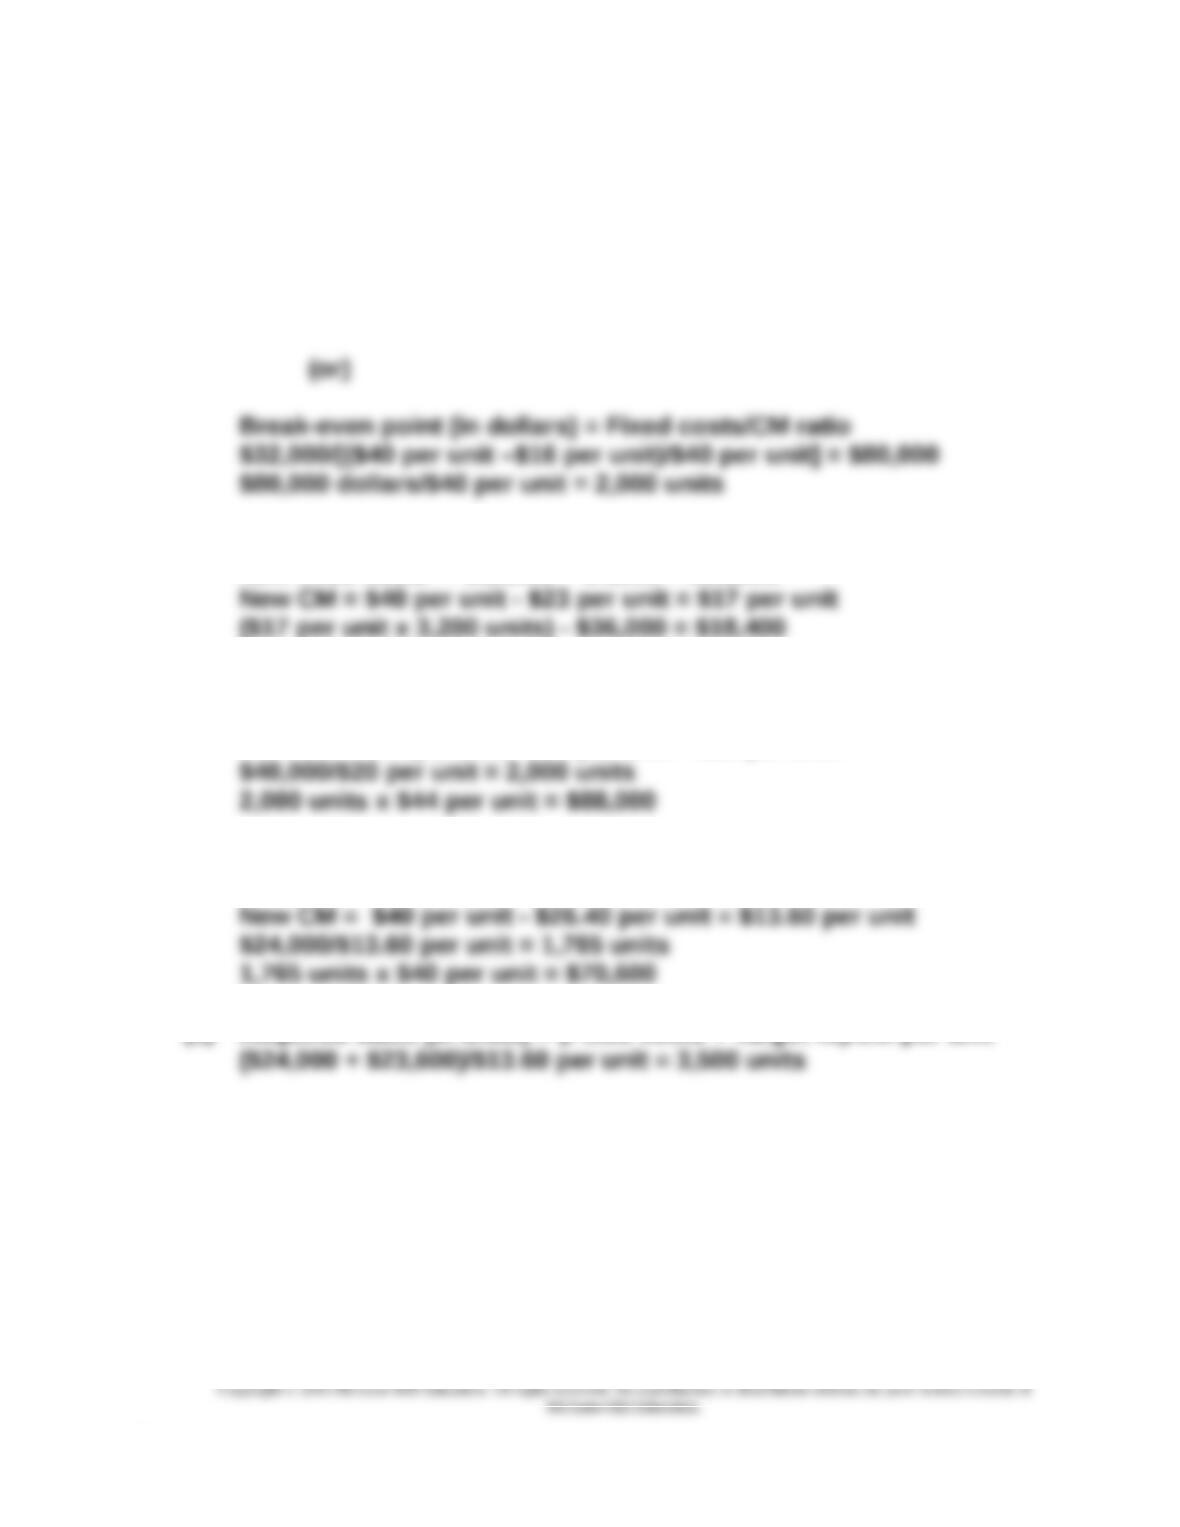
(a) Break-even point (in units) = Fixed costs/CM per unit
$32,000/($40 per unit – $24 per unit) = 2,000 units
2,000 units x $40 per unit = $80,000 dollars
(b) Net income = (CM per unit x number of units sold) – Fixed costs
New fixed costs = $32,000 + $4,000 = $36,000
(c) Break-even point (in units) = Fixed costs/CM per unit
New fixed costs = $32,000 + $8,000 = $40,000
New CM = $44 per unit – $24 per unit = $20 per unit
(d) Break-even point (in units) = Fixed costs/CM per unit
New fixed costs = $32,000 – $8,000 = $24,000
(e) Required sales (in units) = (Fixed costs + Target NI)/CM per unit
.
18-12
Solution: Alternate Demo Problem 18
Problem #2
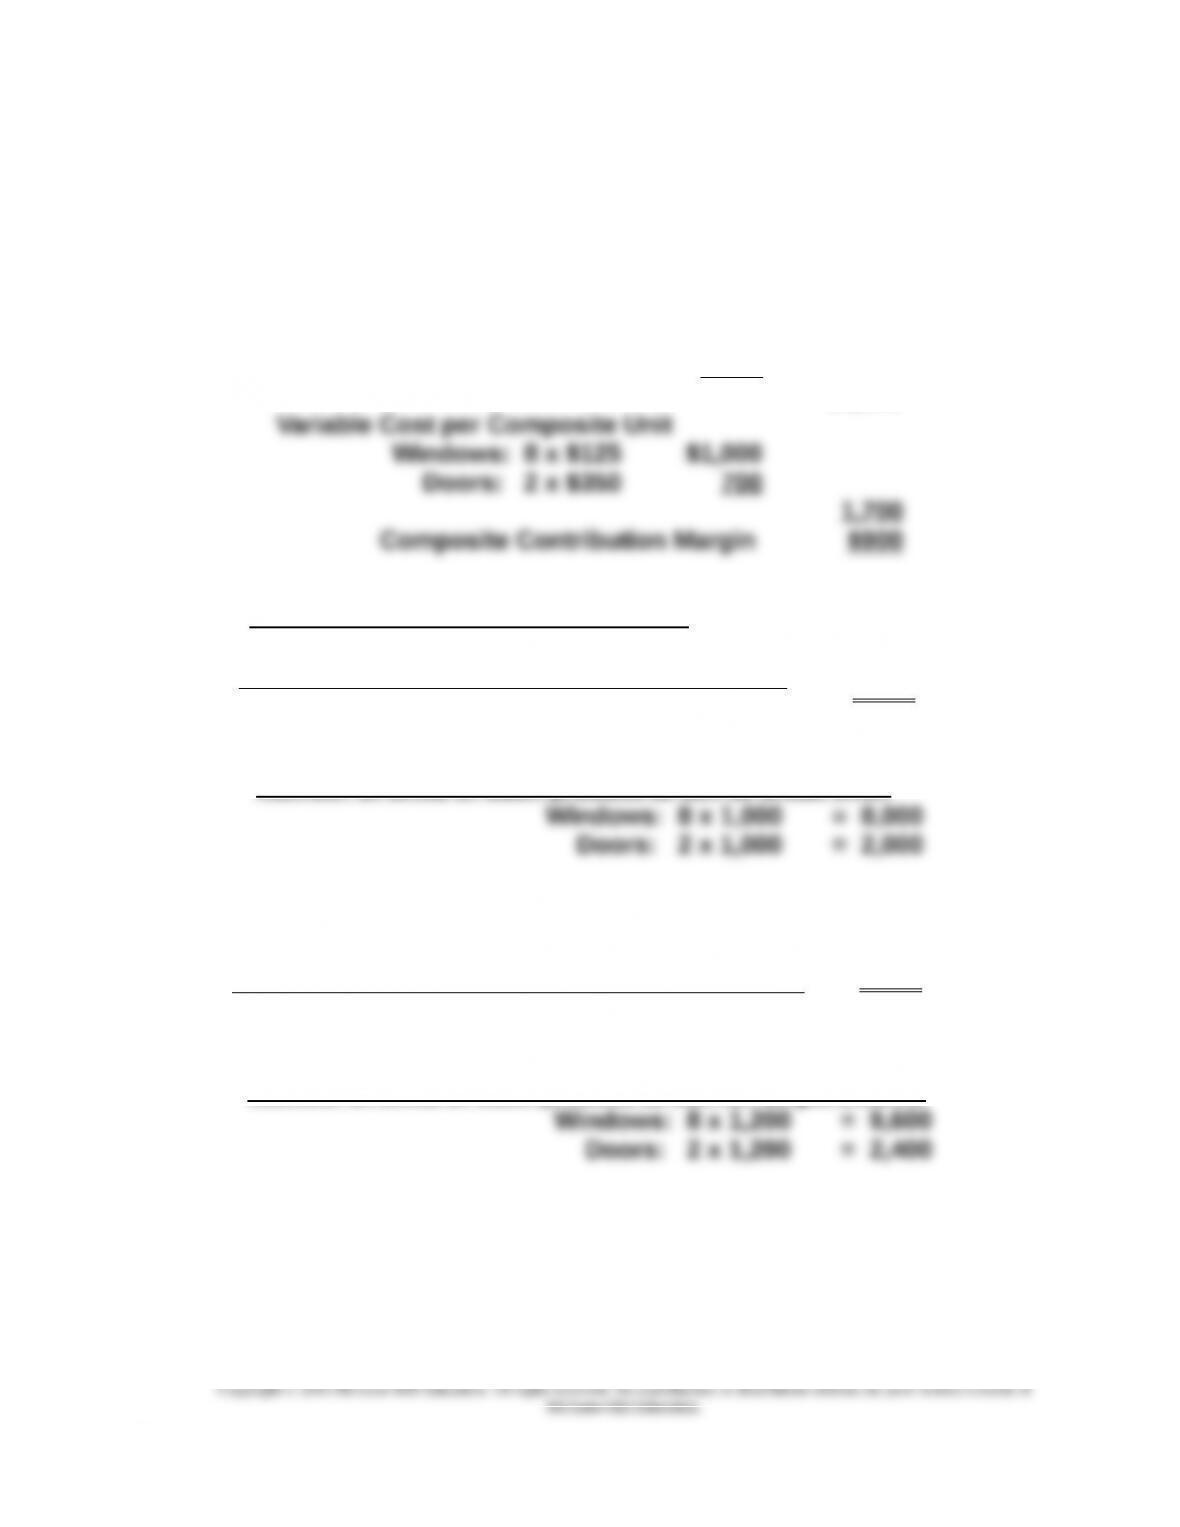
Selling Price per Composite Unit
Windows: 8 x $200 $1,600
Doors: 2 x $500 1,000
$2,600
Breakeven point in Composite Units:
Fixed Costs $900,000 = 1,000
Composite Contribution Margin $900
Number of units of each product to sell to break even
Composite Units to sell to achieve target Income:
Fixed Costs+ Target Income $1,080,000 = 1,200
Composite Contribution Margin $900
Number of units of each product to sell for target income
.
18-13