SERIAL PROBLEM — SP 13
Serial Problem — SP 13, Business Solutions (45 minutes)
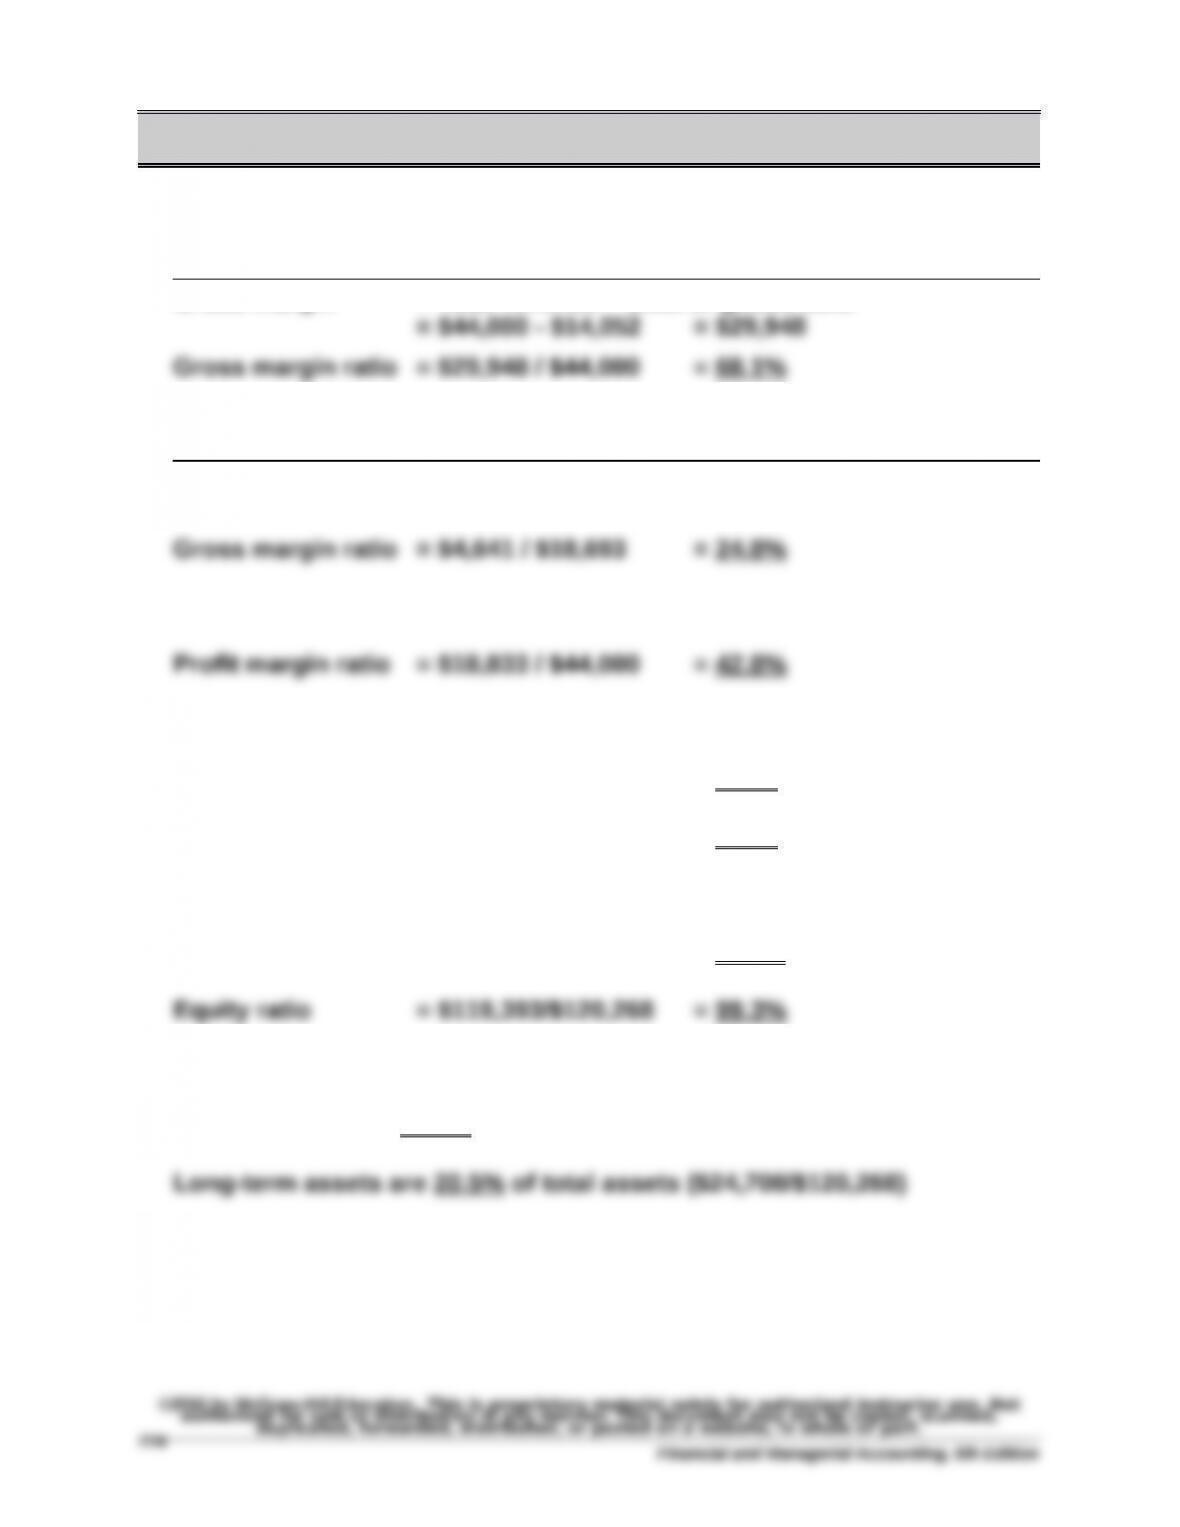
1. Gross margin with services revenue
Gross margin = Total revenue – Cost of goods sold
Gross margin without services revenue
Gross margin = Net (goods) sales – Cost of goods sold
= $18,693 – $14,052 = $4,641
2. Current ratio = $95,568 / $875 = 109.2
Acid-test ratio = $90,924 / $875 = 103.9
3. Debt ratio = $875 / $120,268 = 0.7%
4. Current assets are 79.4% of total assets ($95,568/$120,268)
Financial and Managerial Accounting, 6th Edition
Reporting in Action — BTN 13-1
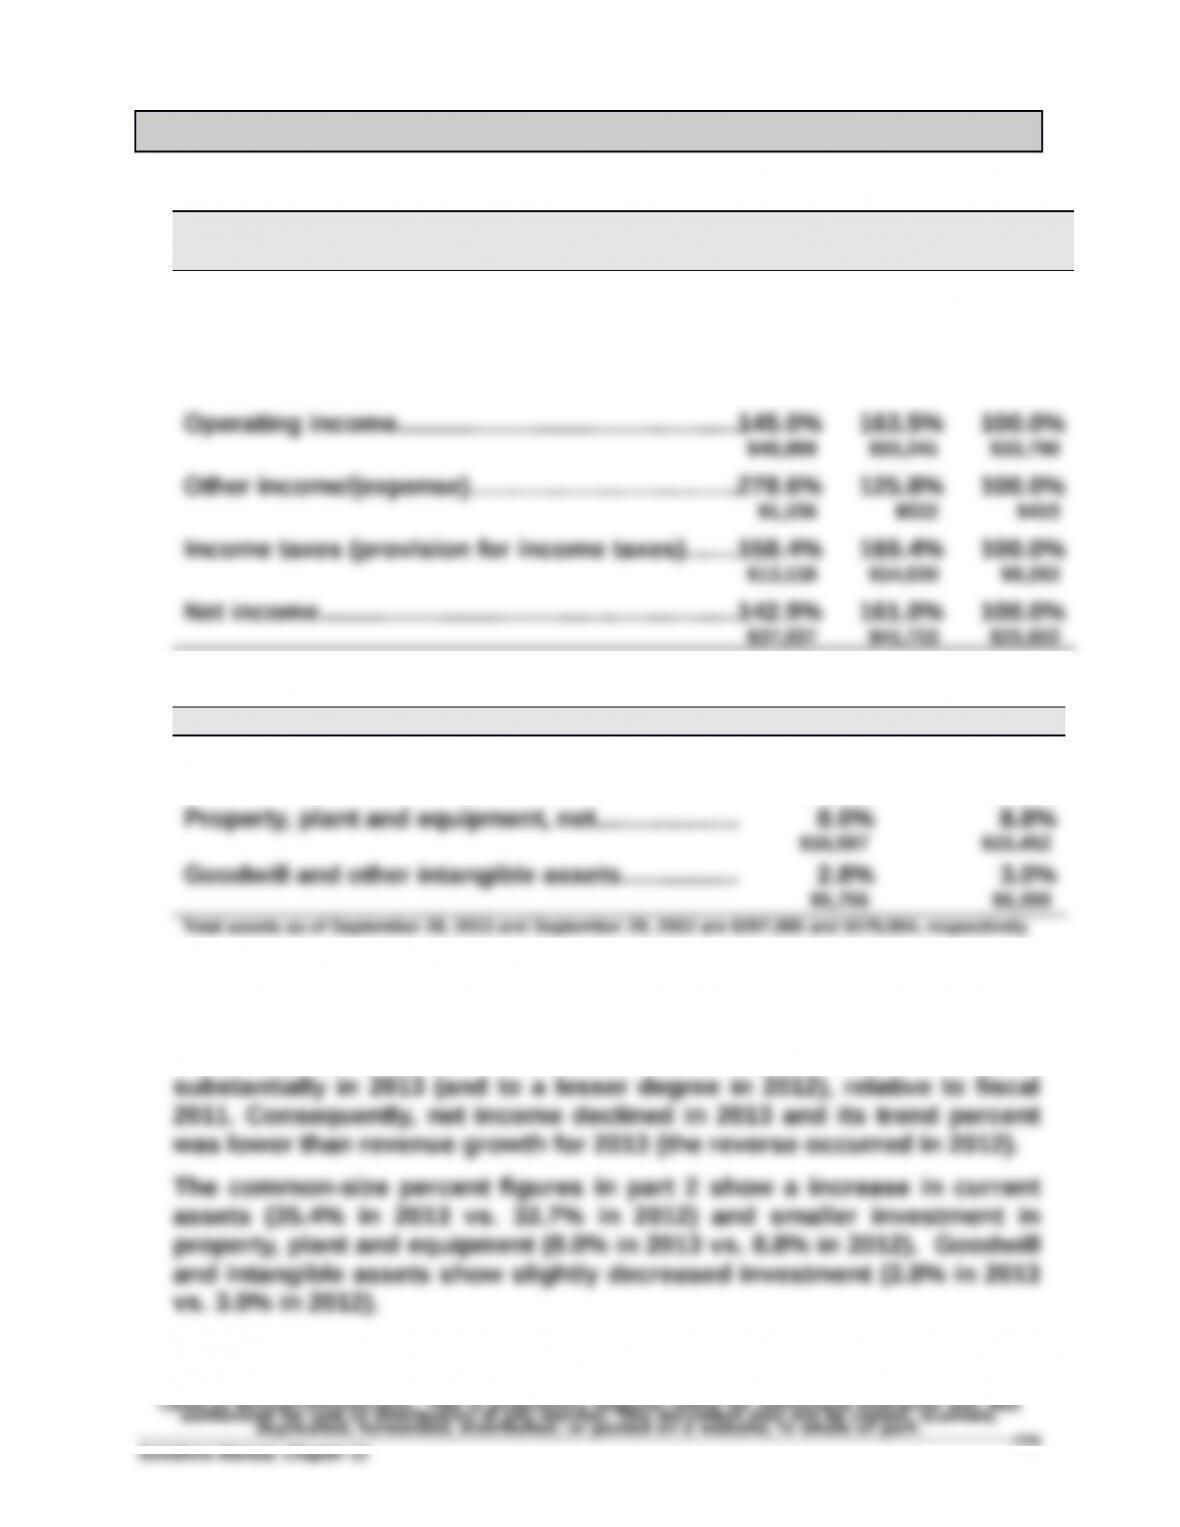
1. Trend percents for selected income statement accounts
($ in millions) Fiscal
2013
Fiscal
2012
Fiscal
2011
Net Sales………..………………………..……….….….…..157.9% 144.6% 100.0%
$170,910 $156,508 $108,249
Cost of sales………….……………………………..….…..165.5% 136.3% 100.0%
$106,606 $87,846 $64,431
2. Common-size percents for asset categories and accounts
($ in millions) Sep. 28, 2013 Sep. 29, 2012
Total current assets…………….….….…..…..….….… 35.4% 32.7%
$73,286 $57,653
3. For fiscal 2013, revenues grew at a lower rate than cost of sales,
however, for fiscal 2012, revenues grew at a higher rate than cost of
sales. Operating income grew at a higher rate than revenues for fiscal
2012; but the reverse occurred for 2013. Other income increased
4. Answers depend on the financial statement information obtained.
Comparative Analysis — BTN 13-2
1.
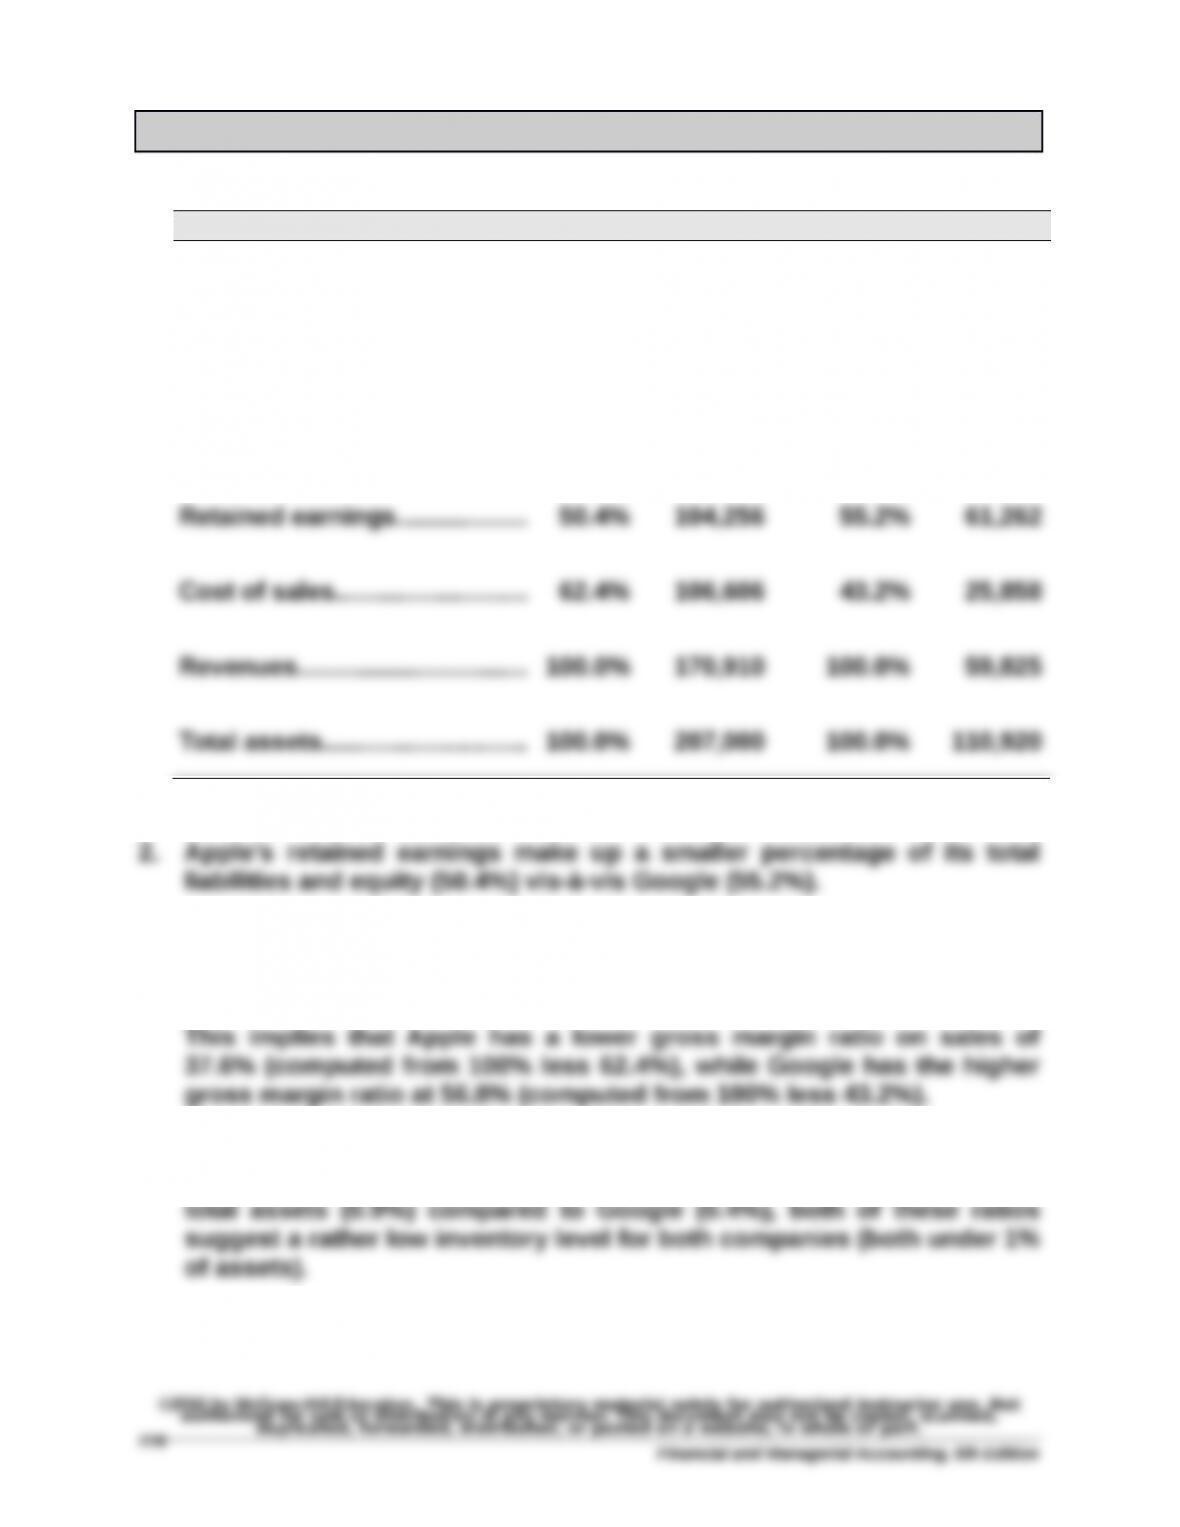
Key figures ($ millions) Apple Google
Cash and equivalents……….… 6.9% $14,259 17.0% $18,898
Accounts receivable, net....... 6.3% 13,102 8.0% 8,882
Inventories……………….………… 0.9% 1,764 0.4% 426
3. Apple’s cost of sales percent is higher at 62.4% compared to Google’s
at 43.2%.
4. Although Apple has almost twice as much inventory as a percent of
Financial and Managerial Accounting, 6th Edition
Ethics Challenge — BTN 13-3
1. The CEO appears to have selectively chosen from the 11 available
ratios to present only the ones that show trends that are favorable to
the company. (However, some analysts may not interpret a decline in
2. The consequences of this action by the CEO might be mixed. It is likely
that the analysts will ask other questions that may reveal some
negative trends such as the trends in return and profit margins. The
CEO’s actions may become transparent to the analysts as they
Communicating in Practice — BTN 13-4
There is no set solution to this activity. Each team’s memorandum will vary
based on the industry and companies chosen for analysis. (Instructor:
Taking It to the Net — BTN 13-5
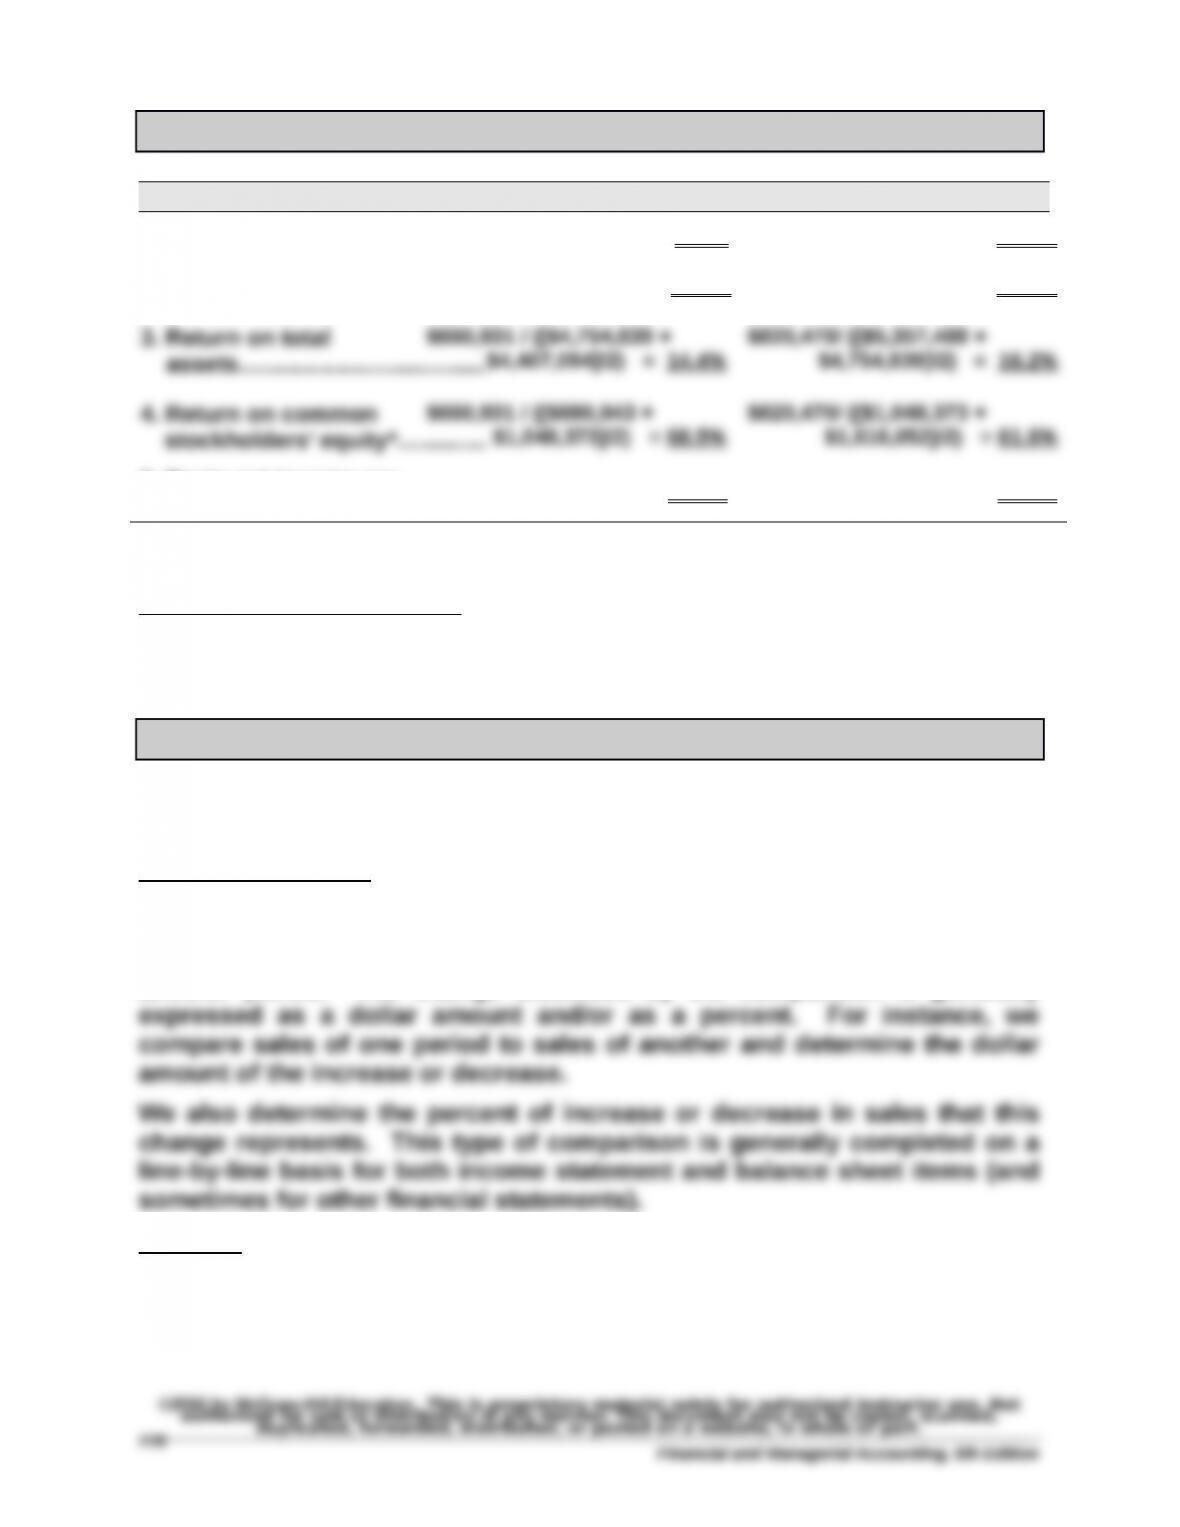
($ thousands) As of 12/31/2012 As of 12/31/2013
1. Profit margin ratio……………..
$660,931/$6,644,252 = 9.9% $820,470/$7,146,079= 11.5%
2. Gross profit ratio……………….
$2,859,882/ $6,644,252 = 43.0% $3,280,848/$7,146,079 = 45.9%
5. Basic net income per
common share**..…………….. $ 3.01 $ 3.76
*An acceptable alternative solution would be to include minority interest in equity.
**Taken from consolidated statement of income.
Analysis and Interpretation: Hershey’s performance generally improved in
all areas evaluated for the profitability metrics reported in the table above
with the exception of return on common equity.
Teamwork in Action — BTN 13-6
Part 1
Team reports should look something like the following:
Horizontal Analysis
Horizontal analysis is comparing a company’s financial statement amounts
across time. We compare data from comparative statements that are
horizontally aligned; that is, we compare the same items from one period to
another period. The change disclosed by the comparison is generally
Example: Assume that prior year sales equal $240,000, and current year
sales equal $300,000. Horizontal analysis of sales yields a $60,000 increase
or a 25% increase in sales. (Computation is defined as:
Amount of change / Base year [or $60,000/$240,000].)
Financial and Managerial Accounting, 6th Edition
Teamwork in Action (Concluded)
If a horizontal comparison is made over a number of periods, the
comparisons are made to corresponding amounts in a selected period
Vertical Analysis
Vertical analysis is comparing a company’s financial statement amounts to
a base amount. Usually this base amount is a total or aggregate amount.
Example: Total assets for the period being analyzed = $500,000 (base
Part 2
Explanations of the four categories or areas of ratio analysis follow:
a. Liquidity analysis measures the availability of resources to meet short-
term cash requirements. Efficiency analysis measures how productive a
company is in using its assets.
c. Profitability analysis measures a company’s ability to generate an
adequate return on invested capital.
Note: Students will select various ratios to illustrate these categories. Use
Exhibit 13.16 to verify the category, measurement, and use of each ratio.
Part 3
Each team member presents results to the entire team.
Entrepreneurial Decision — BTN 13-7
1. No. Although the current ratio improved over the three-year period, the
acid-test ratio declined and accounts receivable and merchandise
2. No. The decreasing turnover of accounts receivable indicates the
3. No. Sales are increasing and accounts receivable are turning more
4. Yes. To illustrate, if sales are assumed to equal $100 in 2013, the sales
trend shows that they would equal $125 in 2014 and $137 in 2015. Then,
$39.14 in 2015 ($137/ 3.5).
5. No. The percent of return on equity declines from 12.25% in 2013 to
9.75% in 2015.
6. The dollar amount of selling expenses increased in 2014 and decreased
Hitting the Road — BTN 13-8
One possible strategy to fulfill the requirements of this assignment is:
Assume that a $37,500 salary will be earned upon graduation at age 25.
Also, assume that the level of investment will be at 8% of your salary (or
Financial and Managerial Accounting, 6th Edition
Global Decision — BTN 13-9
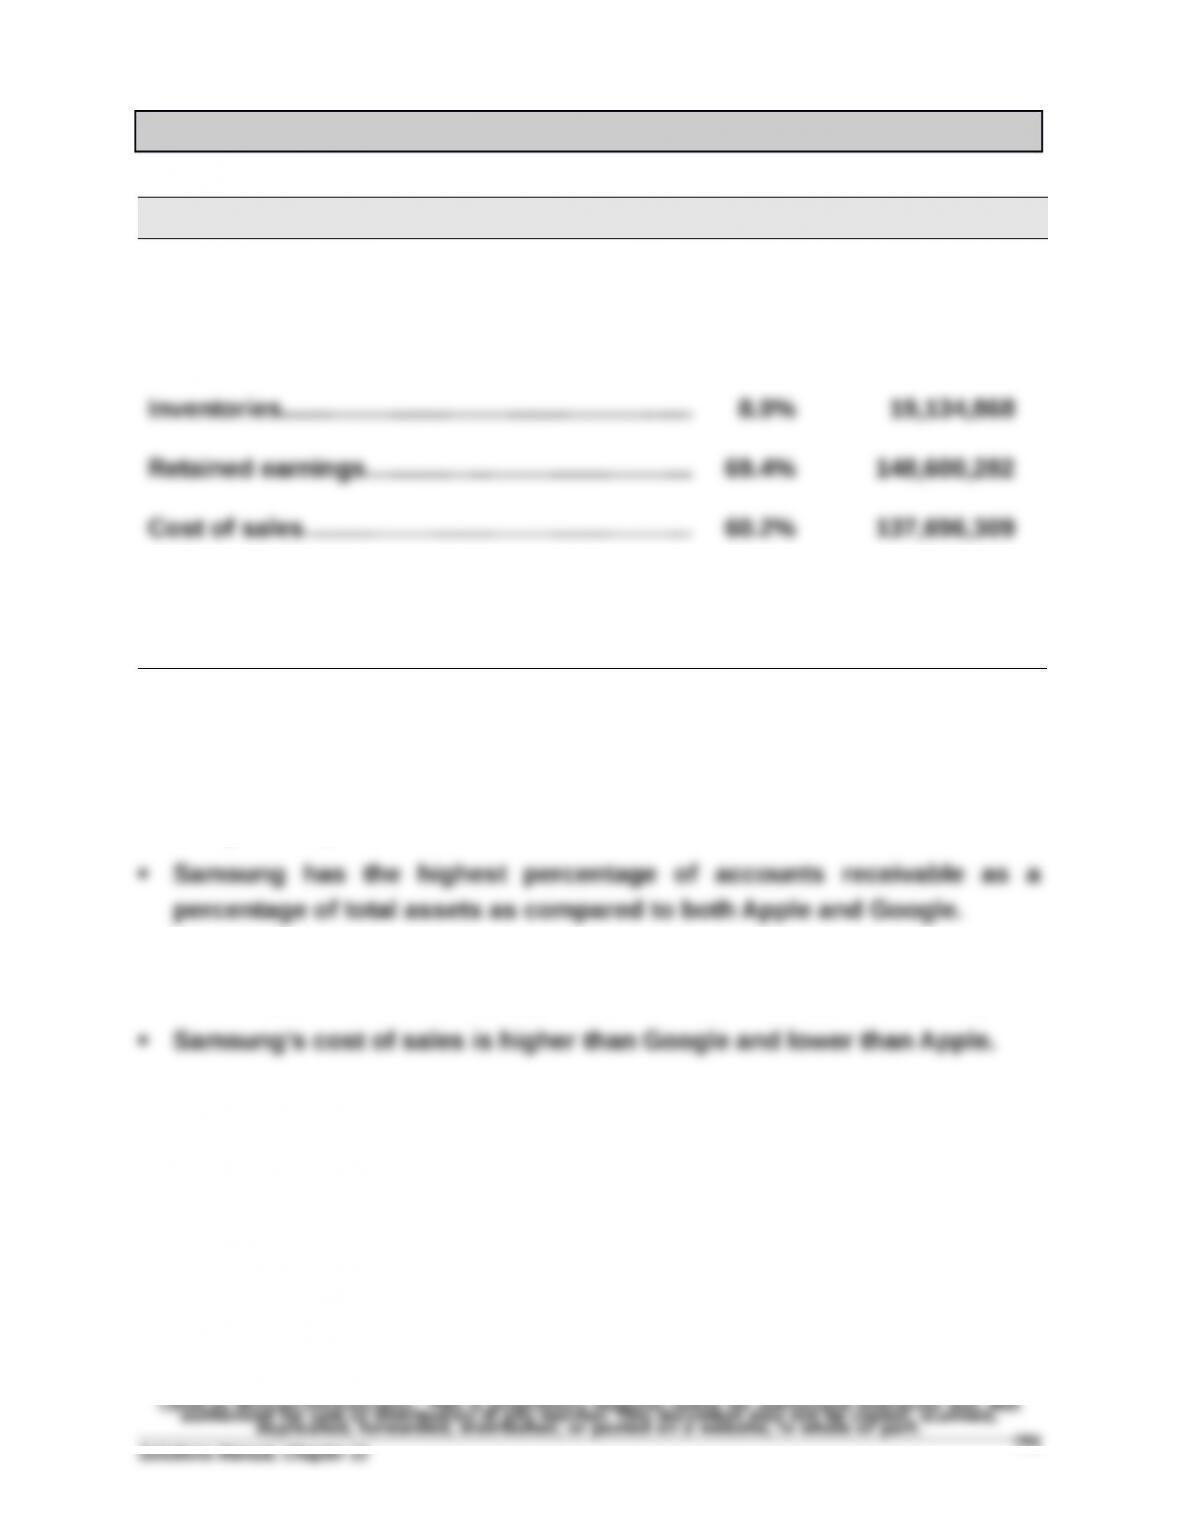
Key figures (KRW in millions) Samsung
Cash and equivalents……………….……….…..….… 7.6% 16,284,780 ₩
Accounts receivable, net….…..….….….…..….….. 13.0% 27,875,934
Revenues………………….……………………….….….... 100.0% 228,692,667
Total assets…………….………..….…..…..….….…..… 100.0% 214,075,018
Comparisons and comments:
Samsung’s cash and equivalents is greater than Apple and less than
Google as a percent of assets.
Samsung’s retained earnings make up a larger percentage of its total
financing (liabilities and equity) compared to that of Apple and Google.