Problem 13-2A (Concluded)
Part 3
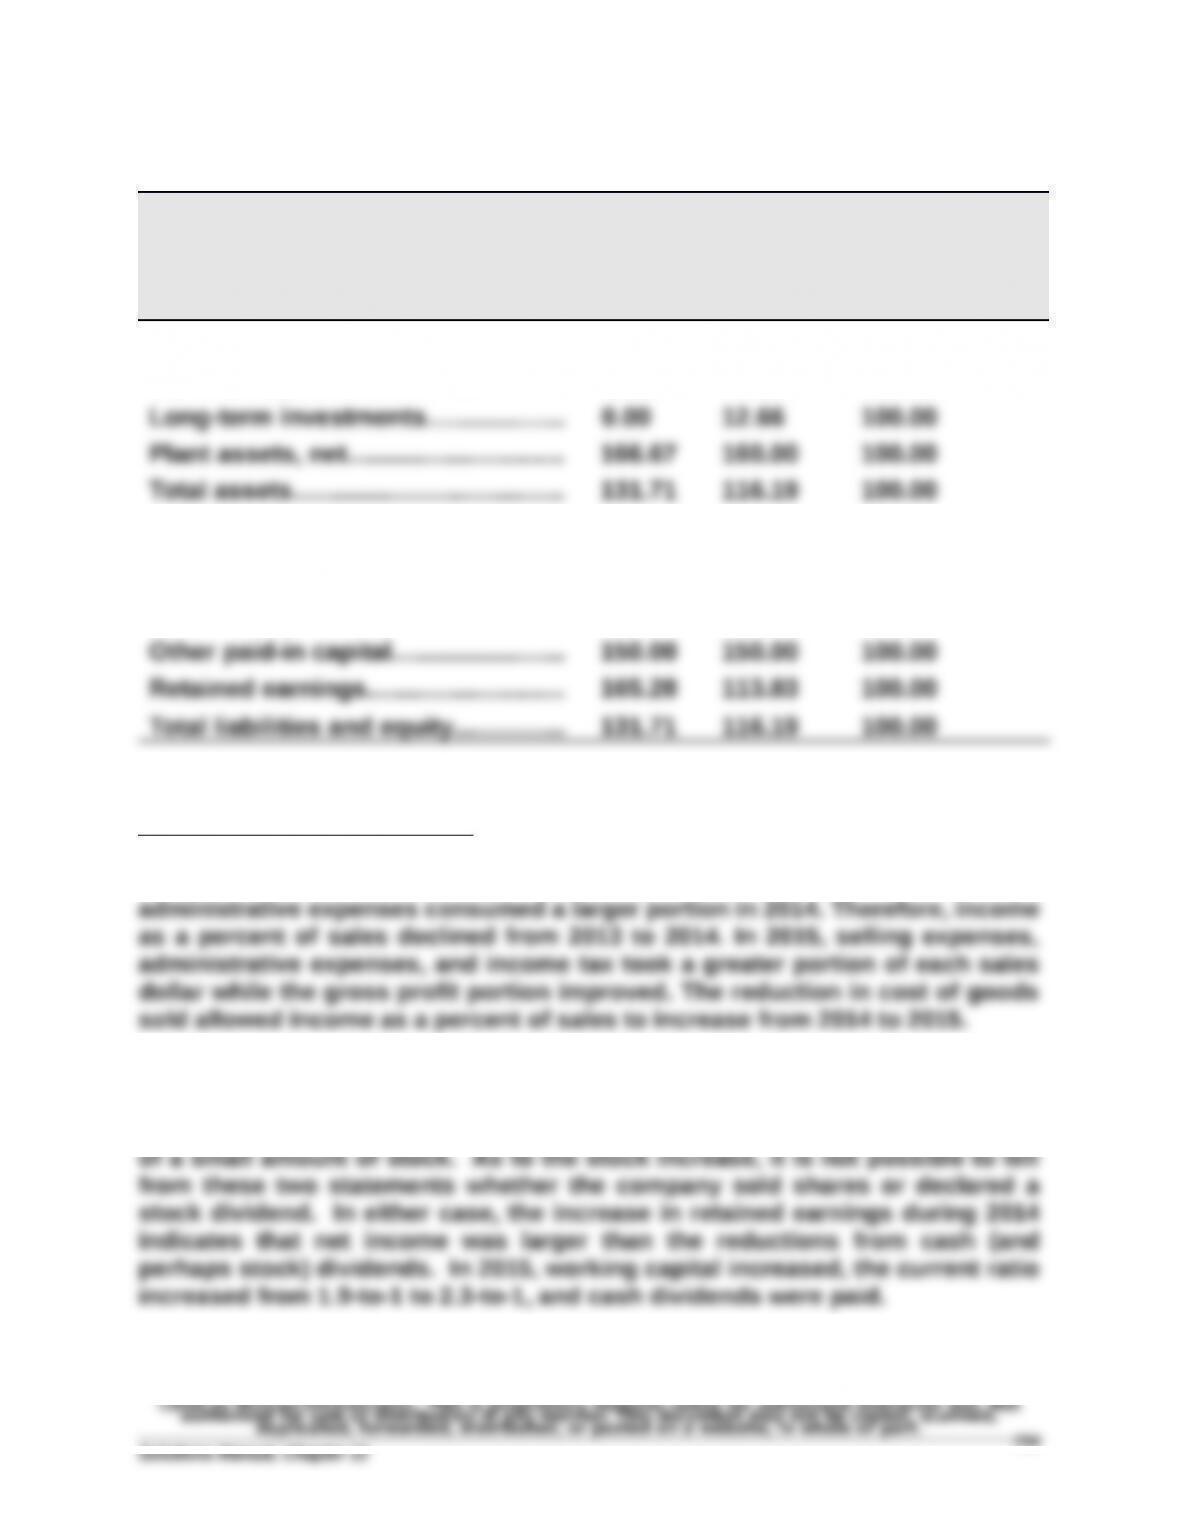
KORBIN COMPANY
Balance Sheet Data in Trend Percents
December 31, 2015, 2014, and 2013
2015 2014 2013
Assets
Current assets………….….……….……. 101.24% 73.29% 100.00%
Liabilities and Equity
Current liabilities……………..….……… 112.32% 98.33% 100.00%
Common stock…………………………… 120.00 120.00 100.00
Part 4
Significant relations revealed
Korbin’s selling expenses and income taxes consumed smaller portions of
each sales dollar in 2014 than 2013. However, cost of goods sold and
Korbin expanded its plant assets in 2014, financing the expansion through the
sale of long-term investments, through a reduction in working capital (the
current ratio decreased from 2.5-to-1 to 1.9-to-1), and perhaps through the sale
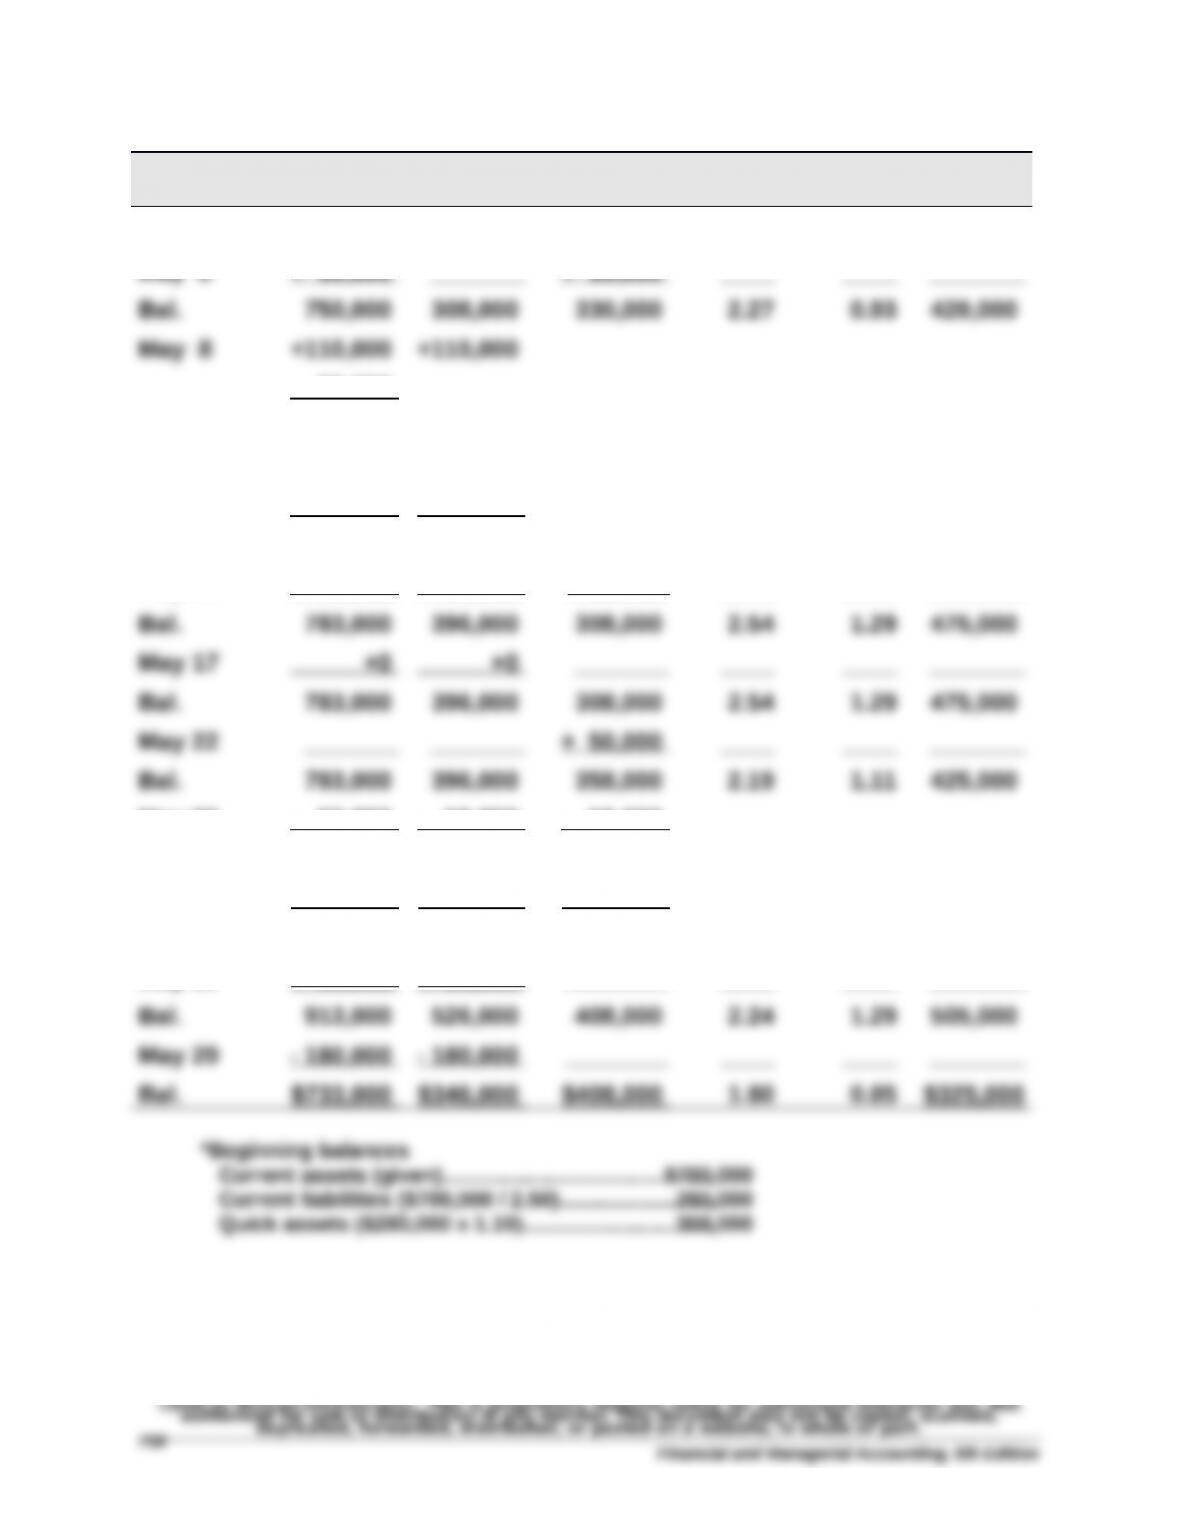
Problem 13-3A (60 minutes)
Transaction Current
Assets
Quick
Assets
Current
Liabilities
Current
Ratio
Acid-Test
Ratio
Working
Capital
Beginning* $700,000 $308,000 $280,000 2.50 1.10 $420,000
May 2 + 50,000 _______ + 50,000 ____ ____ _______
– 55,000 _______ _______ ____ ____ _______
Bal. 805,000 418,000 330,000 2.44 1.27 475,000
May 10 + 20,000 + 20,000
– 20,000 – 20,000 _______ ____ ____ _______
Bal. 805,000 418,000 330,000 2.44 1.27 475,000
May 15 – 22,000 – 22,000 – 22,000 ____ ____ _______
May 26 – 50,000 – 50,000 – 50,000 ____ ____ _______
Bal. 733,000 346,000 308,000 2.38 1.12 425,000
May 27 +100,000 +100,000 +100,000 ____ ____ _______
Bal. 833,000 446,000 408,000 2.04 1.09 425,000
May 28 + 80,000 + 80,000 ________ ____ ____ _______
Financial and Managerial Accounting, 6th Edition
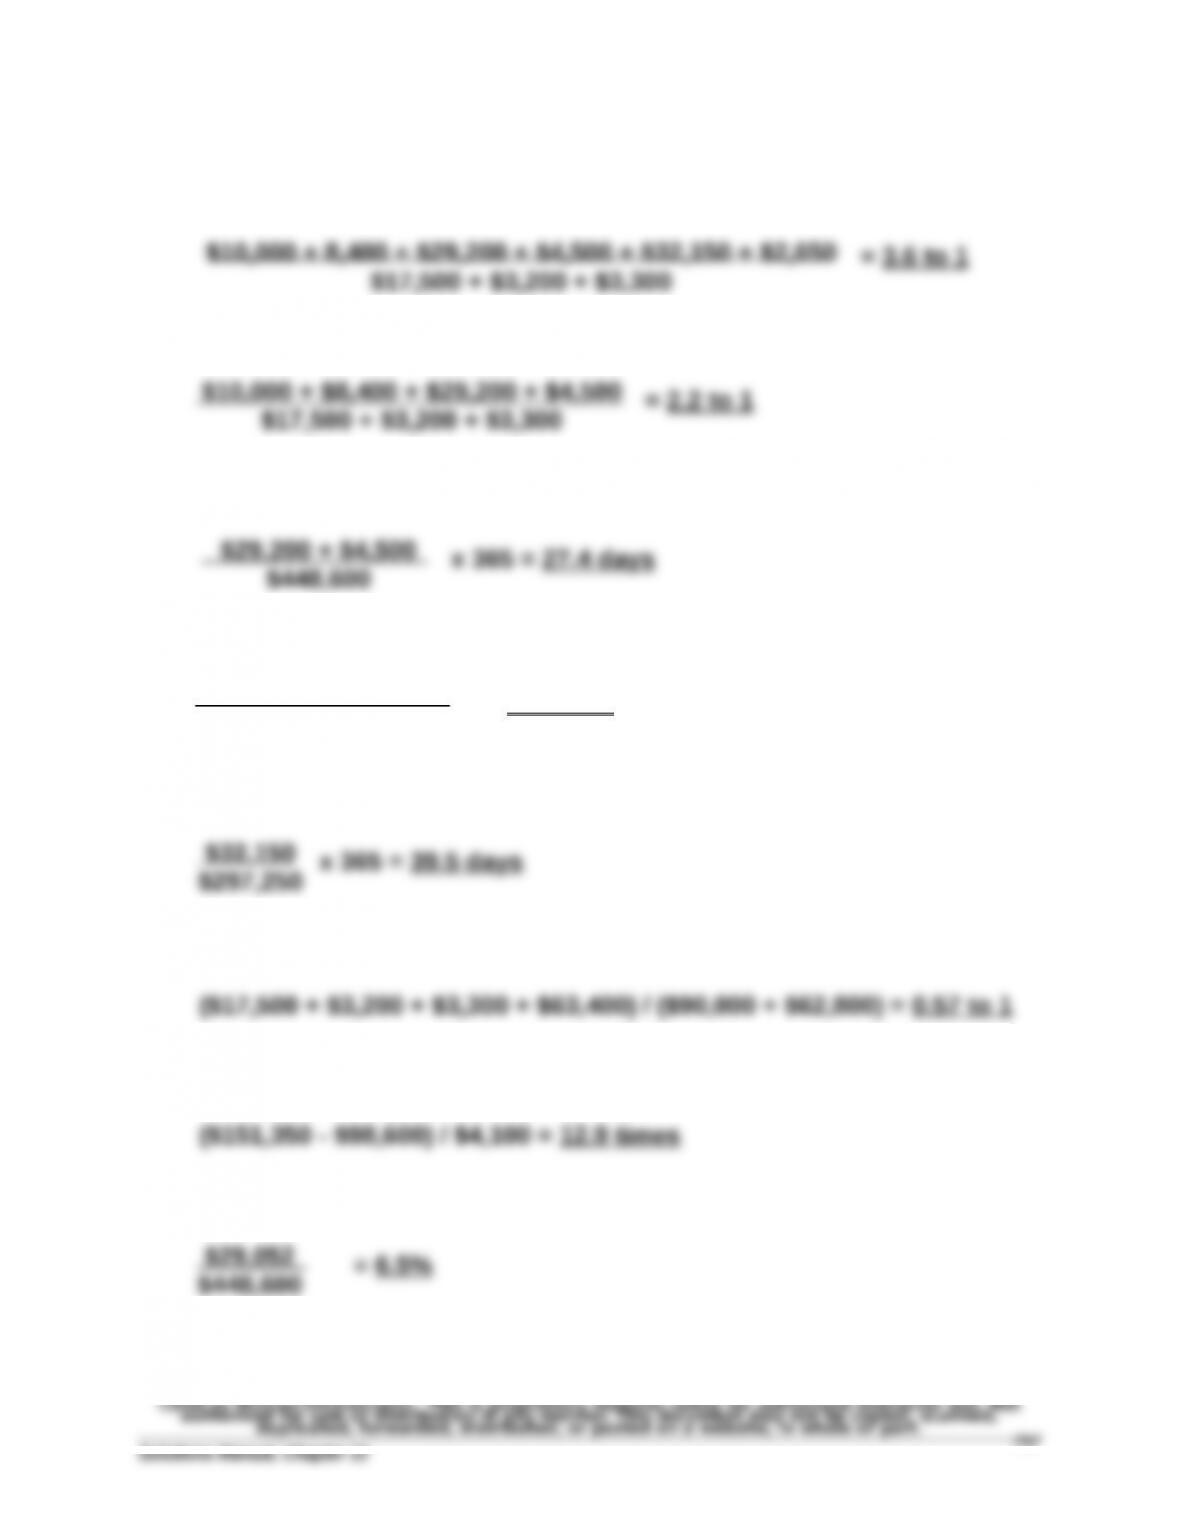
Problem 13-4A (50 minutes)
1. Current ratio
2. Acid-test ratio
3. Days’ sales uncollected
4. Inventory turnover
= 7.3 times
5. Days’ sales in inventory
©2016 by McGraw-Hill Education. This is proprietary material solely for authorized instructor use. Not
authorized for sale or distribution in any manner. This document may not be copied, scanned,
duplicated, forwarded, distributed, or posted on a website, in whole or part.
Solutions Manual, Chapter 13
$17,500 + $3,200 + $3,300
$10,000 + $8,400 + $29,200 + $4,500
$17,500 + $3,200 + $3,300
$29,200 + $4,500
$448,600
$297,250
($48,900 + $32,150)/2
757
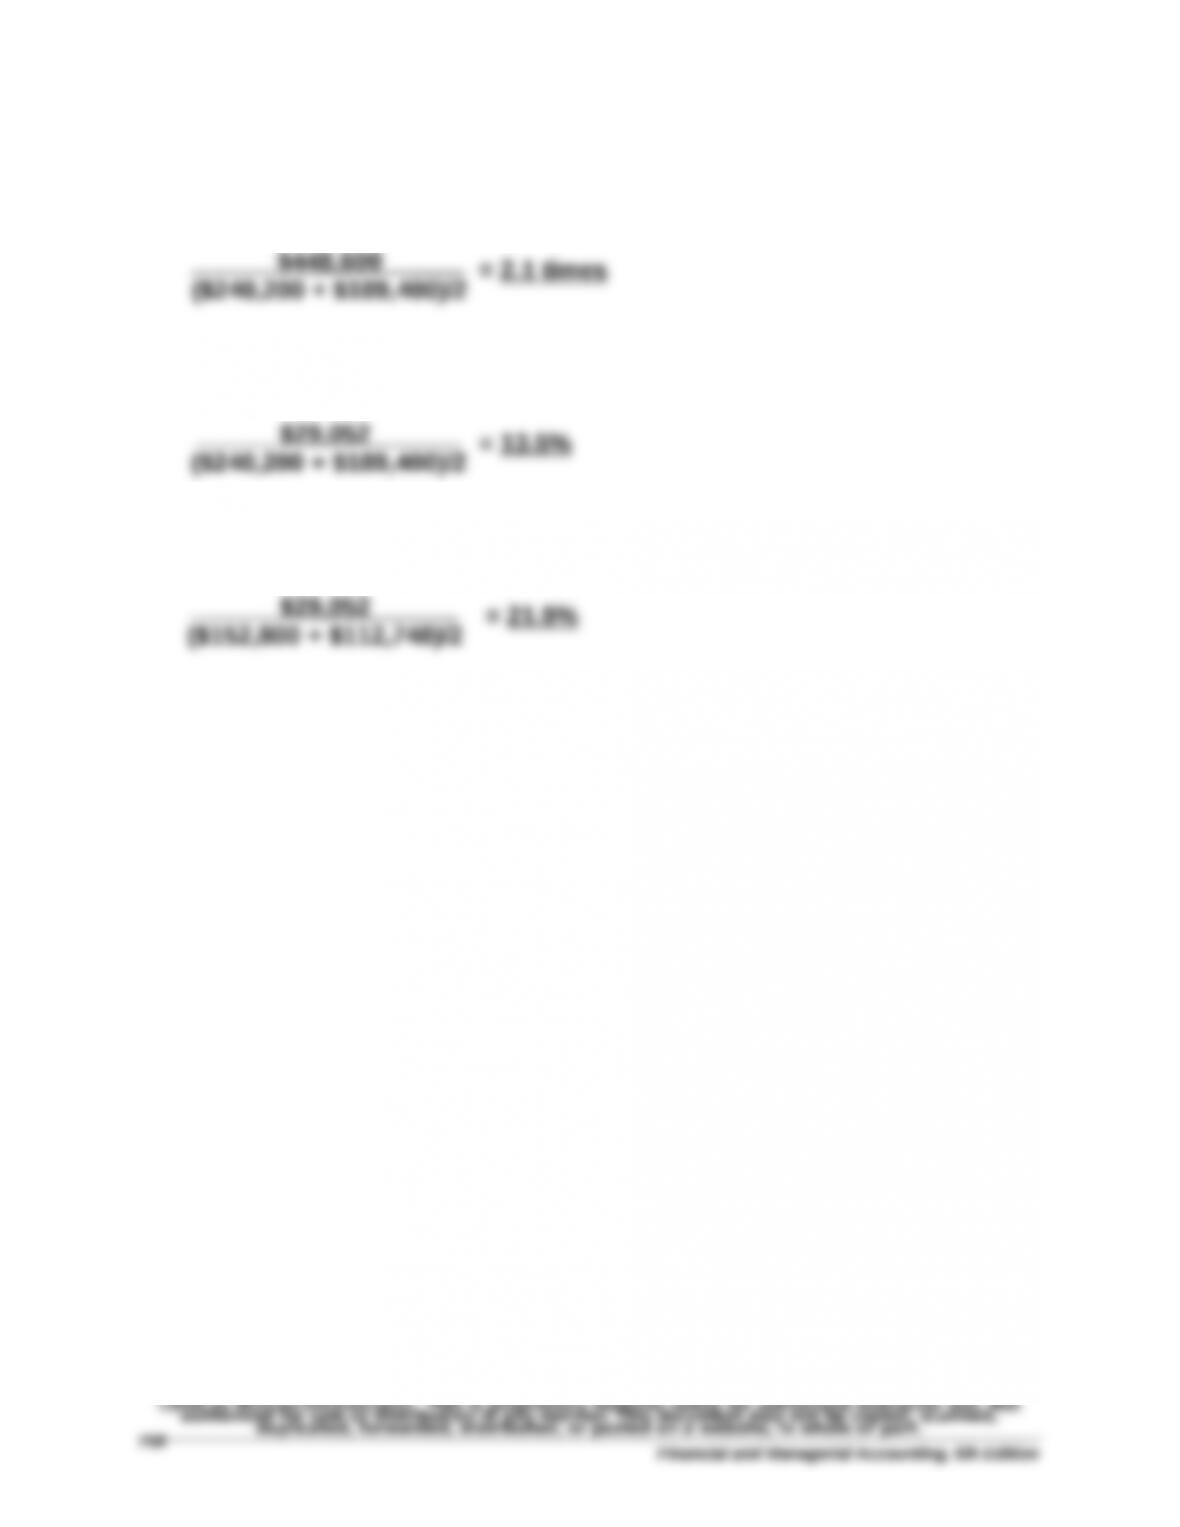
Problem 13-4A (Concluded)
9. Total asset turnover
10. Return on total assets
11. Return on common stockholders’ equity
Financial and Managerial Accounting, 6th Edition
$448,600
($240,200 + $189,400)/2
$29,052
($240,200 + $189,400)/2
$29,052
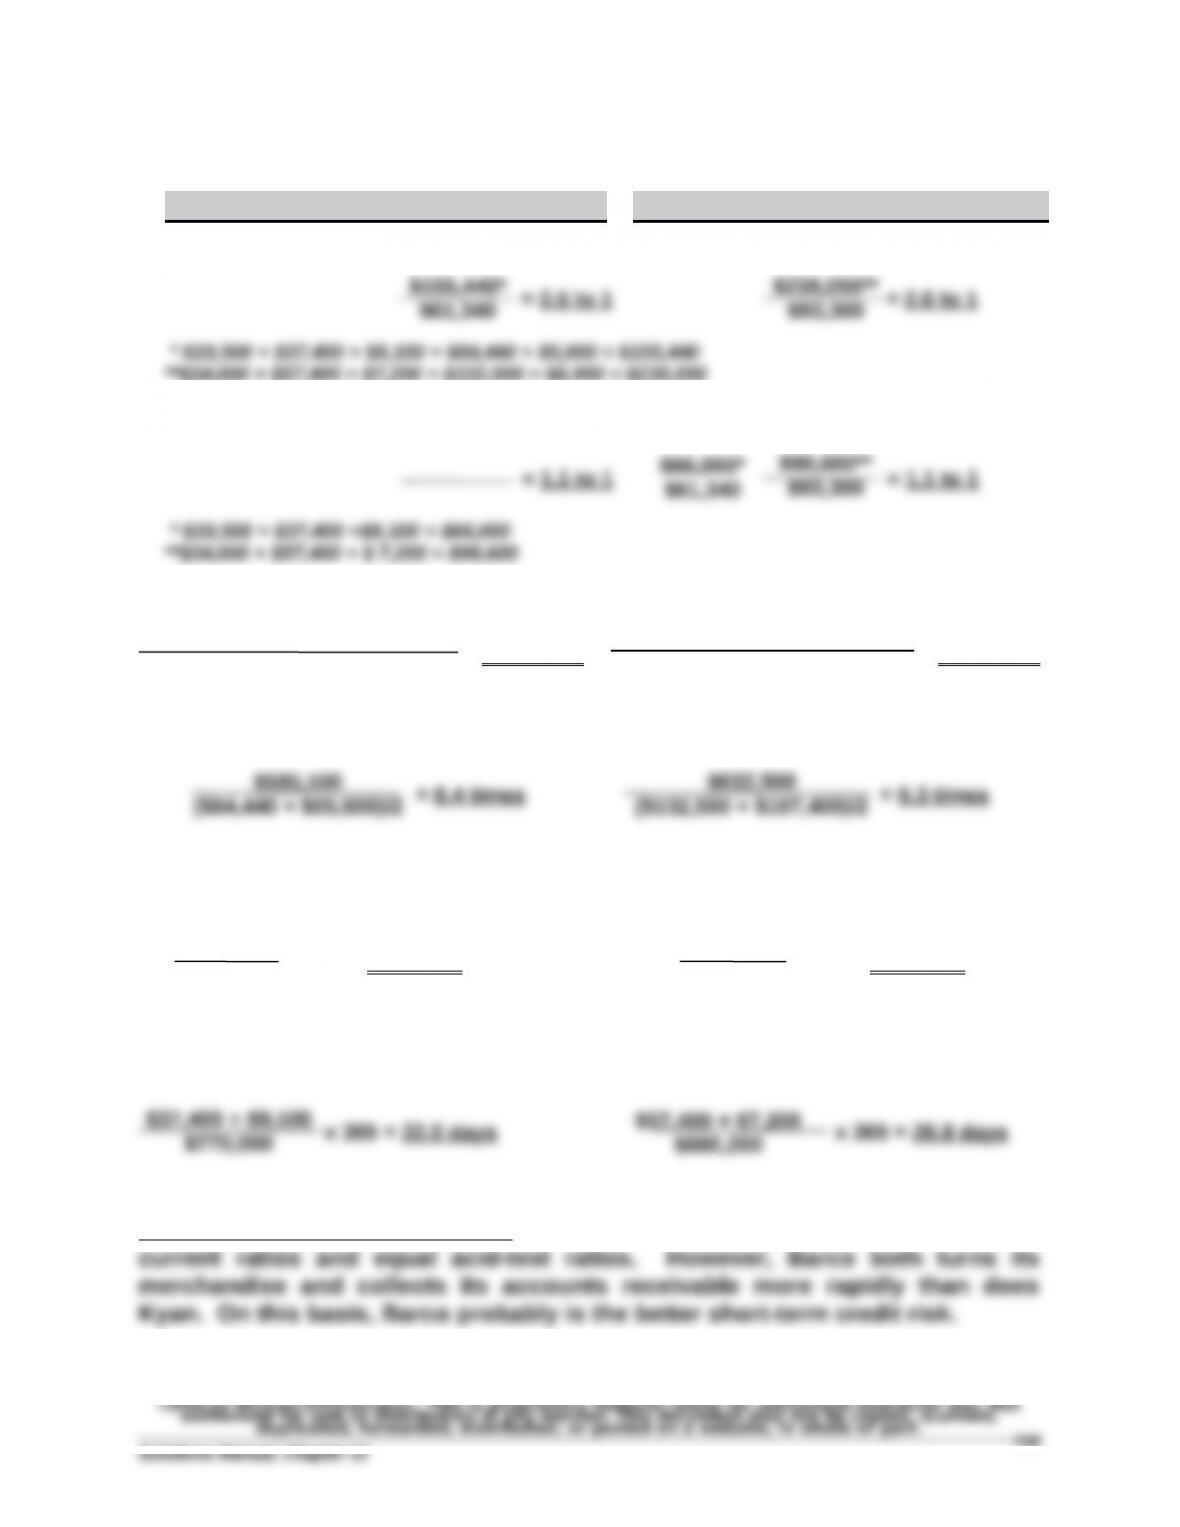
Problem 13-5A (60 minutes)
Part 1
Barco Company Kyan Company
a. Current ratio
**$34,000 + $57,400 + $7,200 + $132,500 + $6,950 = $238,050
b. Acid-test ratio
c. Accounts receivable turnover
= 20.2 times = 14.8 times
d. Inventory turnover
e. Days’ sales in inventory
x 365 = 52.7 days x 365 = 76.5 days
f. Days’ sales uncollected
Short-term credit risk analysis: Barco and Kyan have essentially equal
current ratios and equal acid-test ratios. However, Barco both turns its
merchandise and collects its accounts receivable more rapidly than does
Kyan. On this basis, Barco probably is the better short-term credit risk.
©2016 by McGraw-Hill Education. This is proprietary material solely for authorized instructor use. Not
authorized for sale or distribution in any manner. This document may not be copied, scanned,
duplicated, forwarded, distributed, or posted on a website, in whole or part.
Solutions Manual, Chapter 13
$238,050**
$155,440*
$98,600**
$66,000*
$880,200
($57,400 + $7,200 + $54,200)/2
$770,000
($37,400 + $9,100 + $29,800)/2
$132,500
$632,500
$84,440
$585,100
759
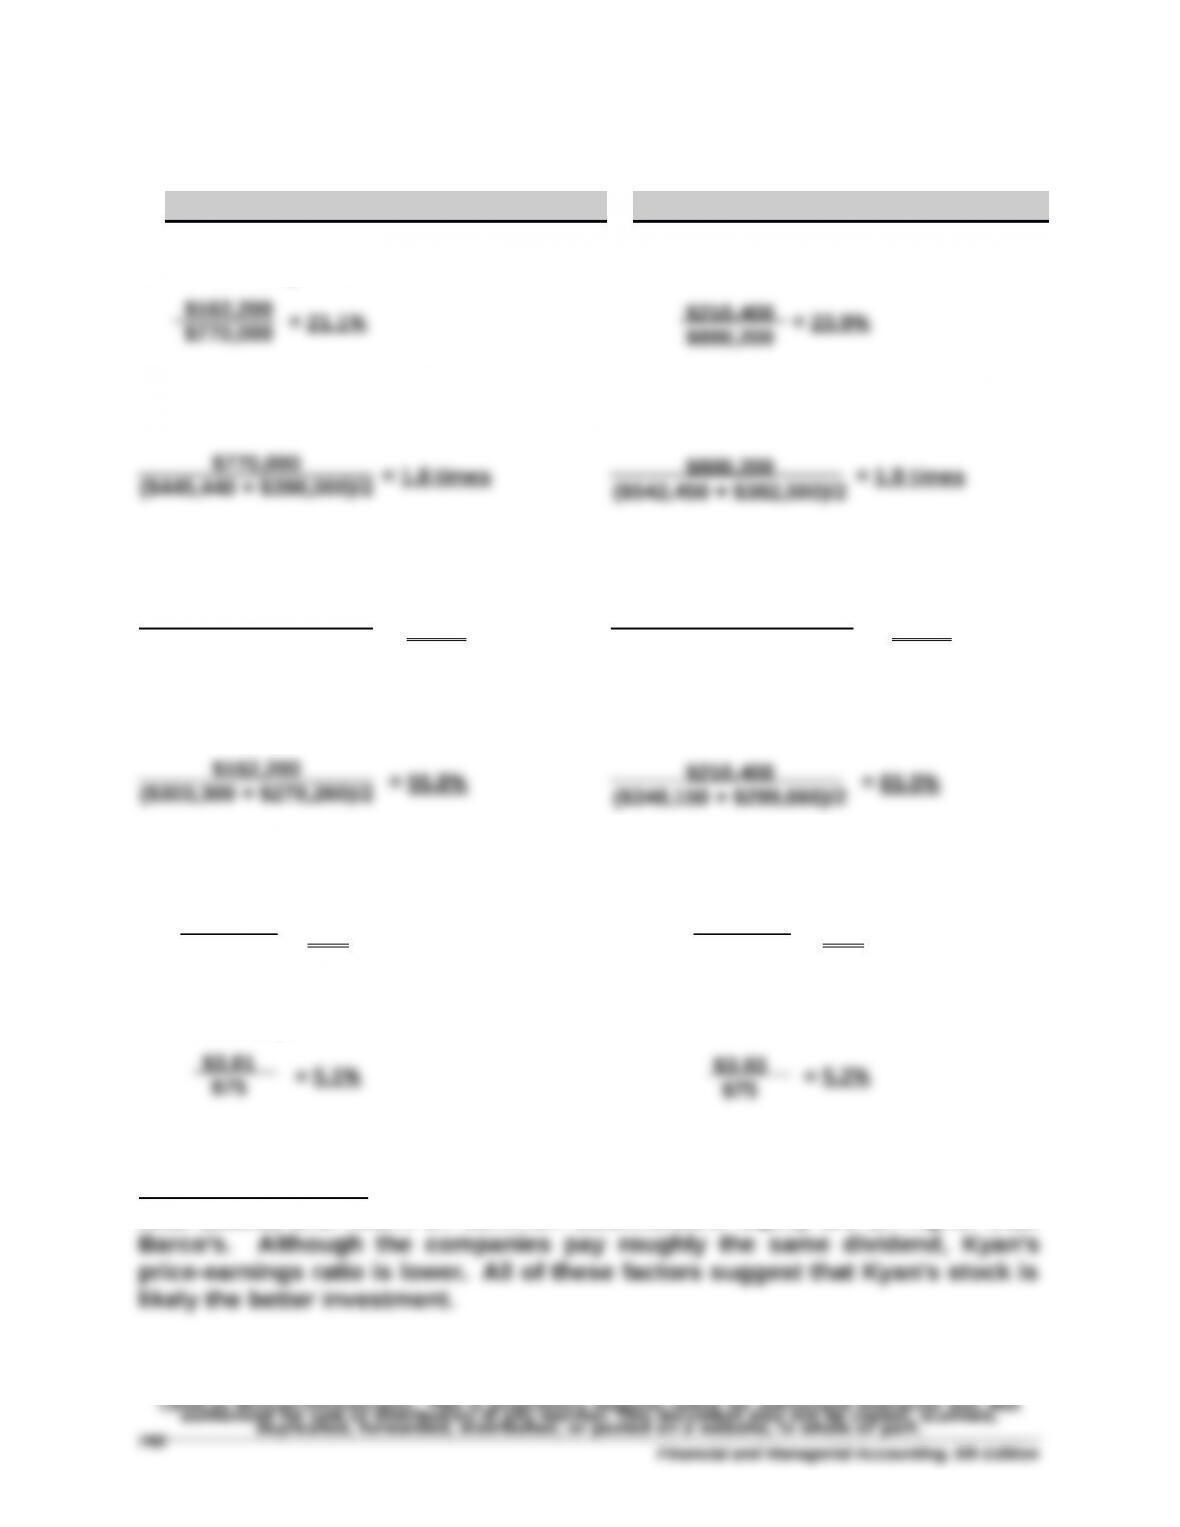
Problem 13-5A (Concluded)
Part 2
Barco Company Kyan Company
a. Profit margin ratio
b. Total asset turnover
c. Return on total assets
= 38.5% = 45.5%
d. Return on common stockholders’ equity
e. Price-earnings ratio
= 16.6 = 14.7
f. Dividend yield
Financial and Managerial Accounting, 6th Edition
$210,400
$880,200
$162,200
$770,000
$880,200
($542,450 + $382,500)/2
$770,000
($445,440 + $398,000)/2
$210,400
($542,450 + $382,500)/2
$162,200
($445,440 + $398,000)/2
$75
$4.51
$75
$5.11
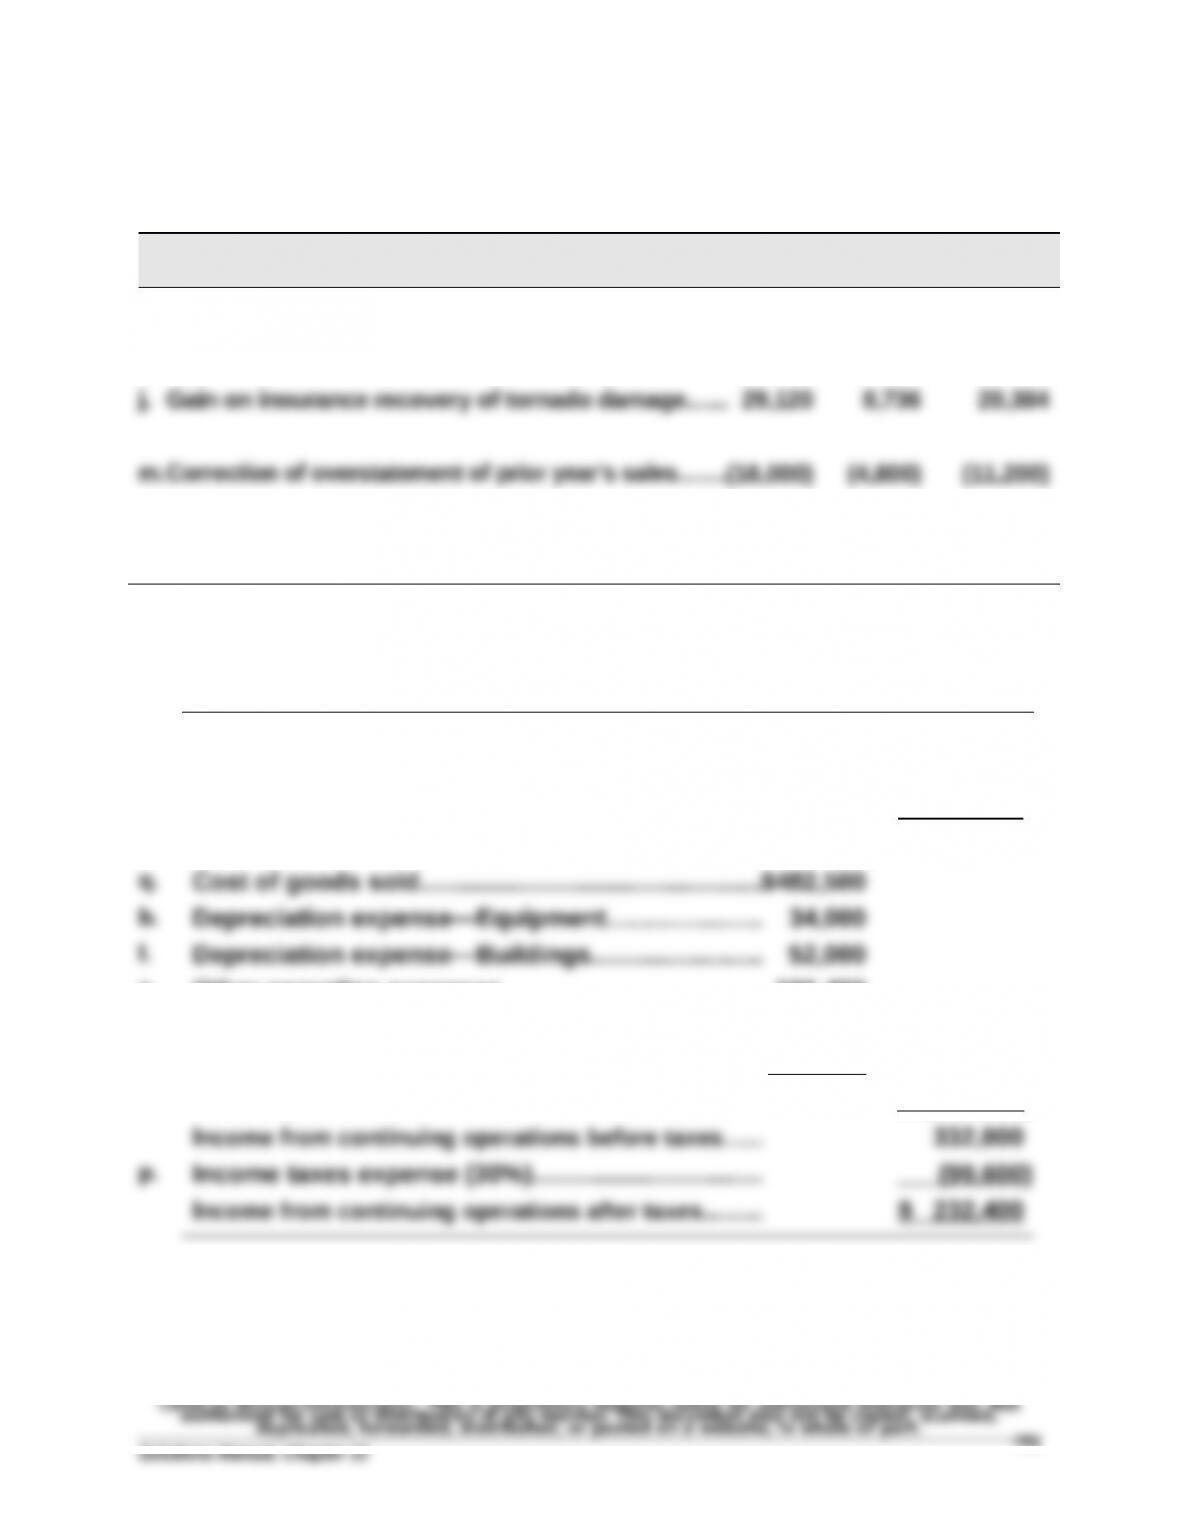
Problem 13-6AA (60 minutes)
Part 1
Effect of income taxes (debits or losses in parentheses)
Pretax
30% Tax
Effect After–Tax
i. Loss from operating a discontinued segment…..........(18,250) (5,475) (12,775)
n. Gain on sale of discontinued segment’s assets..........
34,000 10,200 23,800
Part 2 Income from continuing operations (and its components)
k. Net sales…………….…………………..………………….….. $ 998,500
a. Interest revenue………………….…………….………….… 14,000
g. Gain from settling lawsuit………..…………….……….. 44,000
Total revenues and gains…………………….………….. 1,056,500
e. Other operating expenses……………..…….….……… 106,400
c. Loss on sale of equipment…………………….….……. 25,850
o. Loss from settling lawsuit…………….…….….…….… 23,750
Total expenses……………………..………………………… (724,500)
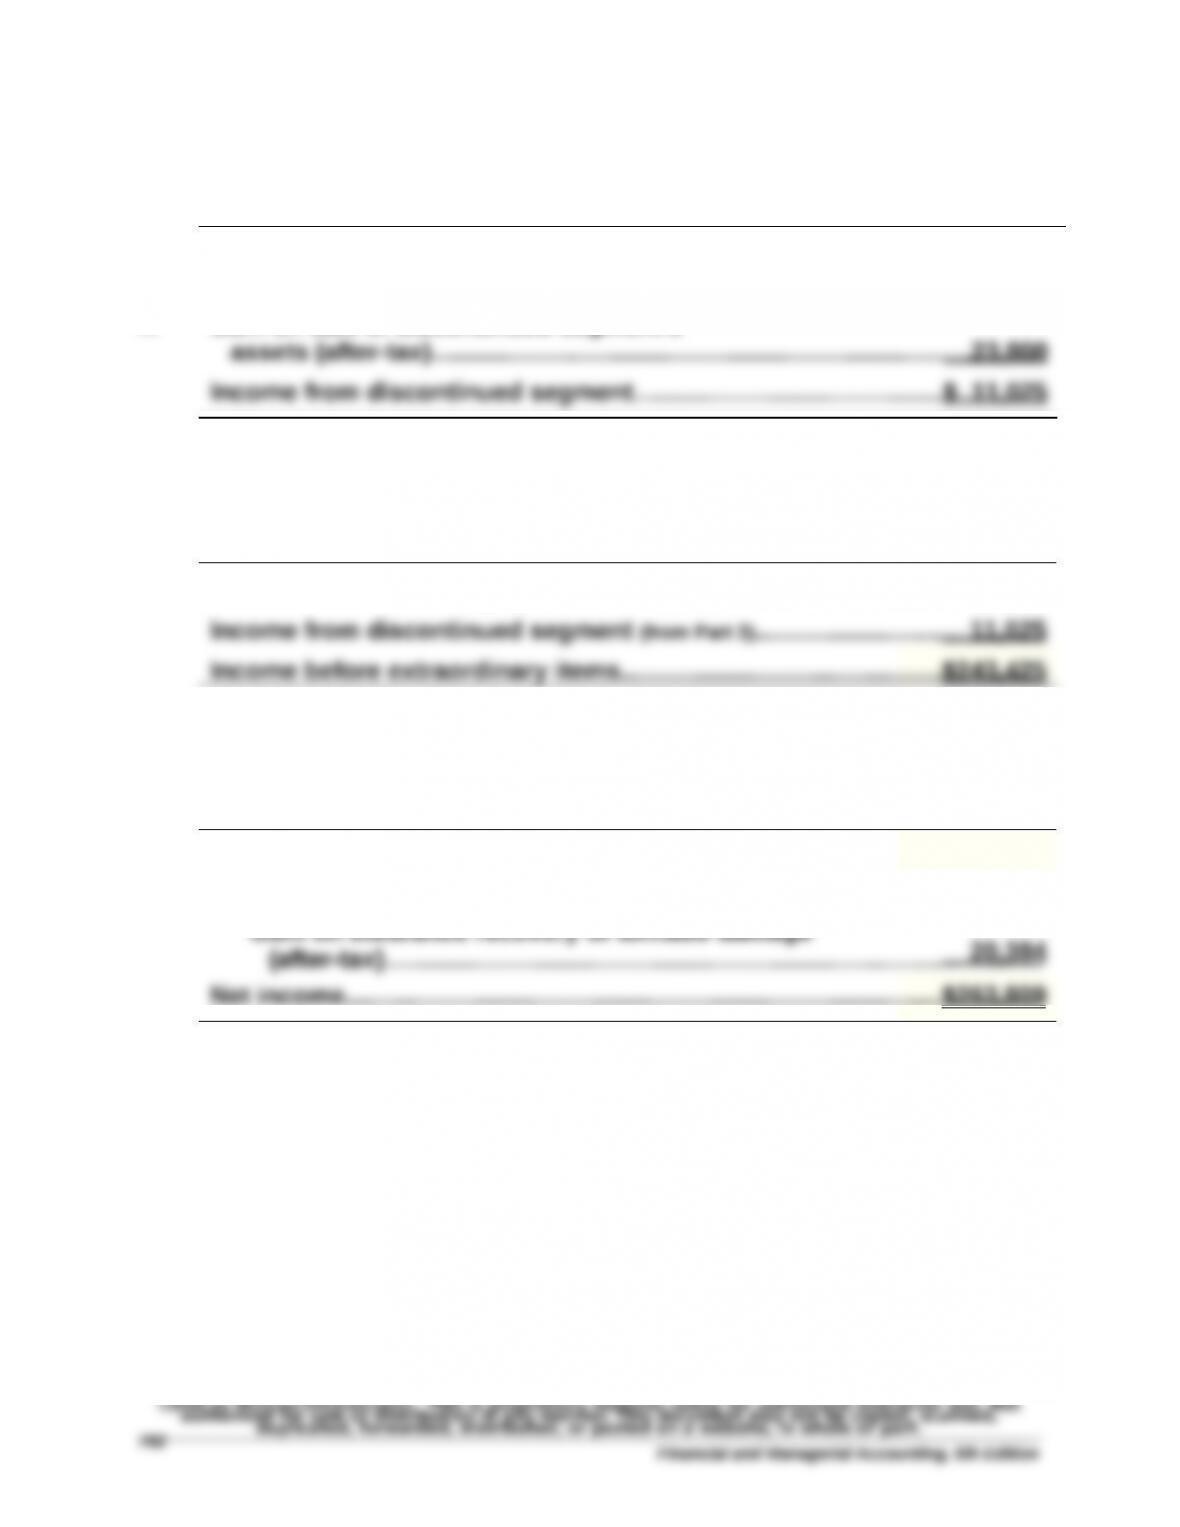
Problem 13-6AA (Concluded)
Part 3 Income from discontinued segment
i. Loss from operating a discontinued
segment (after-tax)…………………………………………………..……….….………..$ (12,775)
n. Gain on sale of discontinued segment’s
Part 4 Income before extraordinary items
Income from continuing oper. after taxes (from Part 2)..…………………………$232,400
Part 5 Net income
Income before extraordinary items……………………………….……….……….…$243,425
j. Extraordinary item
Financial and Managerial Accounting, 6th Edition
PROBLEM SET B
Problem 13-1B (120 minutes)
Part 1
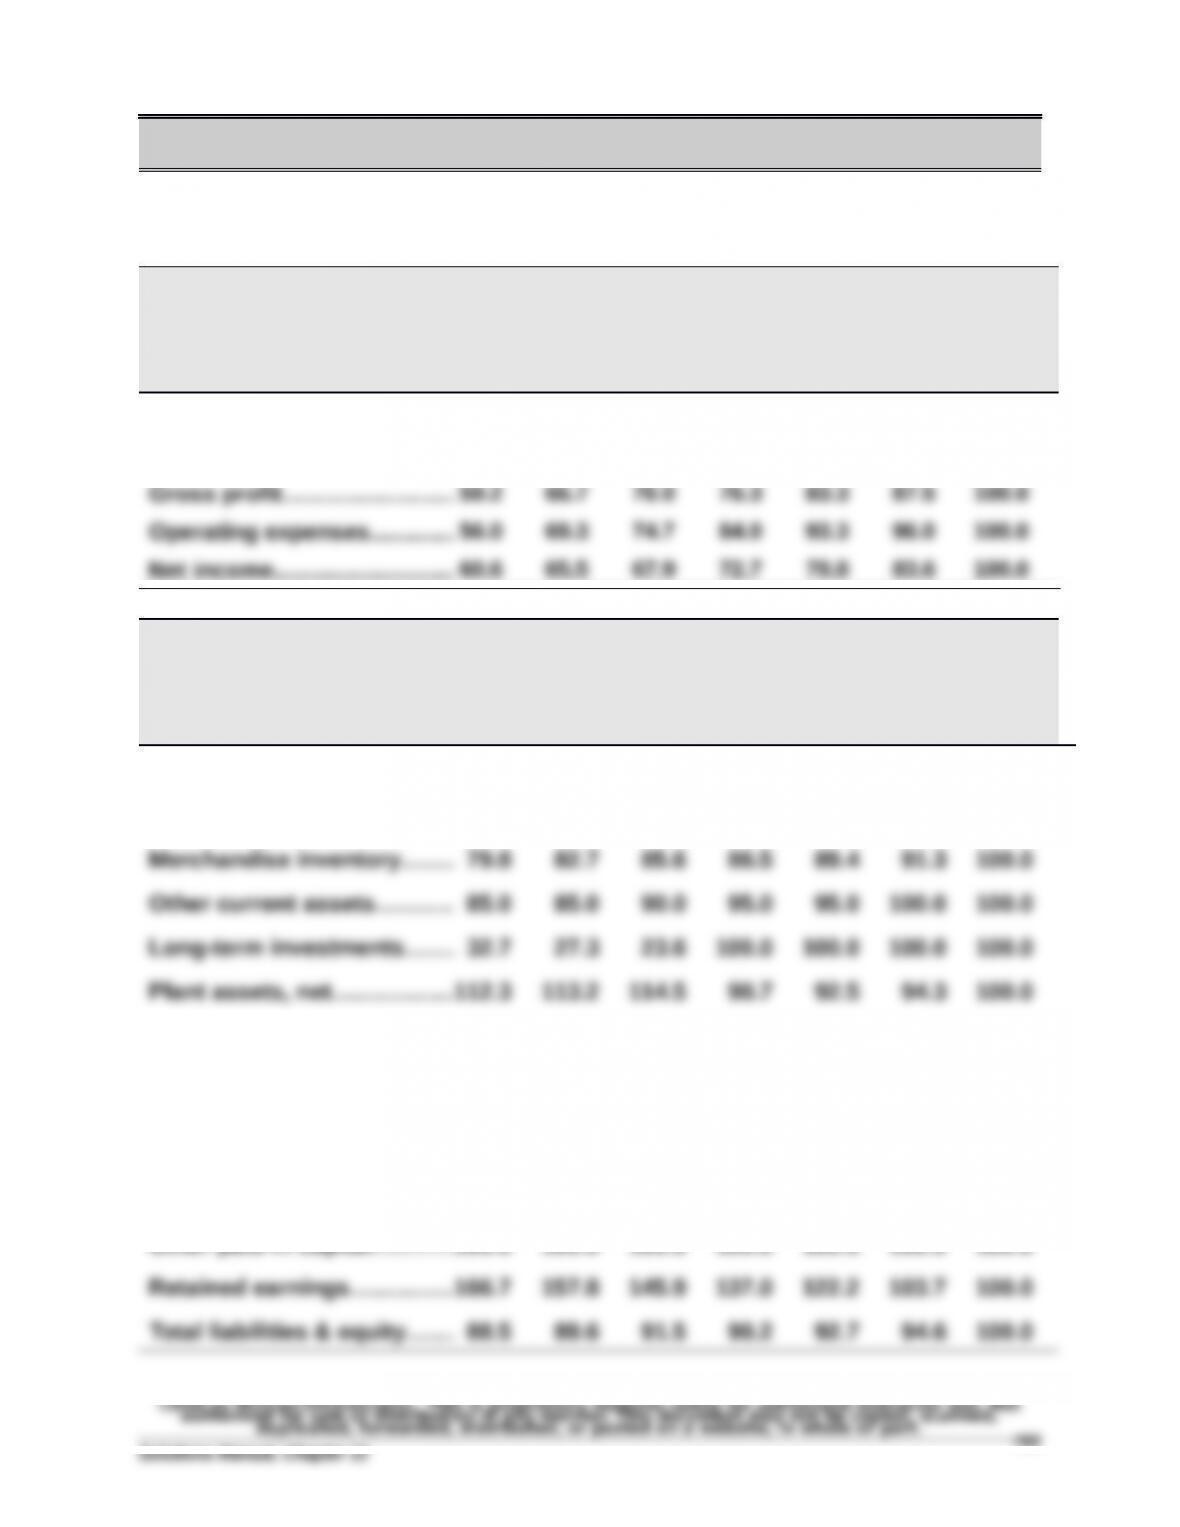
TRIPOLY COMPANY
Income Statement Trends
For Years Ended December 31, 2015-2009
2015 2014 2013 2012 2011 2010 2009
Sales………..…….……………….. 65.1% 70.9% 73.3% 79.1% 86.0% 89.5% 100.0%
Cost of goods sold…………… 72.6 76.3 77.4 82.6 89.5 92.1 100.0
TRIPOLY COMPANY
Balance Sheet Trends
December 31, 2015-2009
2015 2014 2013 2012 2011 2010 2009
Cash….…….…….……..……….. 64.7% 67.6% 76.5% 79.4% 88.2% 91.2% 100.0%
Accounts recble., net……….. 81.3 85.0 87.5 90.0 93.8 96.3 100.0
Total assets………..…….……… 88.5 89.6 91.5 90.2 92.7 94.6 100.0
Current liabilities….………..… 52.9 55.7 66.4 67.9 75.0 92.9 100.0
Long-term liabilities……..….. 35.4 46.2 54.6 56.9 74.6 82.3 100.0
Common stock…….…..…......100.0 100.0 100.0 100.0 100.0 100.0 100.0
Other paid-in capital….........100.0 100.0 100.0 100.0 100.0 100.0 100.0
Problem 13-1B (Concluded)
Part 2
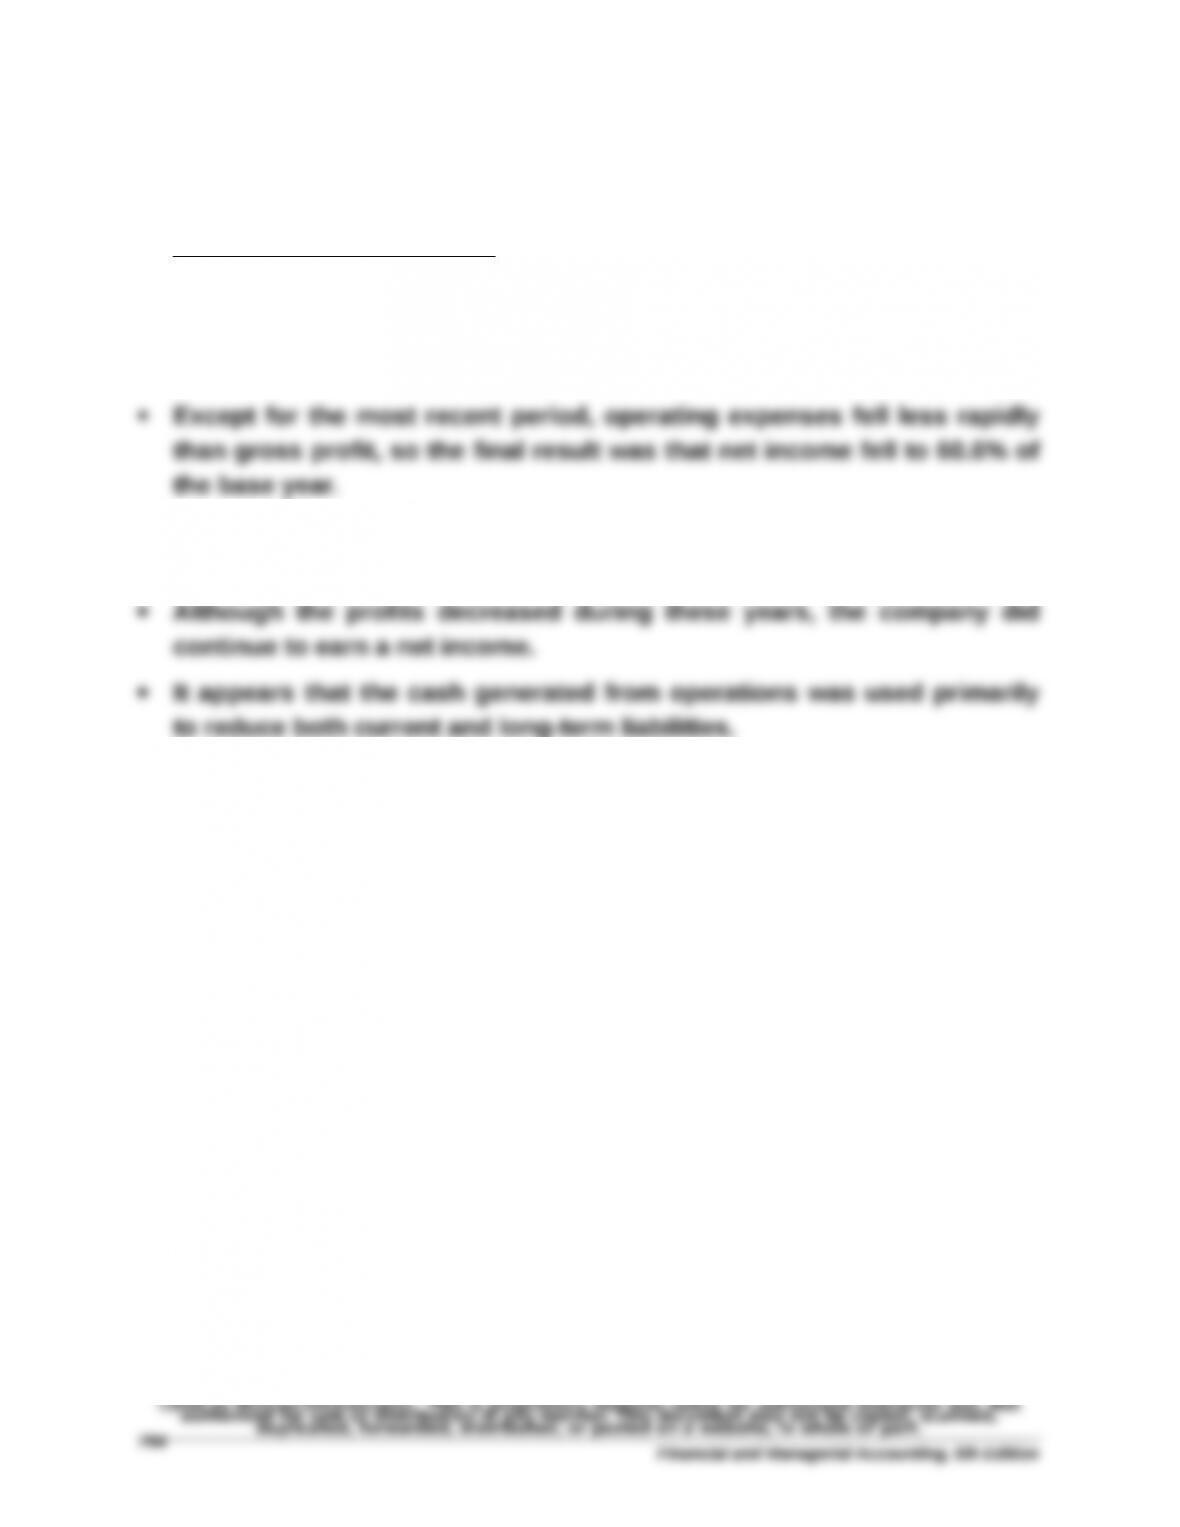
Analysis and Interpretation
The statements and the trend percent data show that sales declined
every year. However, cost of goods sold did not fall as rapidly as sales.
As a result, gross profit fell more rapidly than sales.
Management was not able to reduce costs and expenses fast enough to
keep up with the sales decline.
The company made a large expansion of its plant assets during 2013,
financing this expansion primarily through the liquidation of long-term
investments.
Financial and Managerial Accounting, 6th Edition