Exercise 13-8 (25 minutes)
1. Days’ sales uncollected
2015: x 365 = 48.5 days
2. Accounts receivable turnover
2015: = 8.9 times
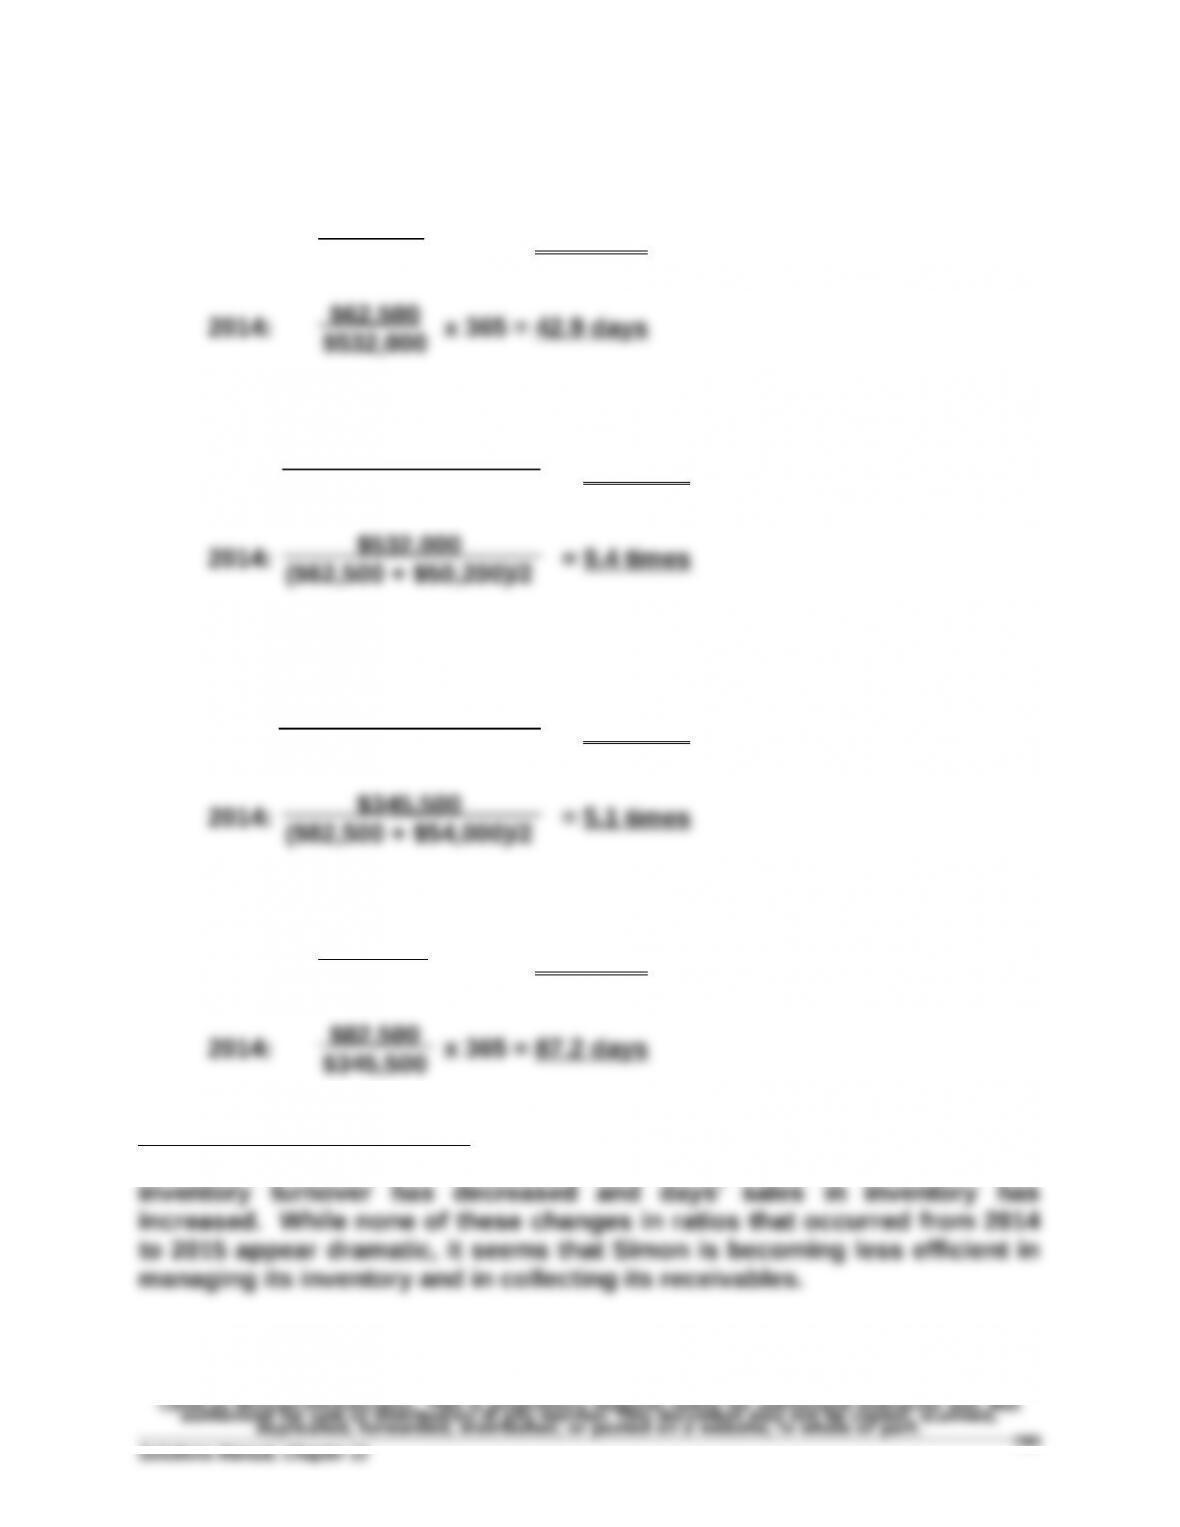
3. Inventory turnover
2015: = 4.2 times
4. Days’ sales in inventory
2015: x 365 = 99.9 days
Analysis and Interpretation: The number of days’ sales uncollected has
increased and the accounts receivable turnover has declined. Also, the
$89,500
$673,500
$673,500
($89,500 + $62,500)/2
$411,225
($112,500 + $82,500)/2
$112,500
$411,225
Exercise 13-9 (25 minutes)
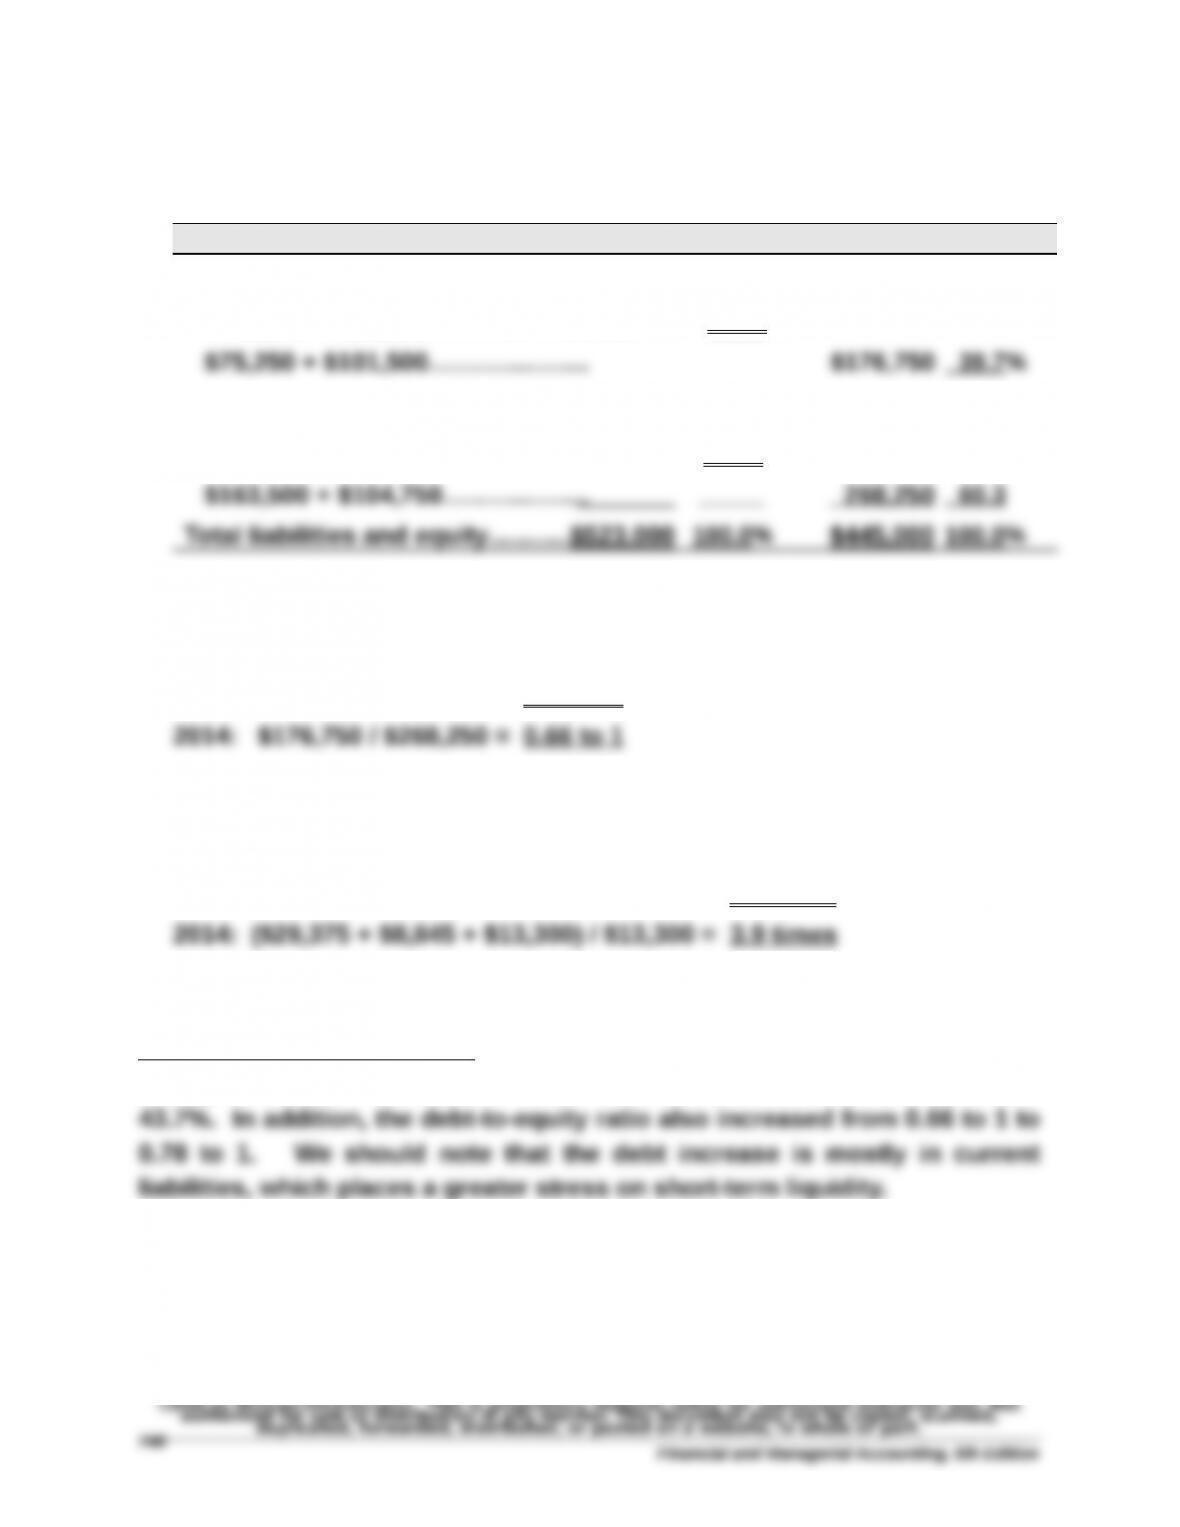
1. Debt and equity ratios
2015 2014
Total liabilities and debt ratio
$129,900 + $98,500……………….….$228,400 43.7%
Total equity and equity ratio
$163,500 + $131,100……………..….294,600 56.3
2. Debt-to-equity ratio
2015: $228,400 / $294,600 = 0.78 to 1
3. Times interest earned
2015: ($31,100 + $9,525 + $12,100) / $12,100 = 4.4 times
Analysis and Interpretation: Simon added debt to its capital structure
during 2015, with the result that the debt ratio increased from 39.7% to
Financial and Managerial Accounting, 6th Edition
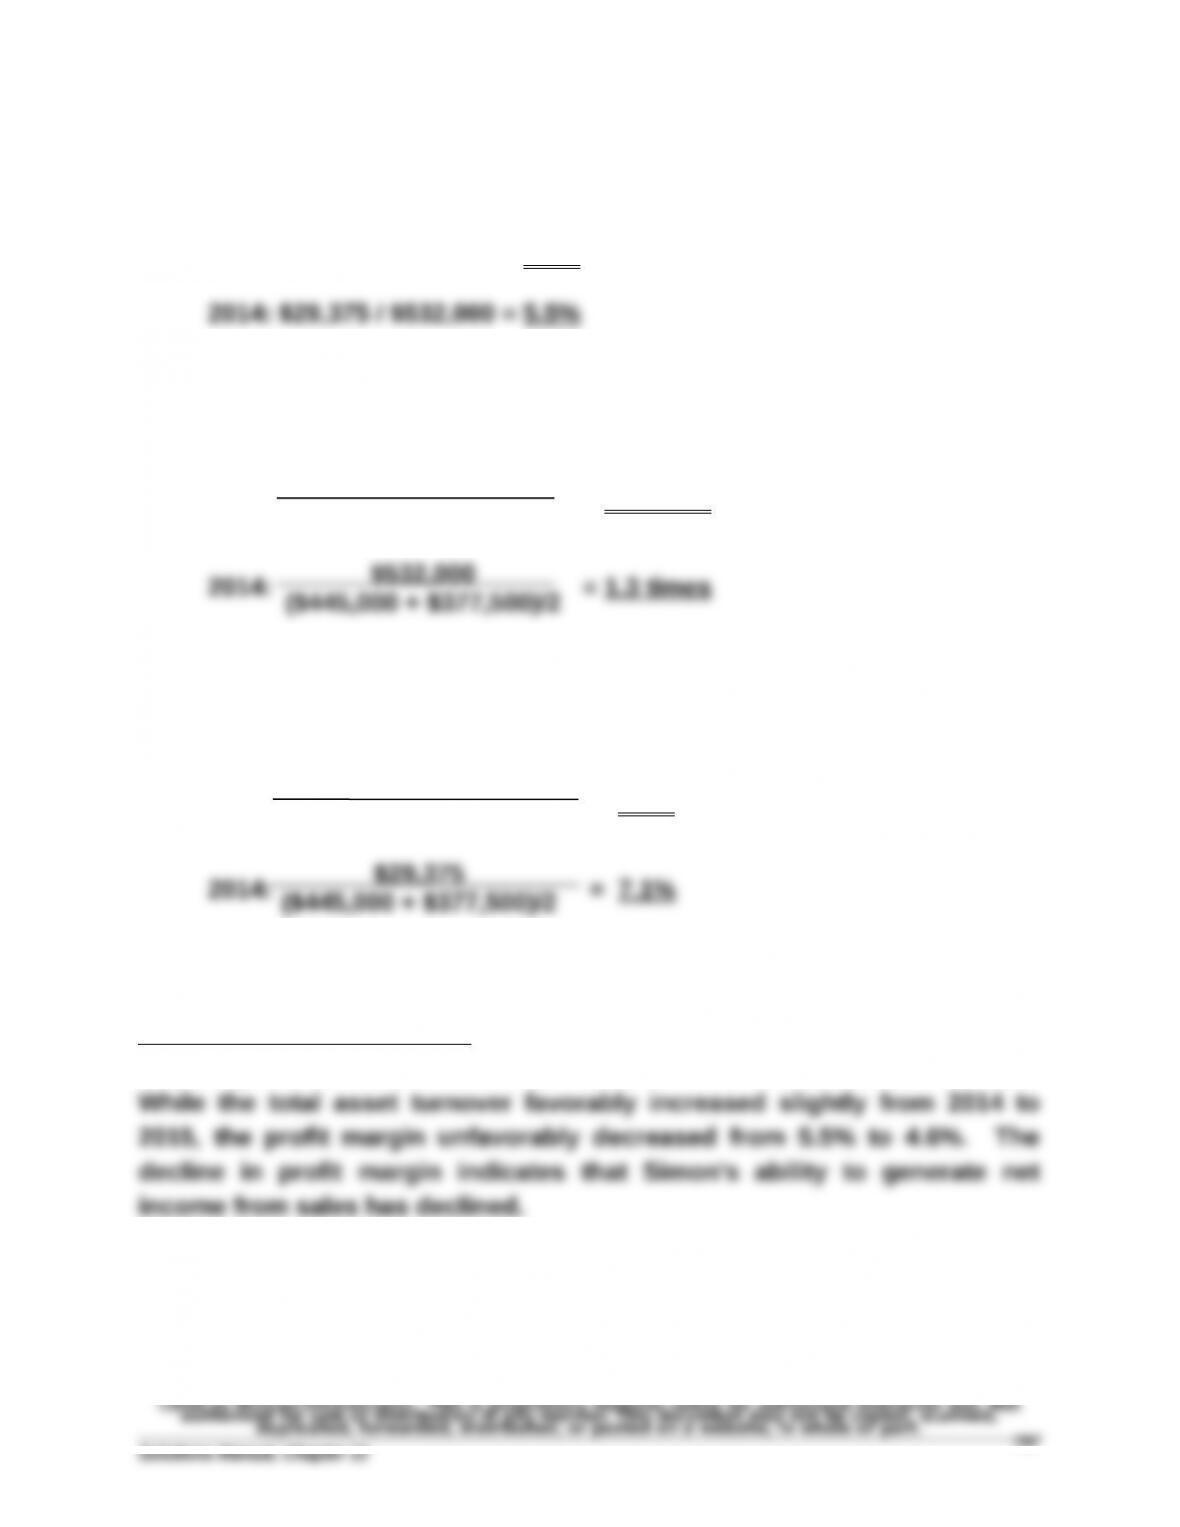
Exercise 13-10 (30 minutes)
1. Profit margin
2015: $31,100 / $673,500 = 4.6 %
2. Total asset turnover
2015: = 1.4 times
3. Return on total assets
2015: = 6.4 %
Analysis and Interpretation: Simon’s operating efficiency appears to be
declining because the return on total assets decreased from 7.1% to 6.4%.
$673,500
($523,000 + $445,000)/2
$31,100
($523,000 + $445,000)/2
Exercise 13-11 (20 minutes)
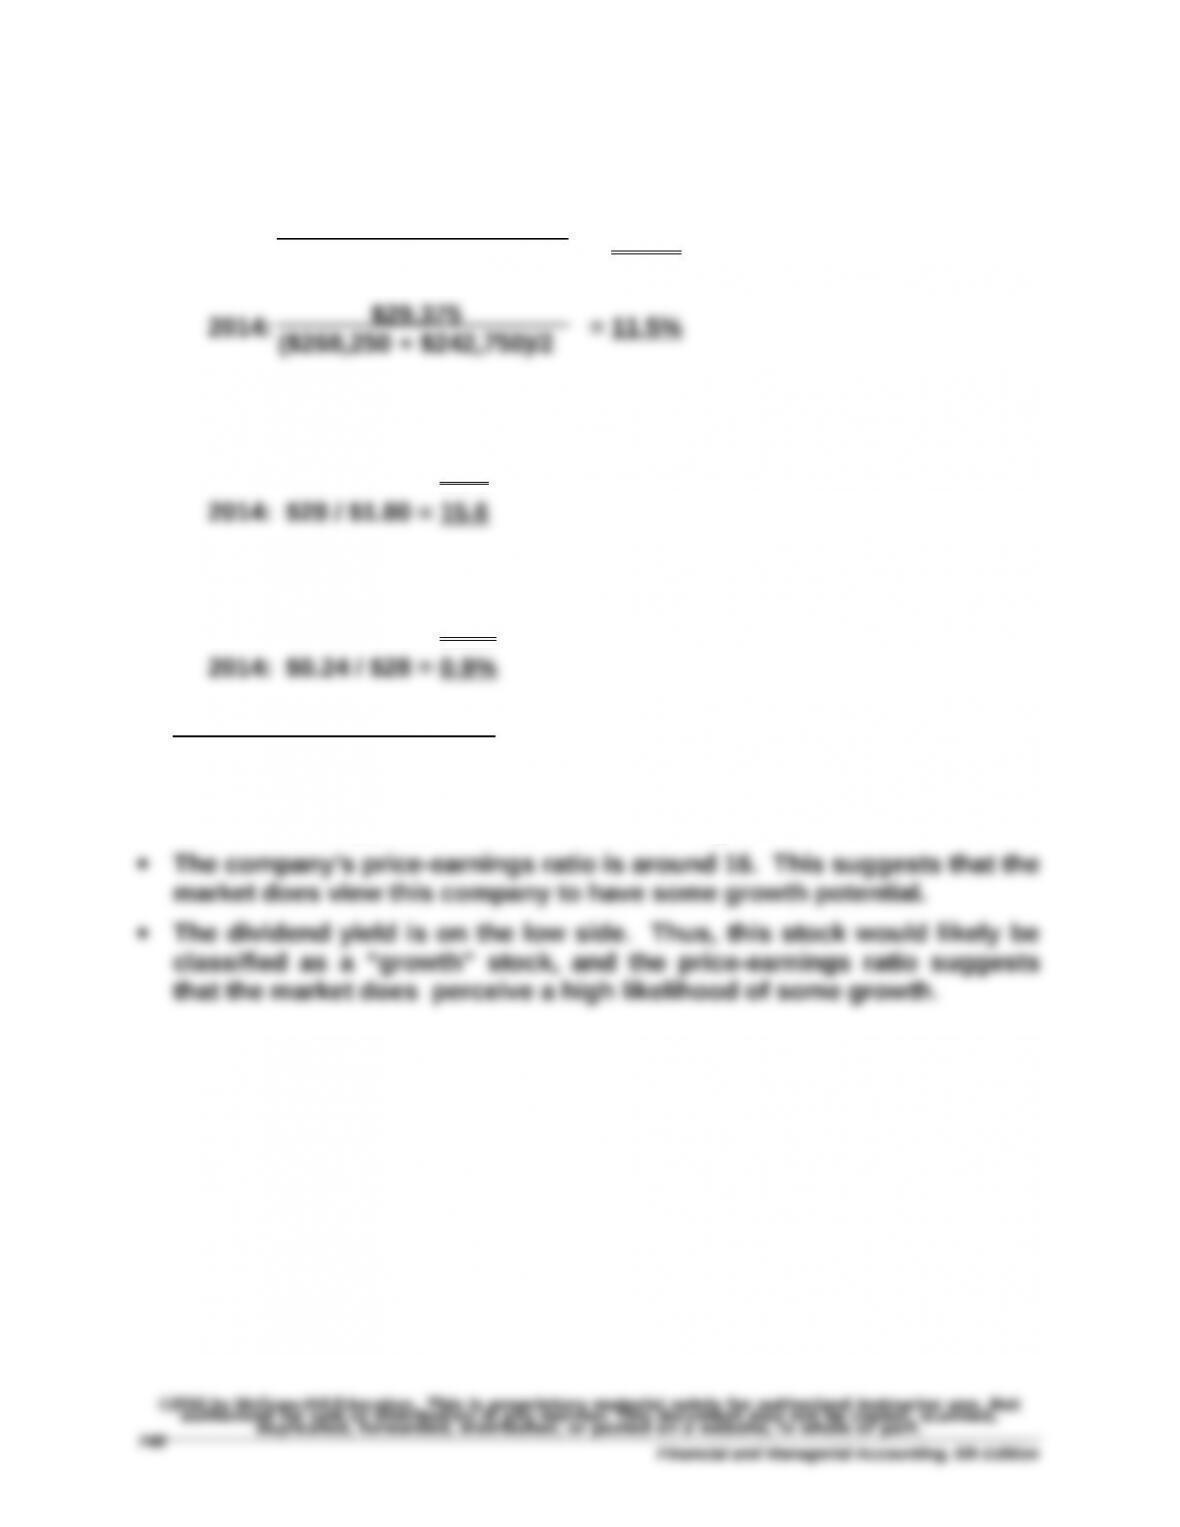
1. Return on common stockholders’ equity
2015: = 11.1%
$31,100
($294,600 + $268,250)/2
Exercise 13-12 (30 minutes)
COMPARATIVE ANALYSIS REPORT
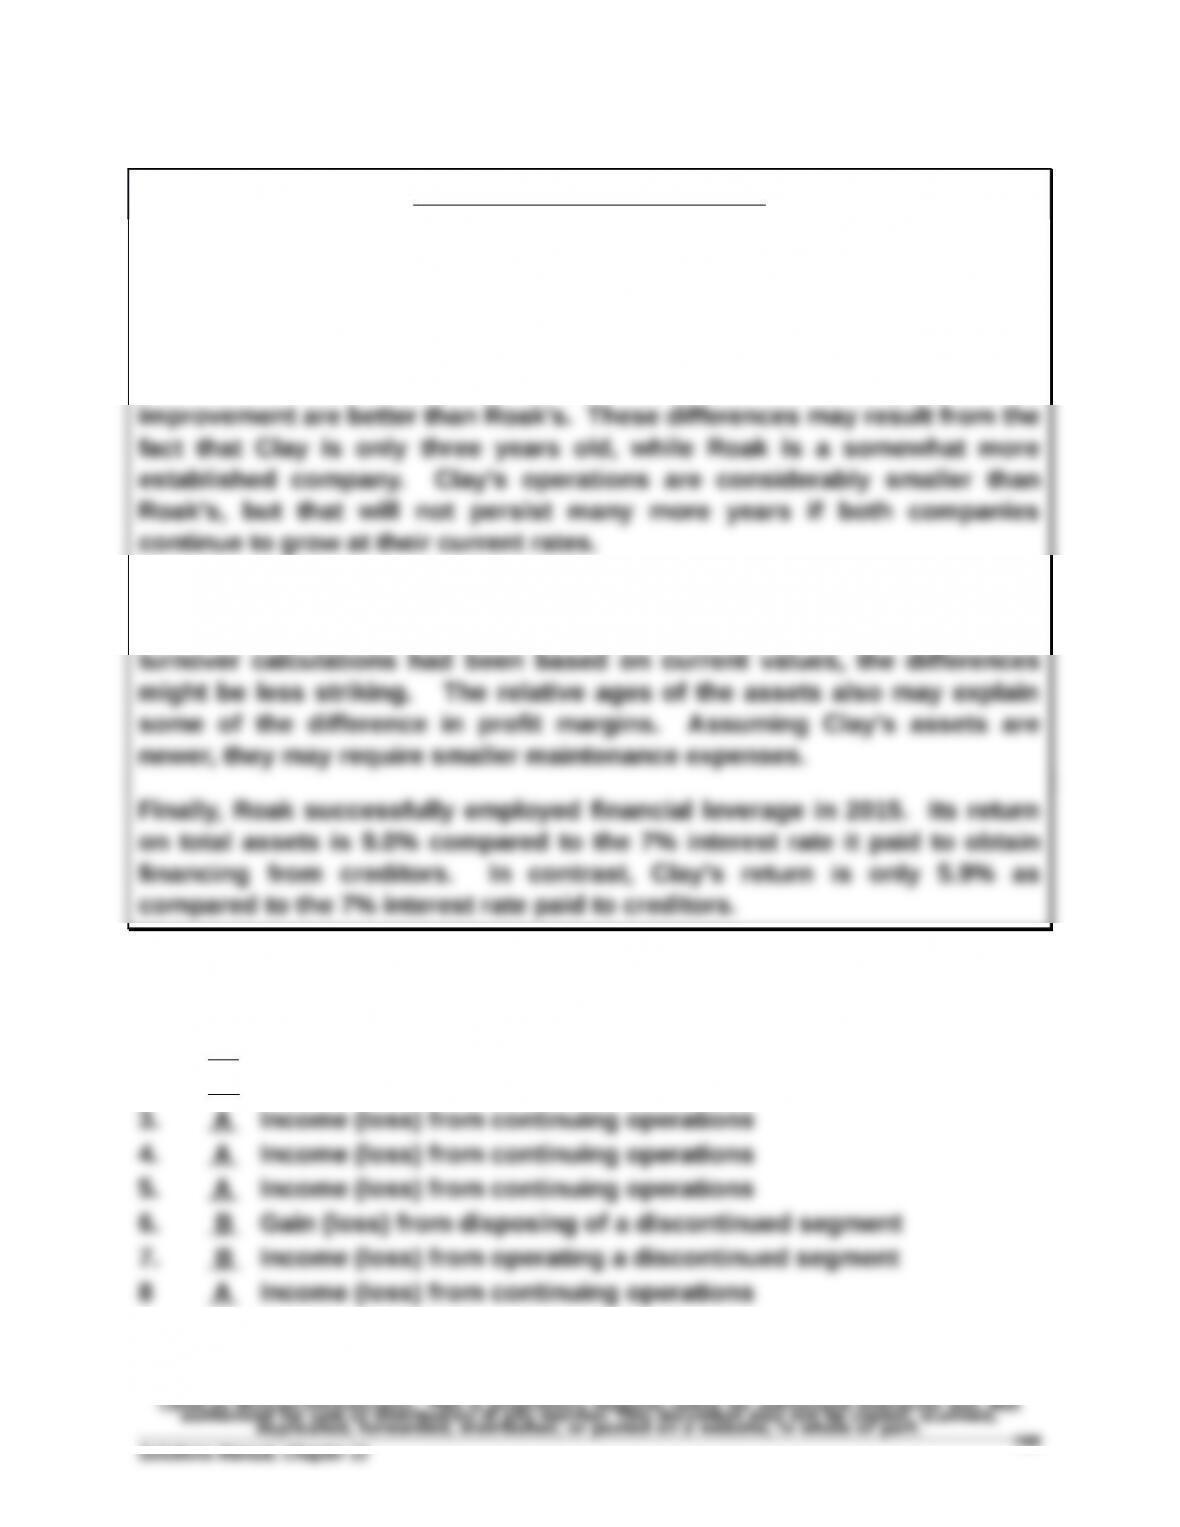
Clay’s profit margins are higher than Roak’s. However, Roak has
significantly higher total asset turnover ratios. As a result, Roak generates
a substantially higher return on total assets.
The trends of both companies include evidence of growth in sales, total
asset turnover, and return on total assets. However, Clay’s rates of
To some extent, Roak’s higher total asset turnover ratios may result from
the fact that its assets may have been purchased years earlier. If the
Exercise 13-13A (10 minutes)
1. A Income (loss) from continuing operations
2. C Extraordinary gain (loss)
Exercise 13-14 (15 minutes)
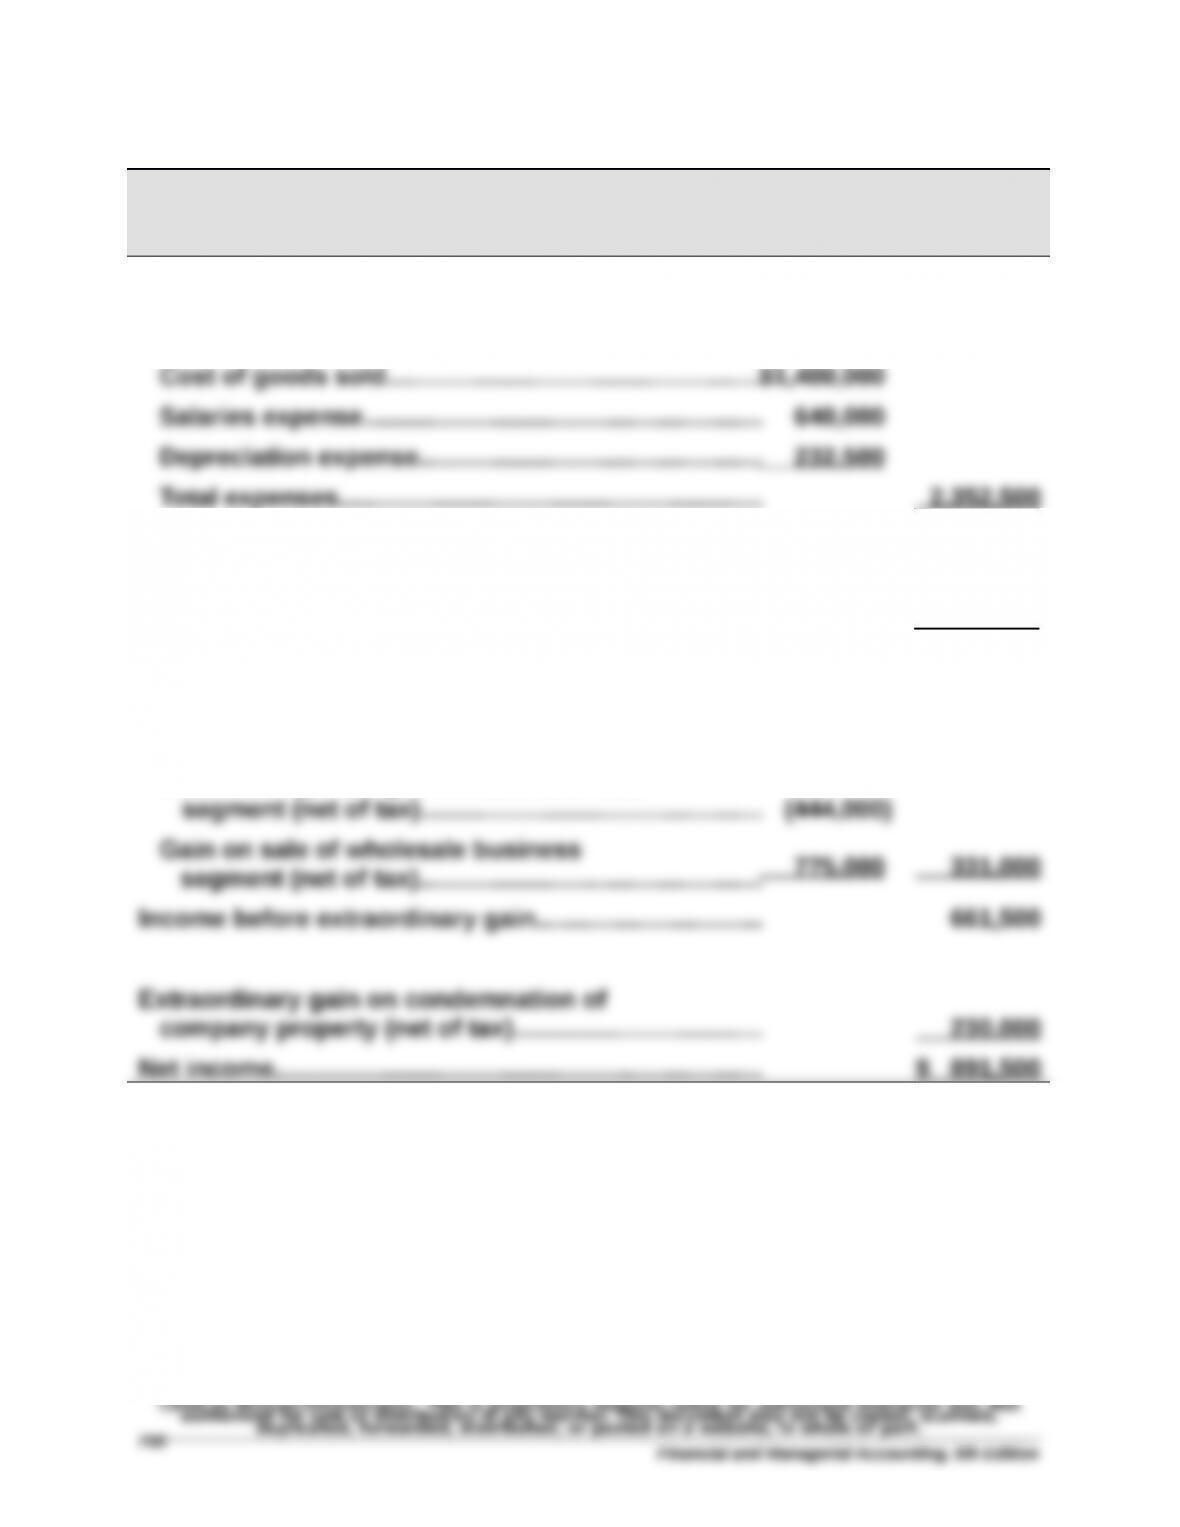
RANDA MERCHANDISING, INC.
Income Statement
For Year Ended December 31, 2015
Net sales………………………………………………..……………... $2,900,000
Expenses
Income from continuing operations before taxes……. 547,500
Income taxes expense………………….……..……………..…. 217,000
Income from continuing operations………….….………... 330,500
Discontinued segment
Loss from operating wholesale business
Financial and Managerial Accounting, 6th Edition
Exercise 13-15 (15 minutes)
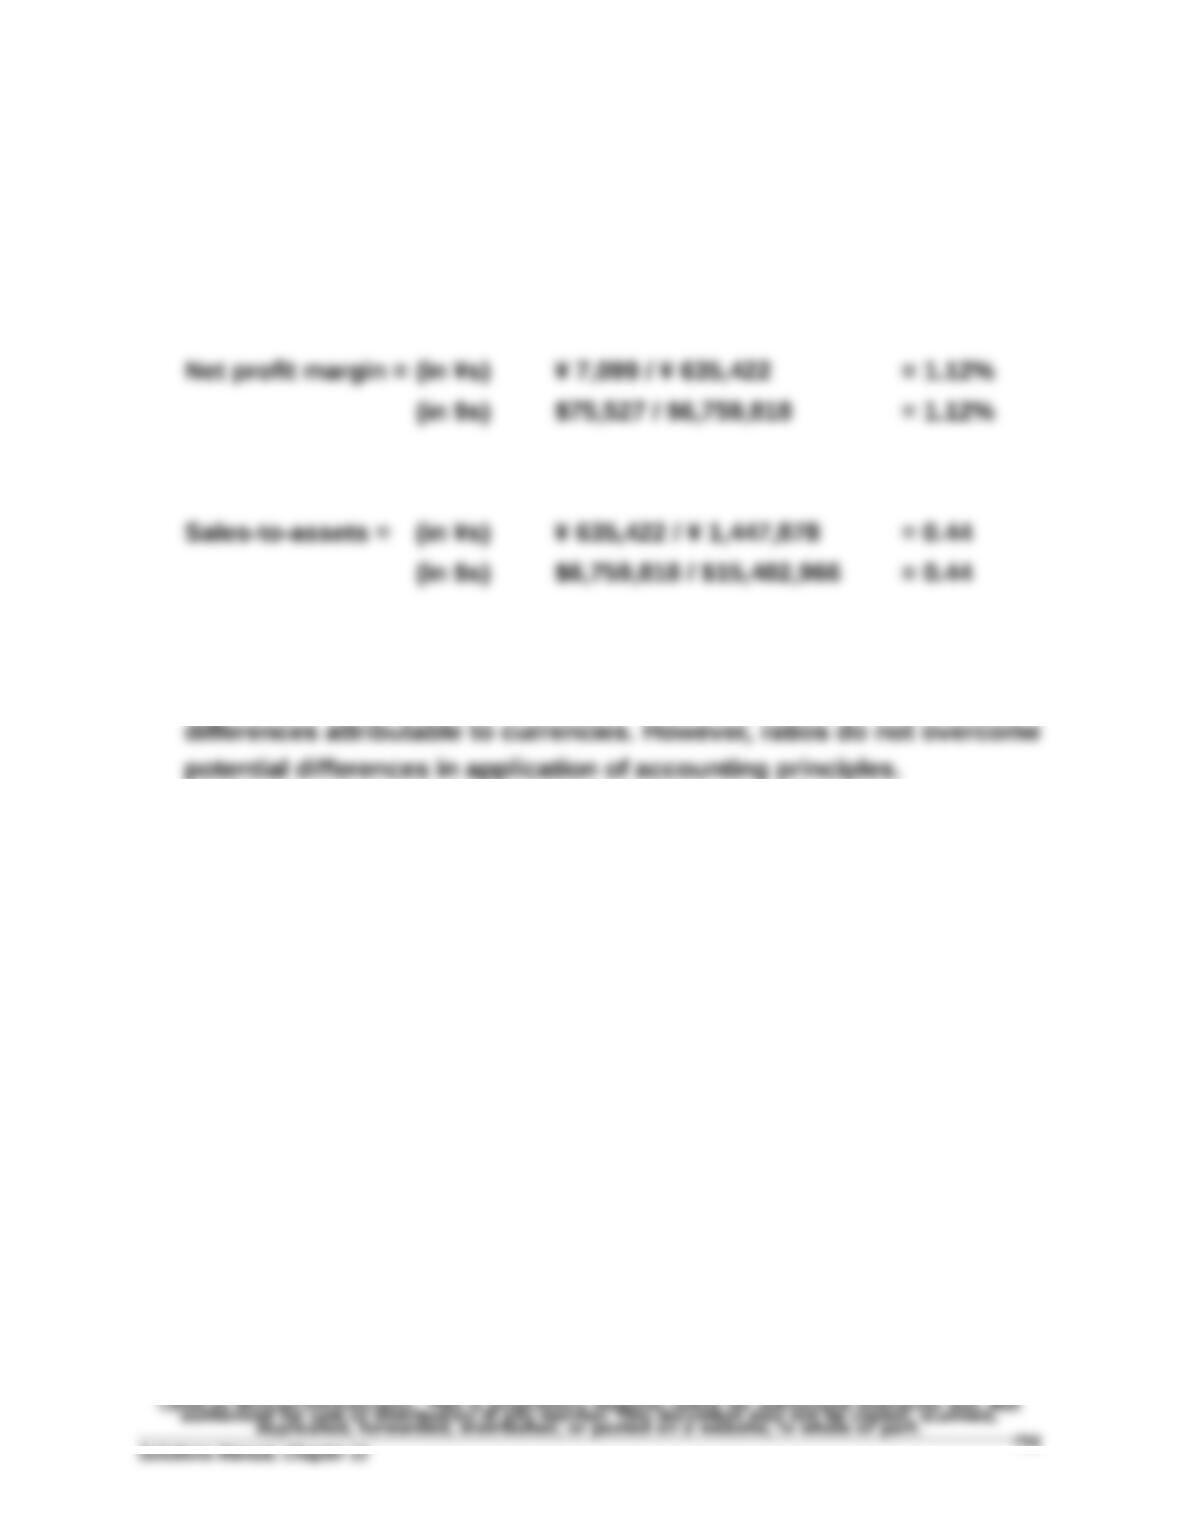
1. Current ratio = (in ¥s) ¥ 1,192,250 / ¥ 194,475 = 6.13
(in $s) $12,683,516 / $2,068,887 = 6.13
2. The results in part 1 reveal that ratios can help us overcome
PROBLEM SET A
Problem 13-1A (120 minutes)
Part 1
HAROUN COMPANY
Income Statement Trends
For Years Ended December 31, 2015-2009
2015 2014 2013 2012 2011 2010 2009
Sales………..…….……………..…
182.5% 161.2% 147.6% 136.2% 127.8% 119.6% 100.0%
Cost of goods sold……………212.6 176.1 153.9 136.9 128.3 121.2 100.0
Net income…..……..…….……..52.7 92.9 104.5 130.4 128.6 114.3 100.0
HAROUN COMPANY
Balance Sheet Trends
December 31, 2015-2009
2015 2014 2013 2012 2011 2010 2009
Cash….…….……..……..…….…..65.2% 87.6% 92.1% 94.4% 98.9% 96.6% 100.0%
Accounts recble., net………..226.9 238.0 215.7 166.7 147.2 139.8 100.0
Merchandise inventory……..298.9 221.8 195.8 167.8 152.2 131.7 100.0
Total assets……..……..………..246.8 222.3 195.4 144.4 138.6 124.0 100.0
Current liabilities….……….….432.6 369.5 254.6 217.7 193.6 185.1 100.0
Long-term liabilities……..…..323.5 285.0 278.0 142.5 145.0 155.0 100.0
Common stock…….…………..153.8 153.8 153.8 130.8 130.8 100.0 100.0
Financial and Managerial Accounting, 6th Edition
Problem 13-1A (concluded)
Part 2
Analysis and Interpretation
The statements and the trend percent data indicate that the company
Sales grew steadily for the entire period of 2009 to 2015. However,
In 2015, net income was only 52.7% of the 2009 base year amount.
At the same time that net income was declining, assets were increasing.
The short-term liquidity of the company continued to decline. Accounts
Problem 13-2A (60 minutes)
Part 1
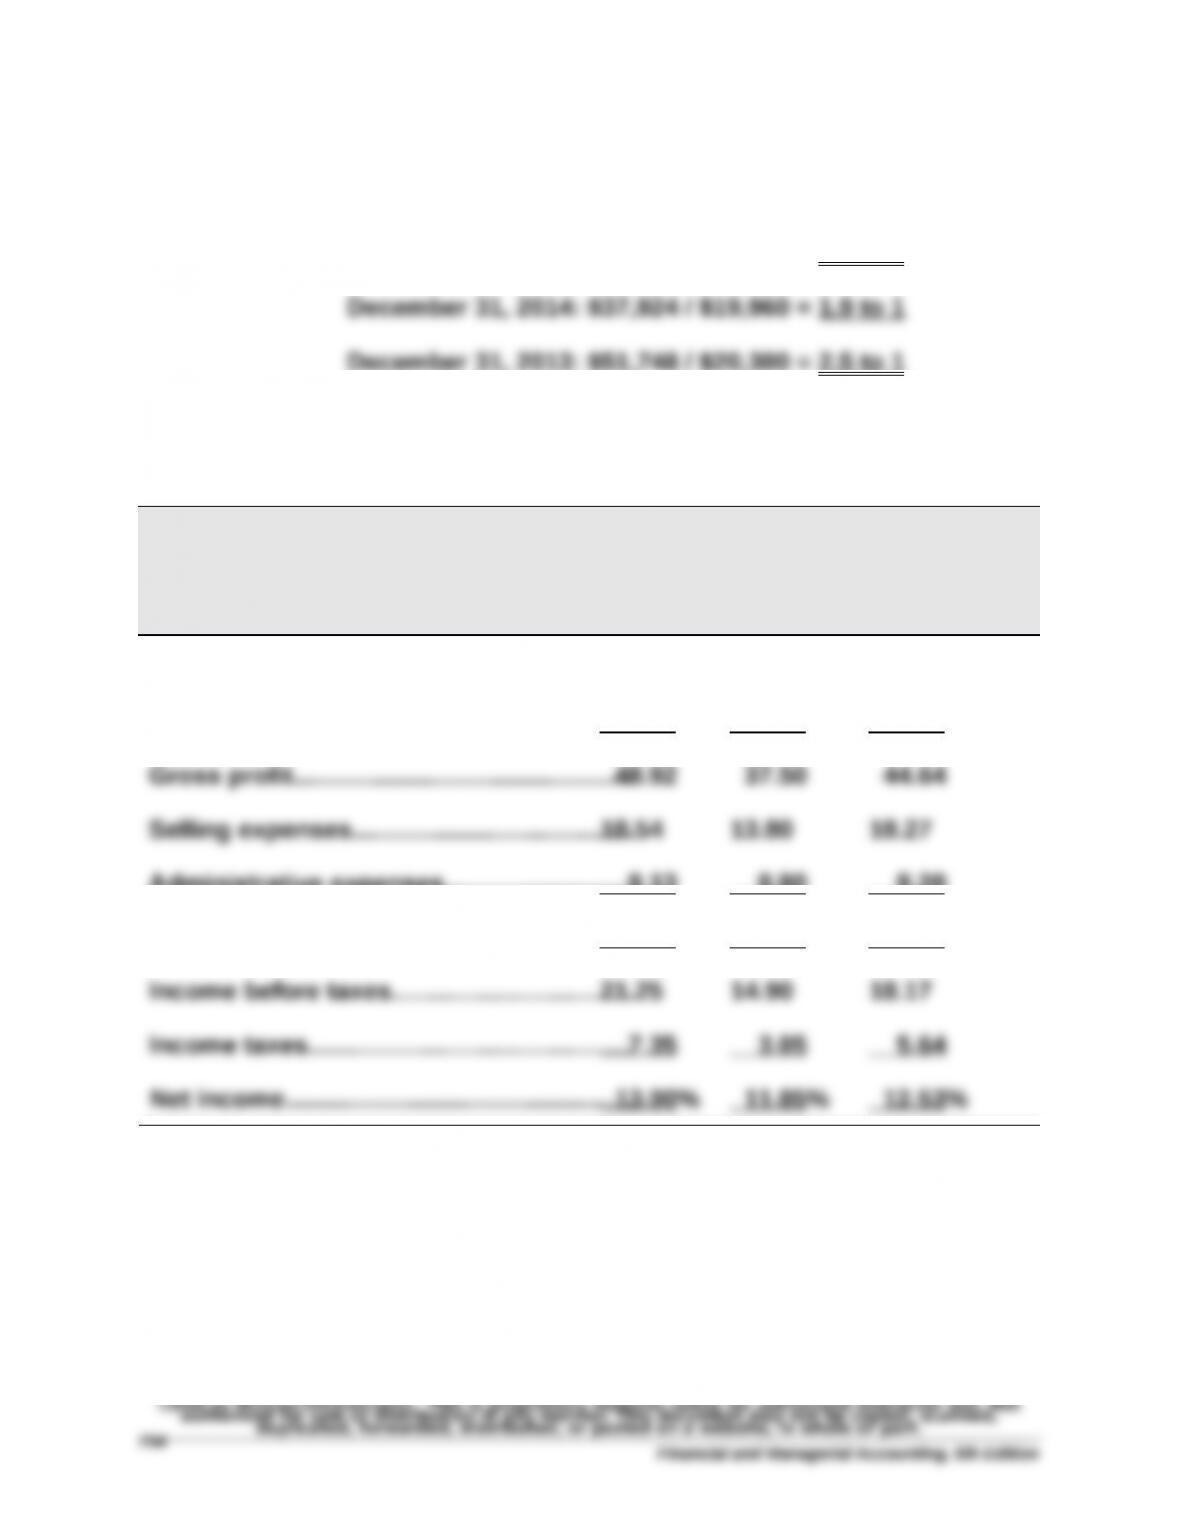
Current ratio: December 31, 2015: $52,390 / $22,800 = 2.3 to 1
Part 2
KORBIN COMPANY
Common-Size Comparative Income Statements
For Years Ended December 31, 2015, 2014, and 2013
2015 2014 2013
Sales……………..……………………………….…...100.00% 100.00% 100.00%
Cost of goods sold………….………………..…. 51.08 62.50 55.36
Administrative expenses……………..………. 9.13 8.80 8.20
Total expenses………………..…..………..……. 27.67 22.60 26.47
Financial and Managerial Accounting, 6th Edition