
Serial Problem (Continued)
PURCHASES JOURNAL Page 2
Date Account
Date of
Invoice Terms PR
Accounts
Payable
Cr.
Inventory
Dr.
Computer
Supplies
Dr.
Other
Accounts
Dr.
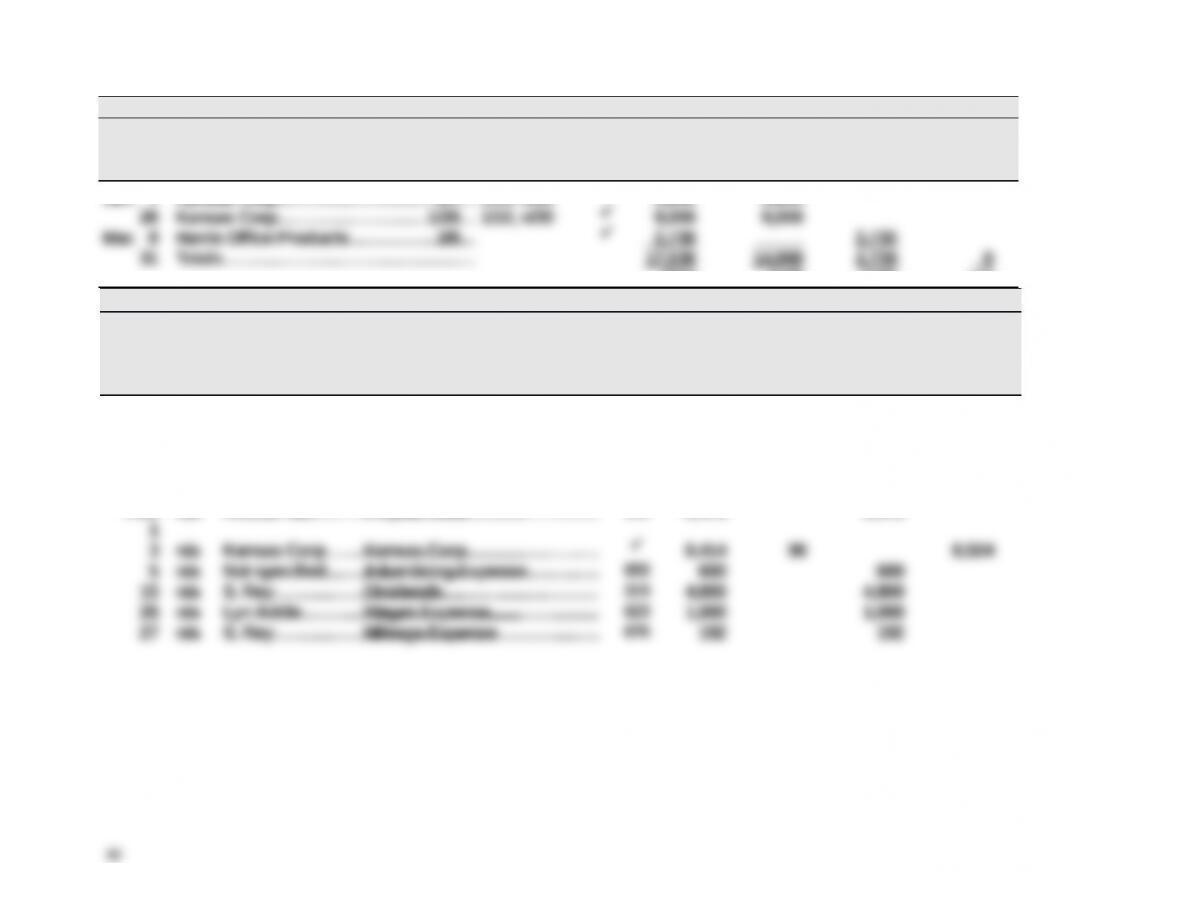
Jan. 7 Kansas Corp……………..……..…….……..1/7 1/10, n/30 5,800 5,800
Serial Problem, Business Solutions (Concluded)
Part 3
GENERAL JOURNAL Page 2
2016
Jan. 5 Cash…………………………………..…………….…….…101 25,000
Common Stock………………..………………...307 25,000
Additional investment by owner in exchange
for stock.
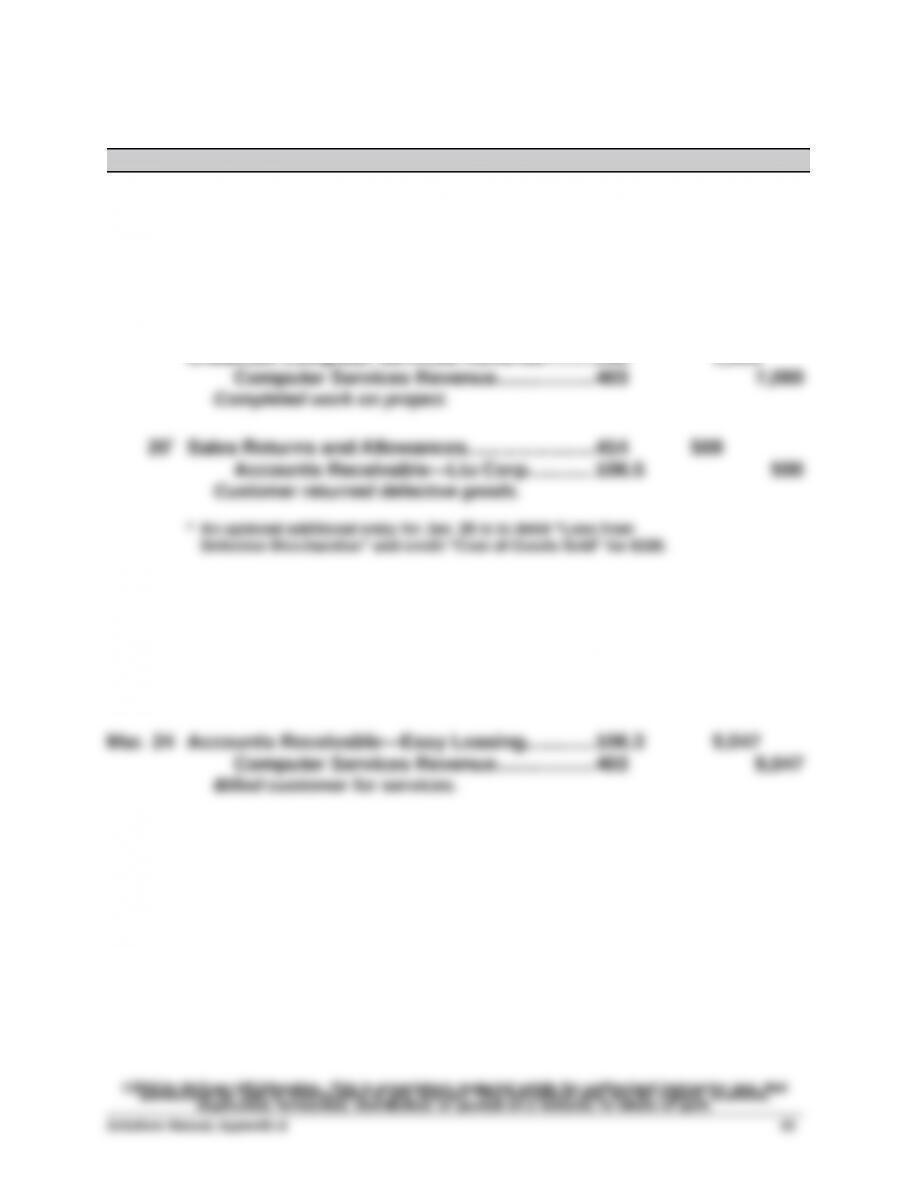
11 Accounts Receivable—Alex’s Eng. Co………..106.1 5,500
Unearned Computer Services Revenue.........236 1,500
24 Accounts Payable—Kansas Corp……………….201 496
Merchandise Inventory…………………….…119 496
Returned merchandise for credit.
29 No entry recorded in the journal (but memorandum noted).
Reporting in Action — BTN E-1
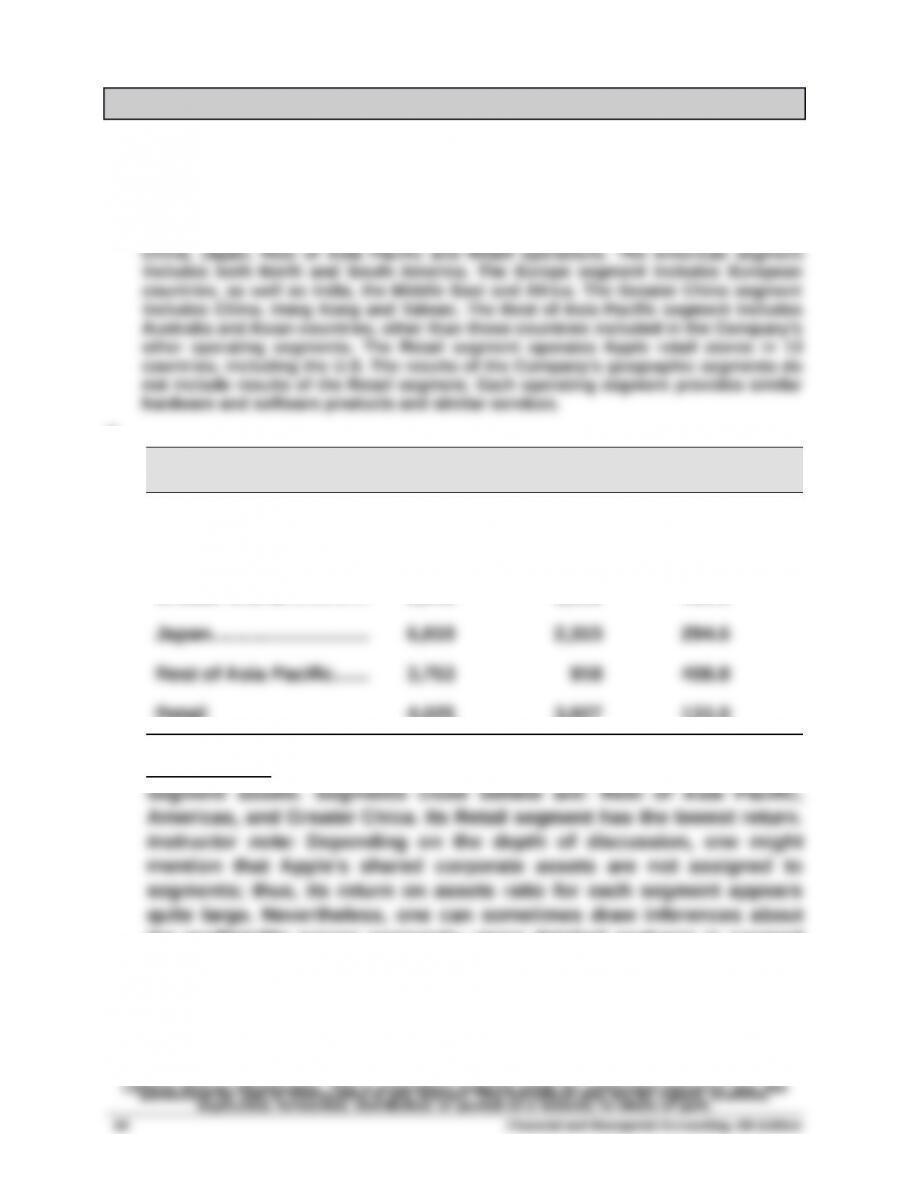
1. Apple’s Note 11 reports on its business segment.
2. Apple identifies and describes its reportable segment in its Note 11 as
follows: “The Company manages its business primarily on a geographic basis. The
Company’s reportable operating segments consist of the Americas, Europe, Greater
3.
Segment
Operating
Income
Average
Assets
Return on
Assets
Americas….….…….…..... $22,817 $5,589 408.2%
Europe………..….…….….. 13,025 3,115 418.1
Greater China……………. 8,541 2,132 400.6
Retail 4,025 3,027 133.0
Interpretation: The Europe segment reports the highest return on
the profitability across segments—more detailed analyses is covered
in advanced courses.
4. Solution depends on the most recent information obtained.
Comparative Analysis — BTN E-2
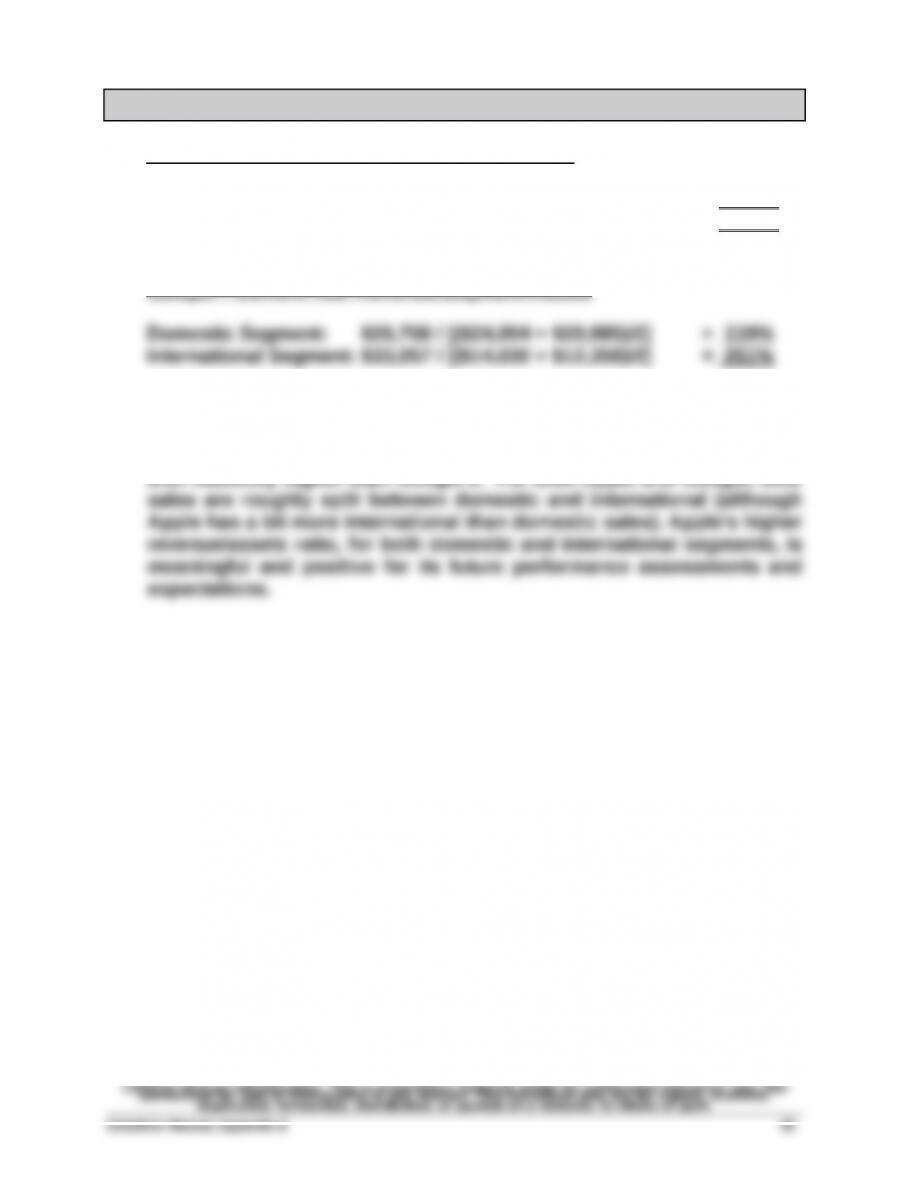
1. Apple – Current Year Revenue/Segment Assets
Domestic segment: $ 62,739 / [($ 5,653 + $5,525)/2] = 1122%
International segment: $108,171/ [($13,261 + $9,752)/2] = 940%
Google – Current Year Revenue/Segment Assets
2. Apple’s domestic revenue as a percent of its domestic assets is
markedly higher than that of Google’s for the domestic segment. For
the international segment, Apples revenue as a percent of assets is
also markedly higher than Google’s. For both Apple and Google, their
Ethics Challenge — BTN E-3
1. Independence in fact means that the auditor maintains an objective
point of view of the client. Independence in appearance means that a
2. While auditors are hired by their clients to perform audits, auditors
have a responsibility to the company’s “stakeholders” and the public.
3. Since Erica Gray is a sole practitioner it is questionable whether she
can consult on the client’s accounting system and then remain
objective in subsequent years when she performs the audit of the
company. Large firms often separate consulting and auditing
clients. This was codified by the SEC [Final Ruling 68].)
Communicating in Practice — BTN E-4
The memo should recommend the use of special journals and subsidiary
ledgers. It should explain the time-saving aspect of journalizing in labeled
columns and also the posting of column totals representing the impact of
groups of like transactions. The memo should discuss the timely
information provided by subsidiary ledgers regarding customer and
creditor balances. A discussion of the uses of a schedule for verifying the
accuracy of subsidiary ledgers should also be included.
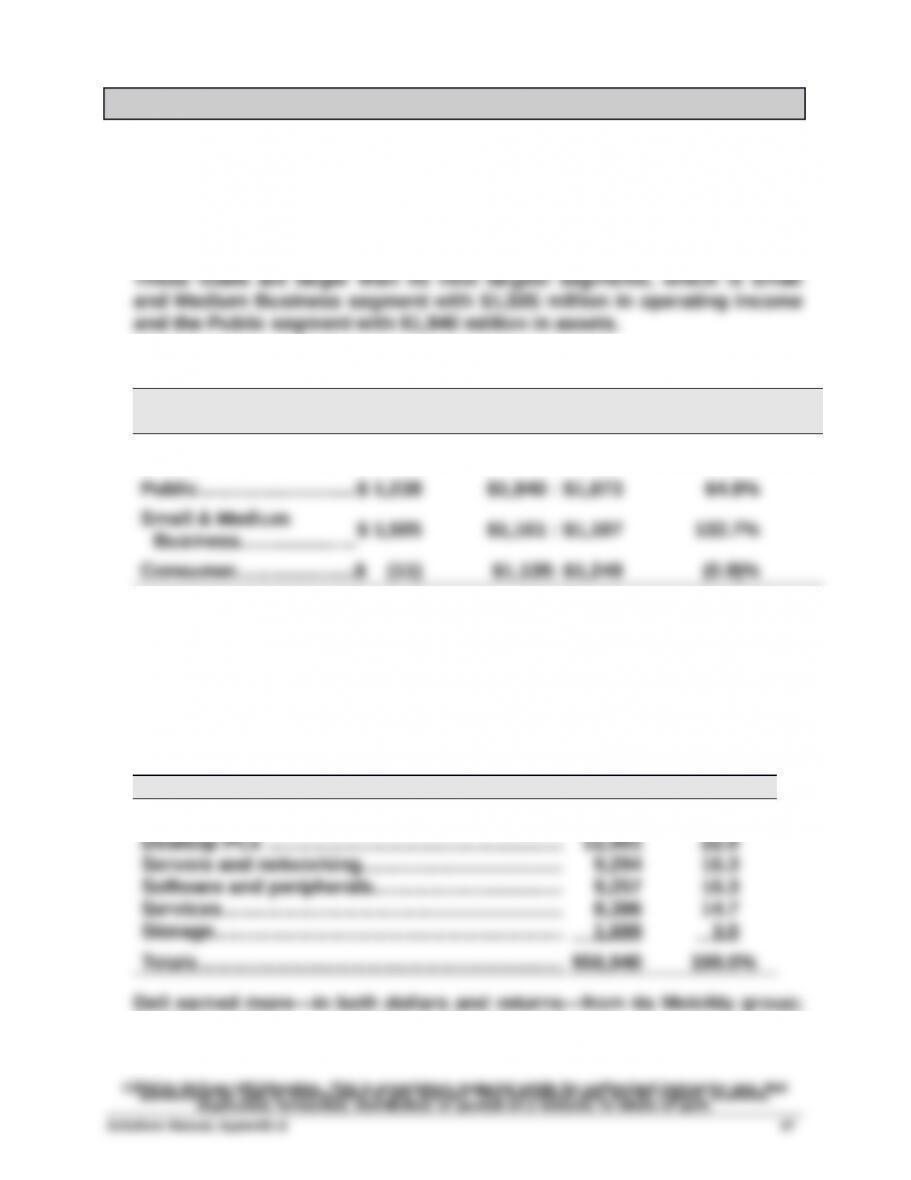
Taking It to the Net — BTN E-5
(See Dell’s Note 15 – Segment Information)
1. Large Enterprise; Public; Small and Medium Business; and Consumer.
2. The Large Enterprise segment reports $1,553 million of operating income
and the Large Enterprise segment reports $3,054 million of assets.
3. Dell’s Operating Income and Total Assets by Segment
($ millions)
Operating
Income 2013
Total Assets 2013 :
Total Assets 2012
Segment Return
on Assets
Large Enterprise…........$ 1,553 $3,054 : $2,729 53.7%
The Small and Medium Business had the highest segment return on
assets for the fiscal year ended 2013 with a 132.7% return. The other
three segments had returns on assets ranging from (0.9)% to 64.9%.
4. The six product groups reported by Dell include: Desktop PCs, Mobility,
Software and peripherals, Servers and networking, Enhanced services,
and Storage.
($ millions) 2013 Fiscal Year
Mobility…………..…………………………..….…….……. $15,303 26.9%
its Desktop PCs was second in both categories.
Teamwork in Action — BTN E-6
For check figures in the implementation of this activity see the solution
to Problem E-1A or E-1B.
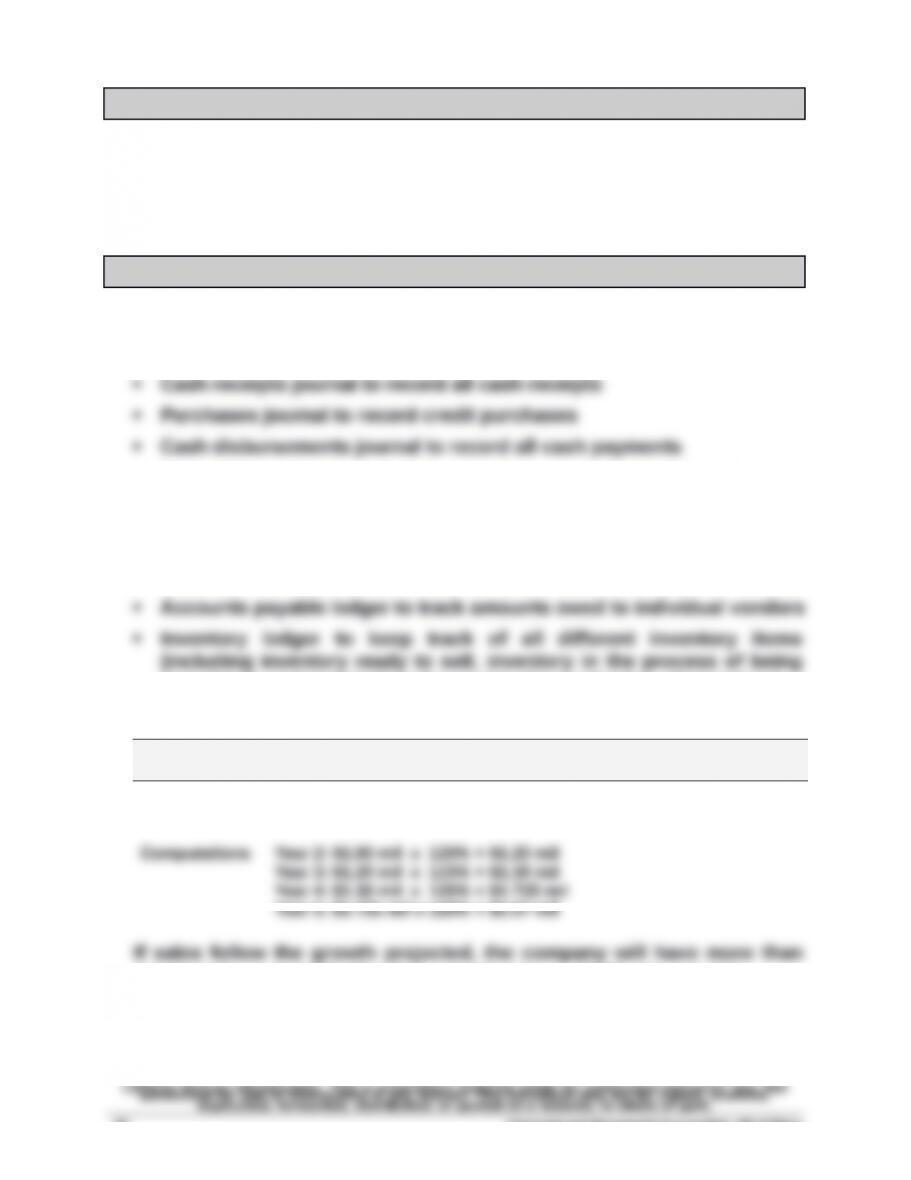
Entrepreneurial Decision — BTN E-7
1. The following special journals are likely to be used:
Sales journal to record credit sales
General journal to record all transactions not in special journals
The company also is likely to use the following subsidiary ledgers:
Accounts receivable subsidiary ledger to track amounts owed by
individual customers
completed, and materials to be used in the production of inventory)
2.
Year
One Year
Hence
Two Years
Hence
Three Years
Hence
Four Years
Hence
Five Years
Hence
Sales………………….……..$1.00 mil 1.20 mil $1.38 mil $1.725 mil $2.07 mil
doubled the current $1.00 mil in annual sales to $2.07 mil annually.
Financial and Managerial Accounting, 6th Edition
68
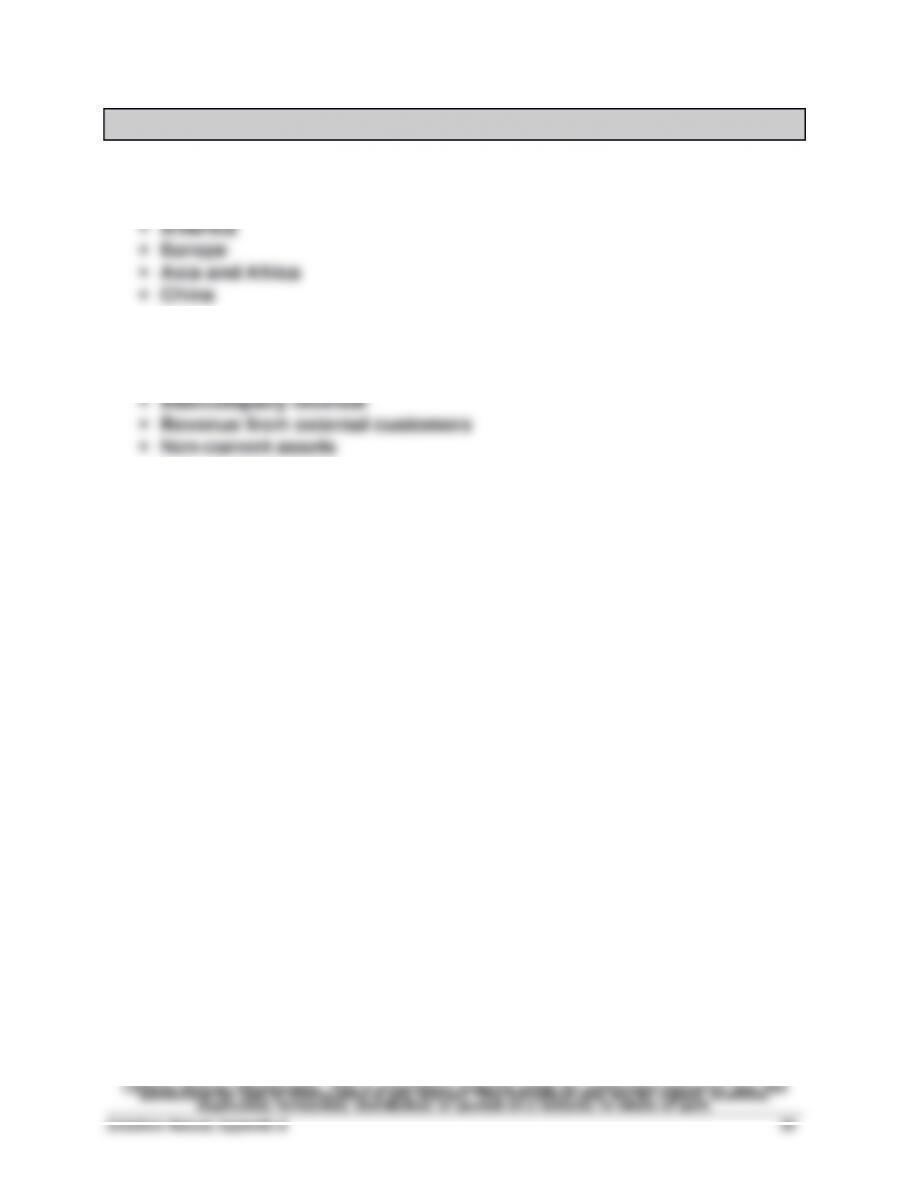
Global Decision — BTN E-8
1. Samsung has the following reported segments:
Korea
2. Samsung discloses dollar amounts for the following line items:
Total segment revenue
3. Yes. On most financial measures reported, the Korea segment appears
to dominate Samsung’s other segments.