
Chapter 09 – Behavioral Finance and Technical Analysis
1. Note the following matches:
a. Investors are slow to update their beliefs when given new evidence –
Conservatism bias
2. Representativeness bias. The sample size is not considered when making future
decisions.
3. Fundamental risk means that even if a security is mispriced, it still can be risky to
attempt to exploit the mispricing because the correction to price could happen
4. The premise of behavioral finance is that conventional financial theory ignores
how real people make decisions and that people make a difference. Behavioral
5. An unfortunate consequence of behavioral finance (BF) is a tendency for
investors to assume more than actually is claimed by the field. While BF is highly
6. c. Loss aversion.
7. a. Fear of regret.
9-1

8. a. Selling losers quickly.
9. Statement b, that a price has moved above its 52 week moving average, is
considered a bullish sign.
10. After the fact, you can always find patterns and trading rules that would have
11. Grinblatt and Han (2005) show that the disposition effect can lead to momentum
in stock prices even if fundamental values follow a random walk. This momentum
12. Arbitrage assumes the ability to initiate trades based on arbitrage information. A
severe limit of the theory is that similar assets should be priced similarly (law of
one price). An example of a limit in which such a trade is not possible is the case
13. Some people may say it is consistent with both. This is consistent with efficient
markets since the price does approach intrinsic value. Behavioral would say it is
14. Trin =
Volume Declining/Number Declining
Value Advancing/Number Advancing
=
Equity in Account
Value of Stock
Equity in Account
Value of Stock
231,468,687/270
15. Breadth:
Advances Declines Net Advancing
2,787
270
2,517
16. This exercise is left to the student.
17. The confidence index increases from 5%/7% = 0.7143 to 6%/8% = 0.7500.
18. At the beginning of the period the relative strength of Computers, Inc., the
price of the stock divided by the industry index, was 19.63/50.0 = 0.3926;
19. Five day moving averages:
Trading Day 5-Day Moving Average
Days 1–5 (19.63 + 20 + 20.50 + 22 + 21.13)/5 = 20.652
Days 2–6 (20 + 20.50 + 22 + 21.13 + 22)/5 = 21.126
Days 3–7 (20.50 + 22 + 21.13 + 22 + 21.88)/5 = 21.502
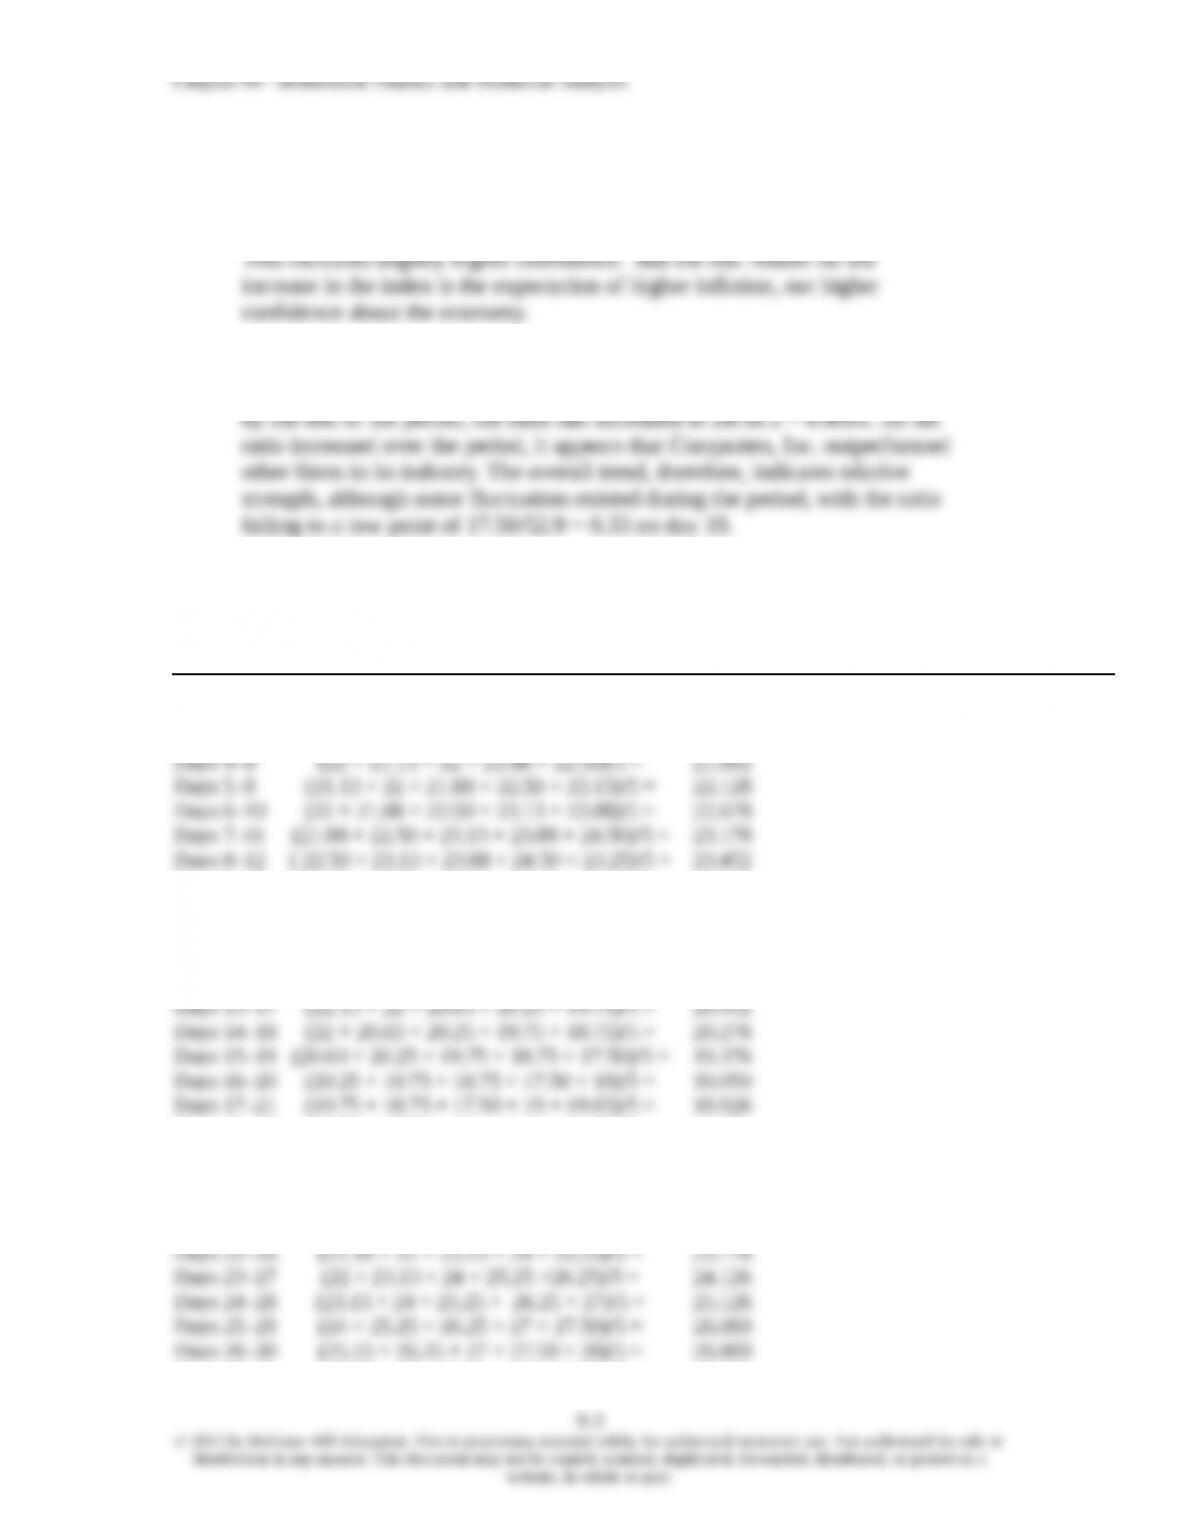
Days 9–13 (23.13 + 23.88 + 24.50 + 23.25 + 22.13)/5 = 23.378
Days 10–14 (23.88 + 24.50 +23.25 + 22.13 + 22)/5 = 23.152
Days 11–15 (24.50 + 23.25 + 22.13 + 22 + 20.63)/5 = 22.502
Days 12–16 (23.25 + 22.13 + 22 + 20.63 + 20.25)/5 = 21.652 Sell signal
(day 12 price < moving average)
Days 18–22 (18.75 + 17.50 + 19 + 19.63 + 21.50)/5 = 19.276
Days 19–23 (17.50 + 19 + 19.63 + 21.50 + 22)/5 = 19.926
Days 20–24 (19 + 19.63 + 21.50 +22 + 23.13)/5 = 21.052
Days 21–25 (19.63 + 21.50 + 22 + 23.13 + 24)/5 = 22.052 Buy signal
(day 21 price > moving average)
Days 27–31 (26.25 + 27 + 27.50 + 28 + 28.50)/5 = 27.450

Chapter 09 – Behavioral Finance and Technical Analysis
Days 33–37 (27.50 + 29 + 29.25 + 29.50 + 30)/5 = 29.050 Sell signal
(day 33 price < moving average)
Days 34–38 (29 + 29.25 + 29.50 + 30 + 28.50)/5 = 29.250
Days 35–39 (29.25 + 29.50 + 30 + 28.50 + 27.75)/5 = 29.000
Days 36–40 (29.50 + 30 + 28.50 + 27.75 + 28)/5 = 28.750
20.
Buy
30 X
28 X 0
26 X
24 X X
21. This pattern shows a lack of breadth. Even though the index is up, more stocks
22.
Day Advances Declines Net
Advances
Cumulative
Breadth
1
906
704
202
202

23. Trin =
Volume Declining/Number Declining
Value Advancing/Number Advancing
=
900,000,000/704
1,100,000, 000/906
=
1.0529
24. Confidence Index =
Yield on Top-Rated Corporate Bonds
Yield on Intermediate-Grade Corporate Bonds
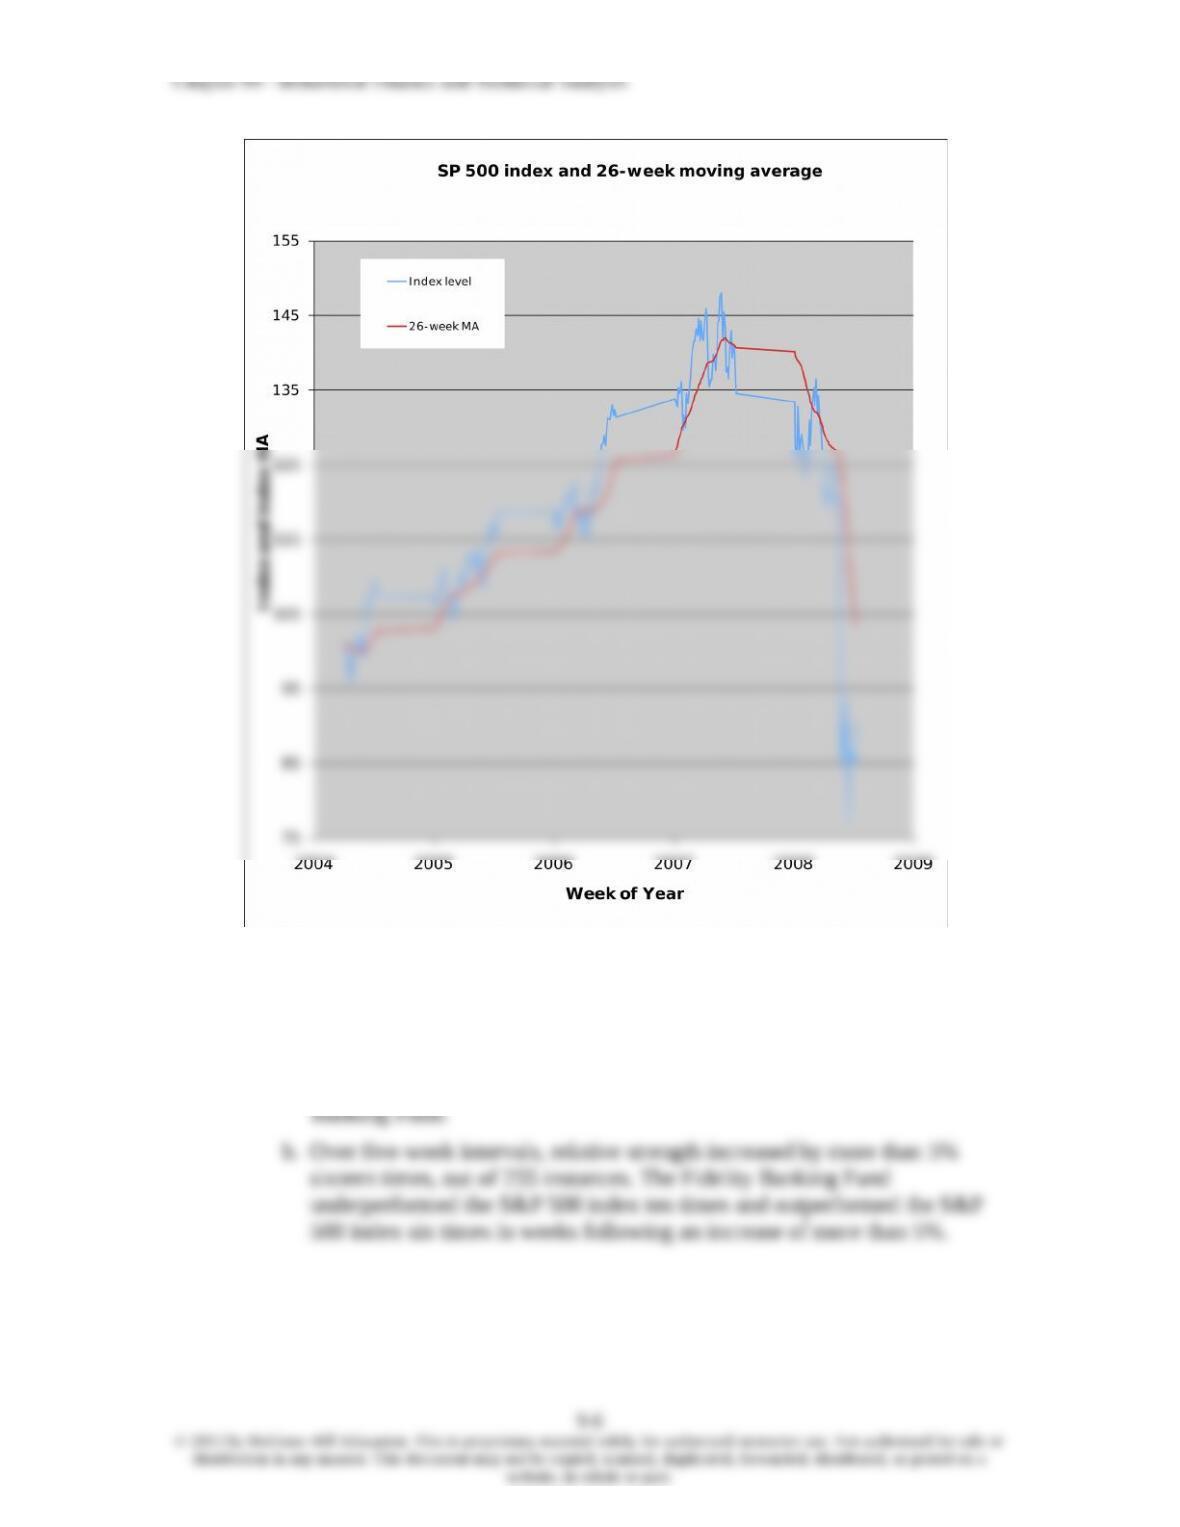
25. [Note: In order to create the 26-week moving average for the S&P 500, we first
converted the weekly returns to weekly index values, using a base of 100 for the
week prior to the first week of the data set.]
a. The graph below summarizes the data for the 26-week moving average.
26. [Note: In order to create the relative strength measure, we convert the weekly
returns for the Fidelity Banking Fund and for the S&P 500 to base 100 weekly
index values.]
a. The graphs summarize the relative strength of data for the Fidelity
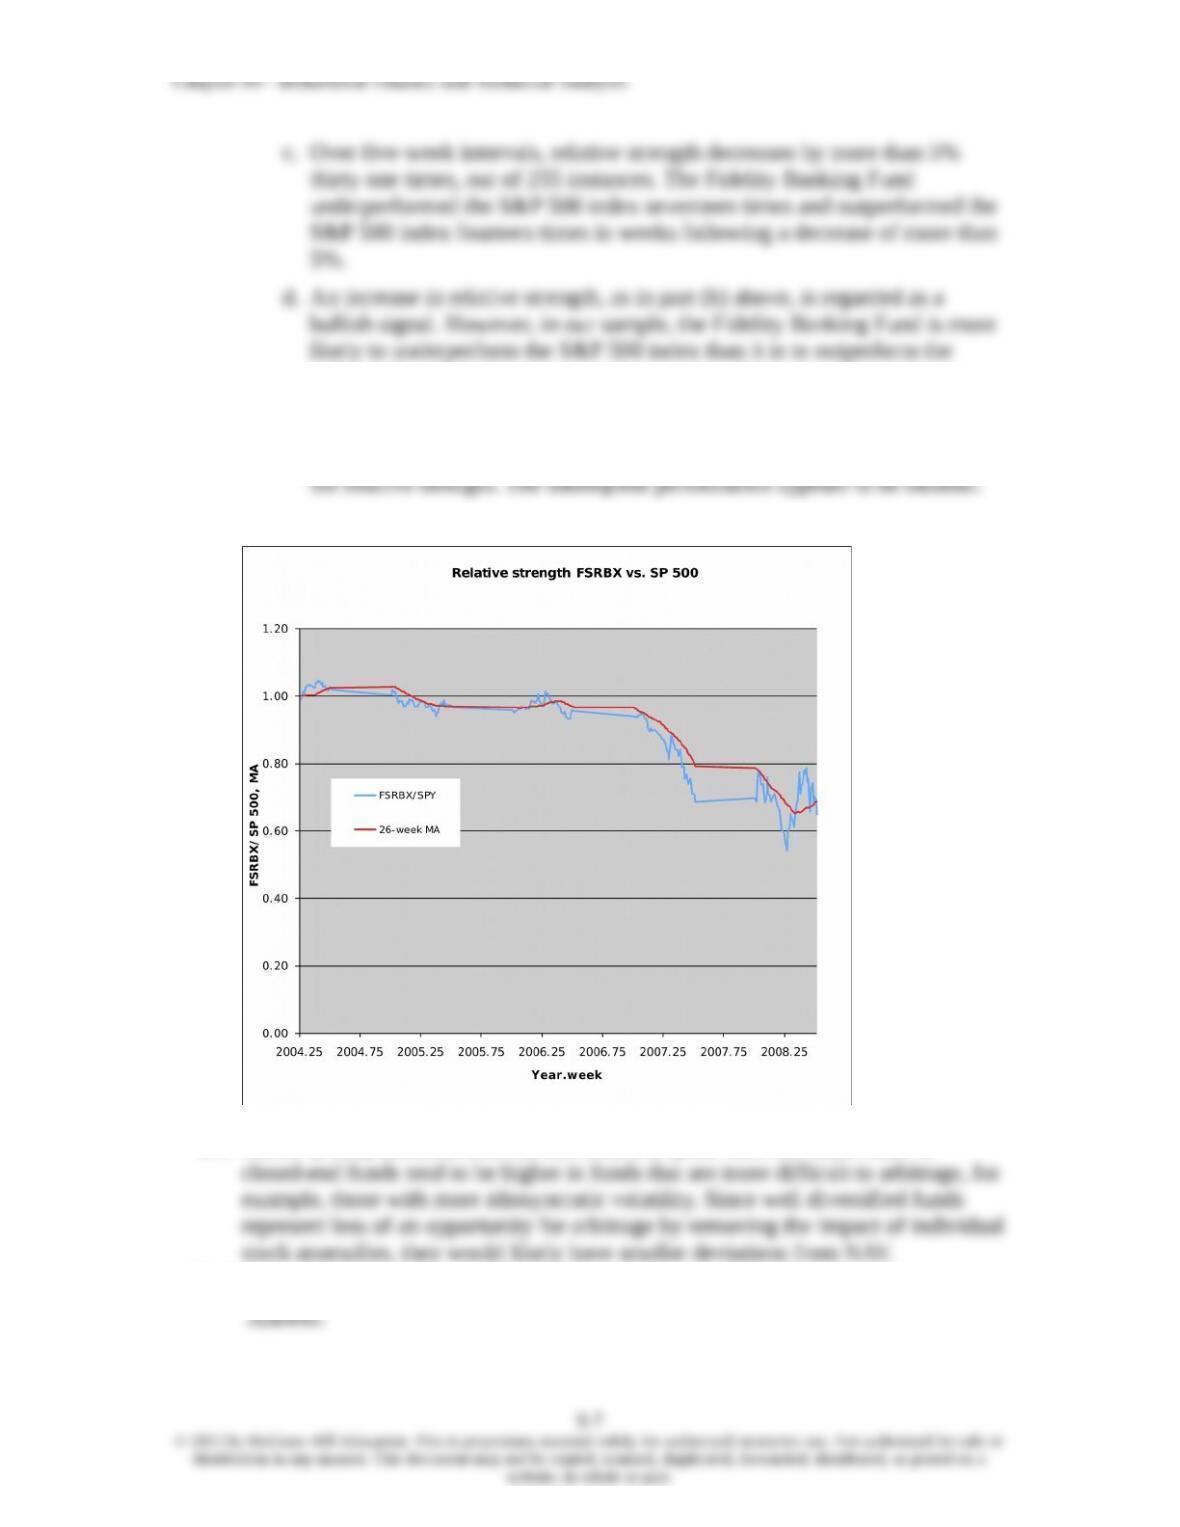
index following such a signal. A decrease in relative strength, as in part
(c), is regarded as a bearish signal. In our sample, the Fidelity Banking
Fund underperformed the index as expected. However, there is no
statistical difference in the performance following a substantial change in
CFA 1

Chapter 09 – Behavioral Finance and Technical Analysis

Chapter 09 – Behavioral Finance and Technical Analysis

Chapter 09 – Behavioral Finance and Technical Analysis
CFA 5
9-10
website, in whole or part.