1. Find three points on the efficient frontier corresponding to three different expected
returns.
First select the correct tab, and scroll down to the Portfolio Efficient Frontier
[Select Tab “International Port”]
In the chart “Porfolio Efficient Frontier,” search for the blue line—the efficient frontier.
[Select Chart “Portfolio Efficient Frontier; Move Pointer over three points along the blue
efficient frontier, record risk (horizontal axis) and return (vertical axis)]
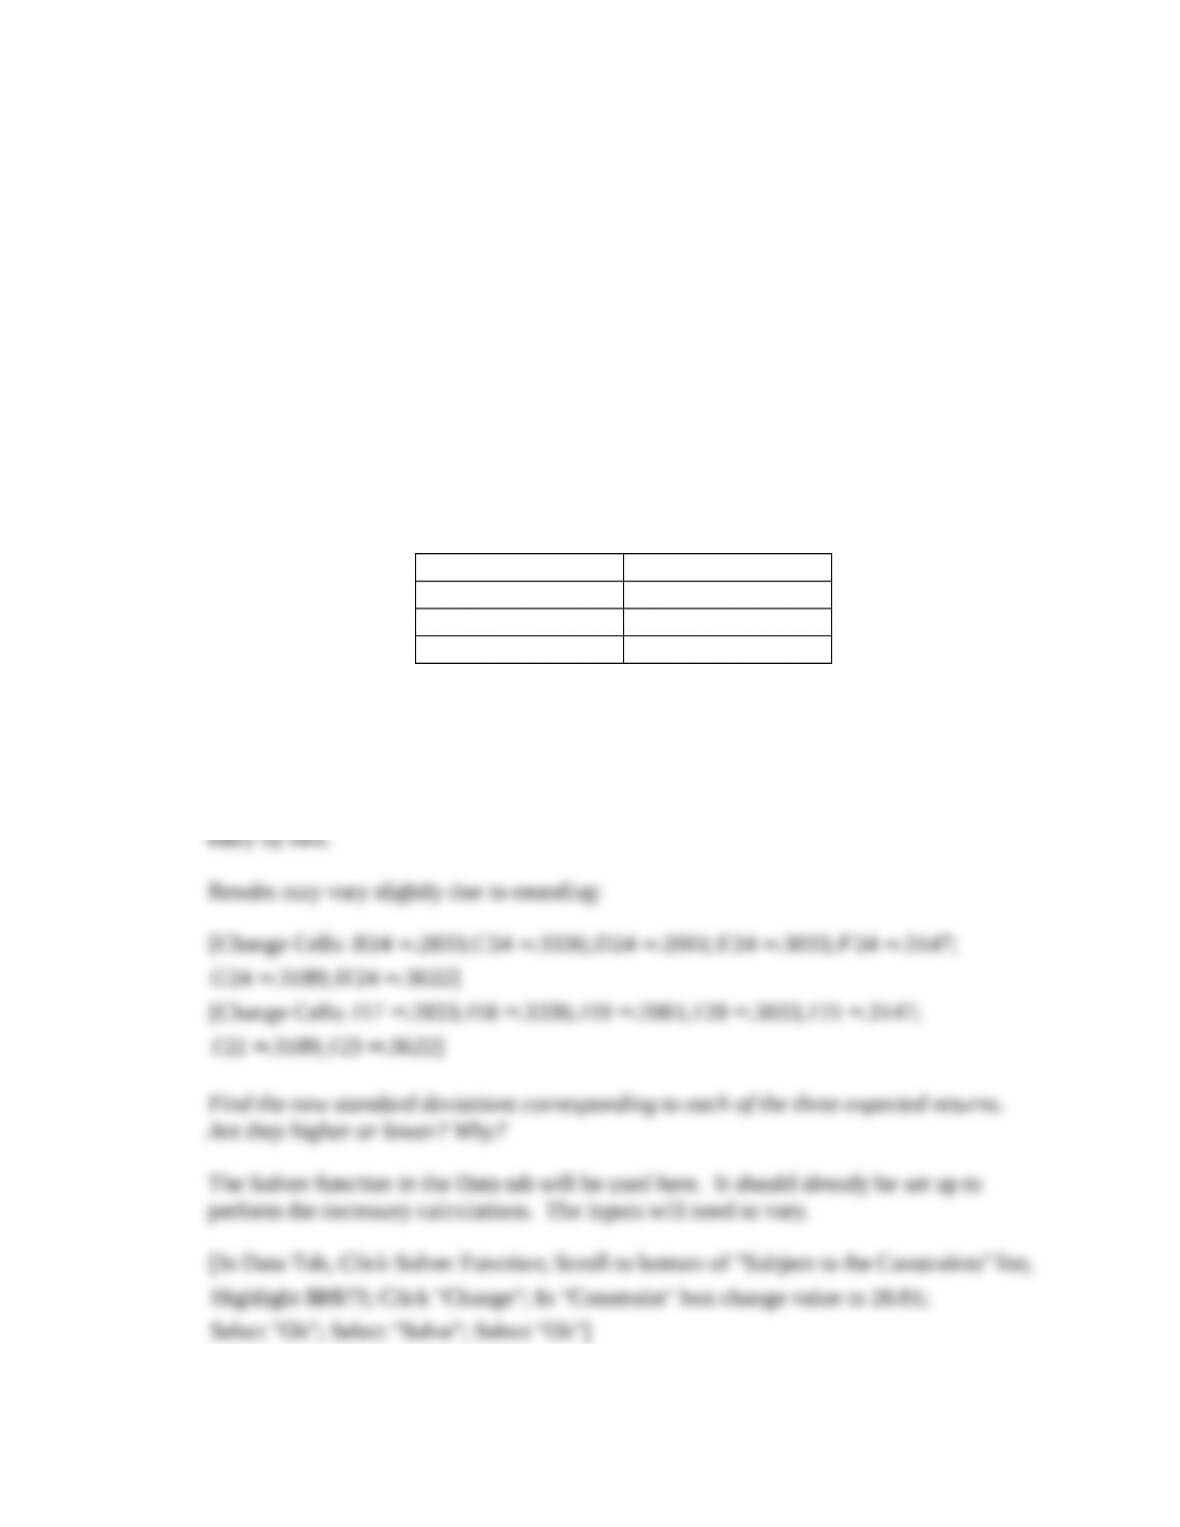
What are the portfolio standard deviations corresponding to each expected return?
For example:
Standard Deviation Return
26.60% 26.10%
21.19% 24.00%
16.46% 18.00%
2. Now assume that the correlation between the S&P 500 and the other country indexes is
cut in half.
In the correlation matrix (cells B17:I24, still in the International Port tab), the S&P500
row (B24:I24) and the S&P column (I17:I24) will need to be updated by divided each
[In Data Tab, Click Solver Function; Scroll to bottom of “Subject to the Constraints” list;
Highlight $B$73; Click “Change”; In “Constraint” box change value to 24;
Select “Ok”; Select “Solve“; Select “Ok”]
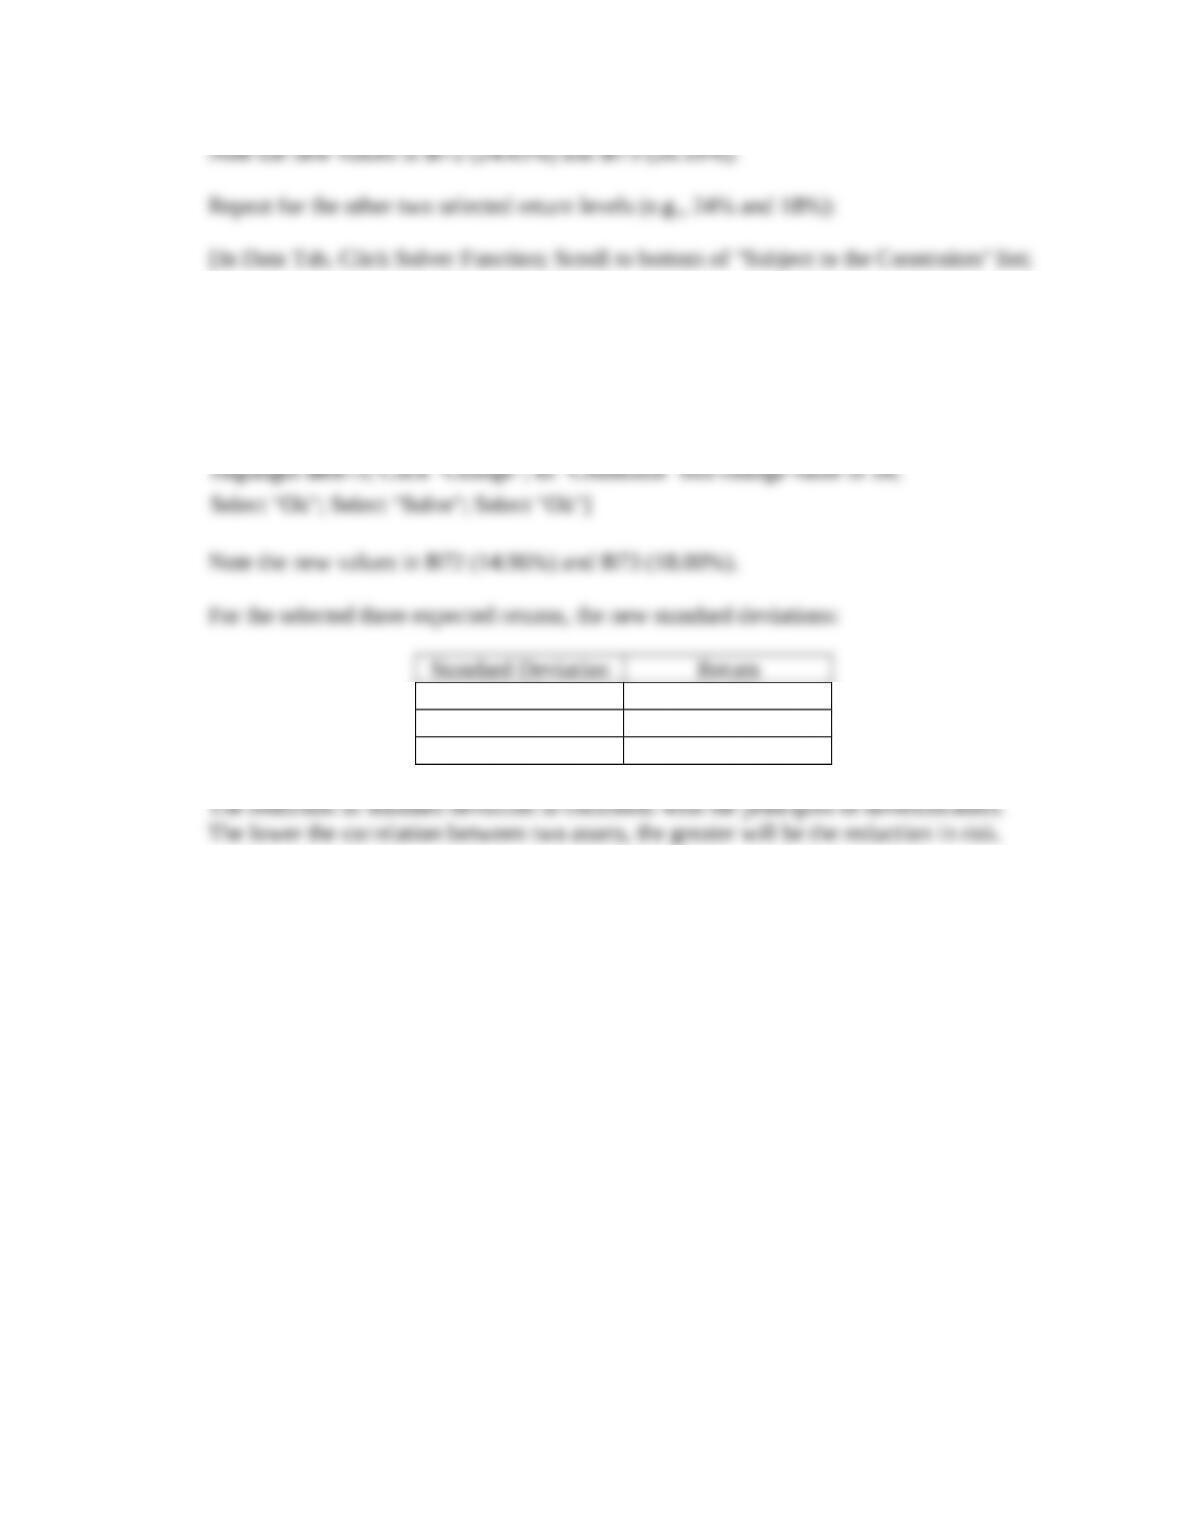
Note the new values in B72 (20.32%) and B73 (24.00%).
[In Data Tab, Click Solver Function; Scroll to bottom of “Subject to the Constraints” list;
Highlight $B$73; Click “Change”; In “Constraint” box change value to 18;
Select “Ok”; Select “Solve“; Select “Ok”]
24.65% 26.10%
20.32% 24.00%
14.96% 18.00%