Unlock document.
This document is partially blurred.
Unlock all pages and 1 million more documents.
Get Access
Chapter 05: Operating and Financial Leverage
5-48
e. What would be the required new funds if the company brings its ratios into line with
the industry average during 2011? Specifically examine receivables turnover,
inventory turnover, and the profit margin. Use the new values to recompute the
factors in RNF (assume liabilities stay the same).
f. Do not calculate, only comment on these questions. How would required new funds
change if the company:
(1) Were at full capacity?
(2) Raised the dividend payout ratio?
(3) Suffered a decreased growth in sales?
(4) Faced an accelerated inflation rate?
CP 5-1. Solution:
Ryan Boot Company
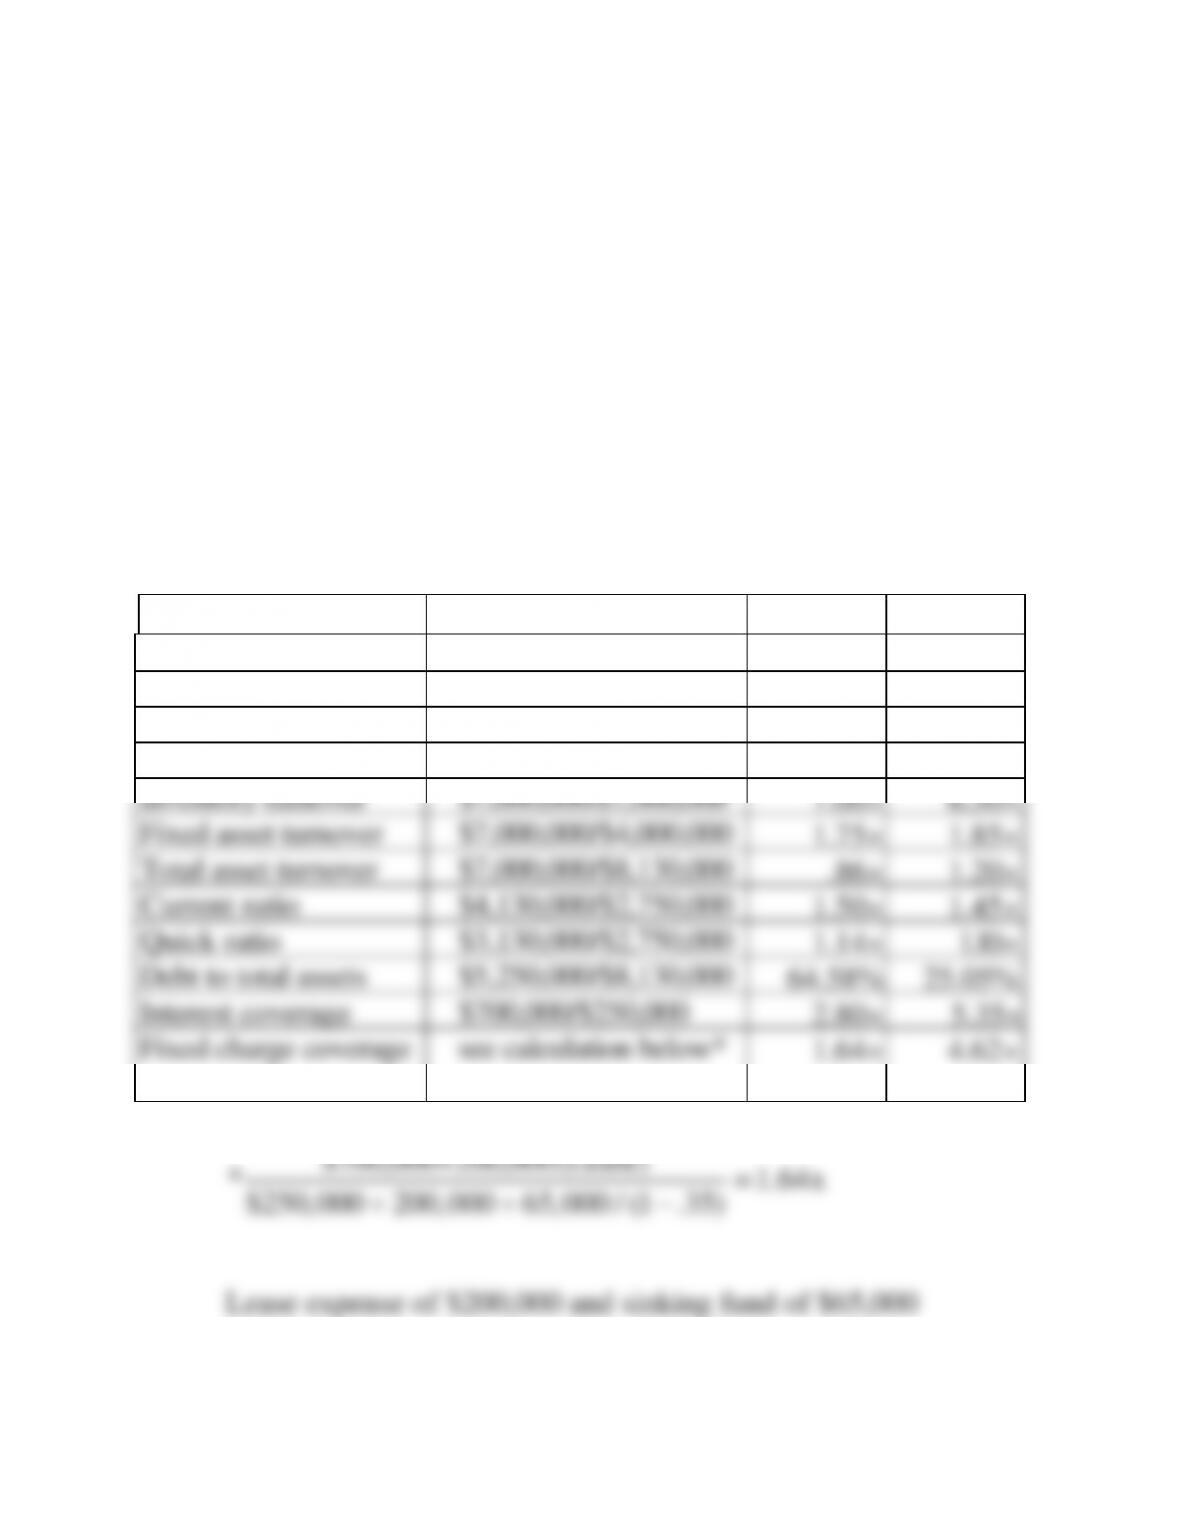
a. Ratio analysis
Ryan
Industry
Profit margin
$292,500/$7,000,000
4.18%
5.75%
Return on assets
$292,500/$8,130,000
3.60%
6.90%
Return on equity
$292,500/$2,880,000
10.16%
9.20%
Receivable turnover
$7,000,000/$3,000,000
2.33
4.35
Inventory turnover
$7,000,000/$1,000,000
7.00
6.50
Fixed asset turnover
$7,000,000/$4,000,000
1.75
1.85
Total asset turnover
$7,000,000/$8,130,000
.86
1.20
Current ratio
$4,130,000/$2,750,000
1.50
1.45
Quick ratio
$3,130,000/$2,750,000
1.14
l.l0
Debt to total assets
$5,250,000/$8,130,000
64.58
25.05
Interest coverage
$700,000/$250,000
2.80
5.35
Fixed charge coverage
see calculation below*
1.64
4.62
$700,000+200,000(Lease)
* 1.64x
$250,000 200,000 65,000 / (1 .35) =
+ + −
Lease expense of $200,000 and sinking fund of $65,000
Chapter 05: Operating and Financial Leverage
5-49
a. The company has a lower profit margin than the industry and
the problem is further compounded by the slow turnover of
assets (.86x versus an industry norm of 1.20x). This leads to
a much lower return on assets. The company has a higher
return on equity than the industry, but this is accomplished
through the firm's heavy debt ratio rather than through
superior profitability.
b. Break-even in sales
Sales Fixed Costs Variable costs=+
(variable costs are expressed as a percentage of sales)
BE
Sales $2,100,000 .60 Sales
.40 S $2,100,000
S $2,100,000 /.40
S $5,250,000
=+
=
=
=
Chapter 05: Operating and Financial Leverage
Cash break-even
Sales (Fixed costs Non cash expenses*) +Variable costs=−
BE
BE
Sales ($2,100,000 $500,000) + .60 Sales
Sales $1,600,000 .60 Sales
.40 S $1,600,000
S $1,600,000 /.40
S $4,000,000
=−
=+
=
=
=
*Depreciation
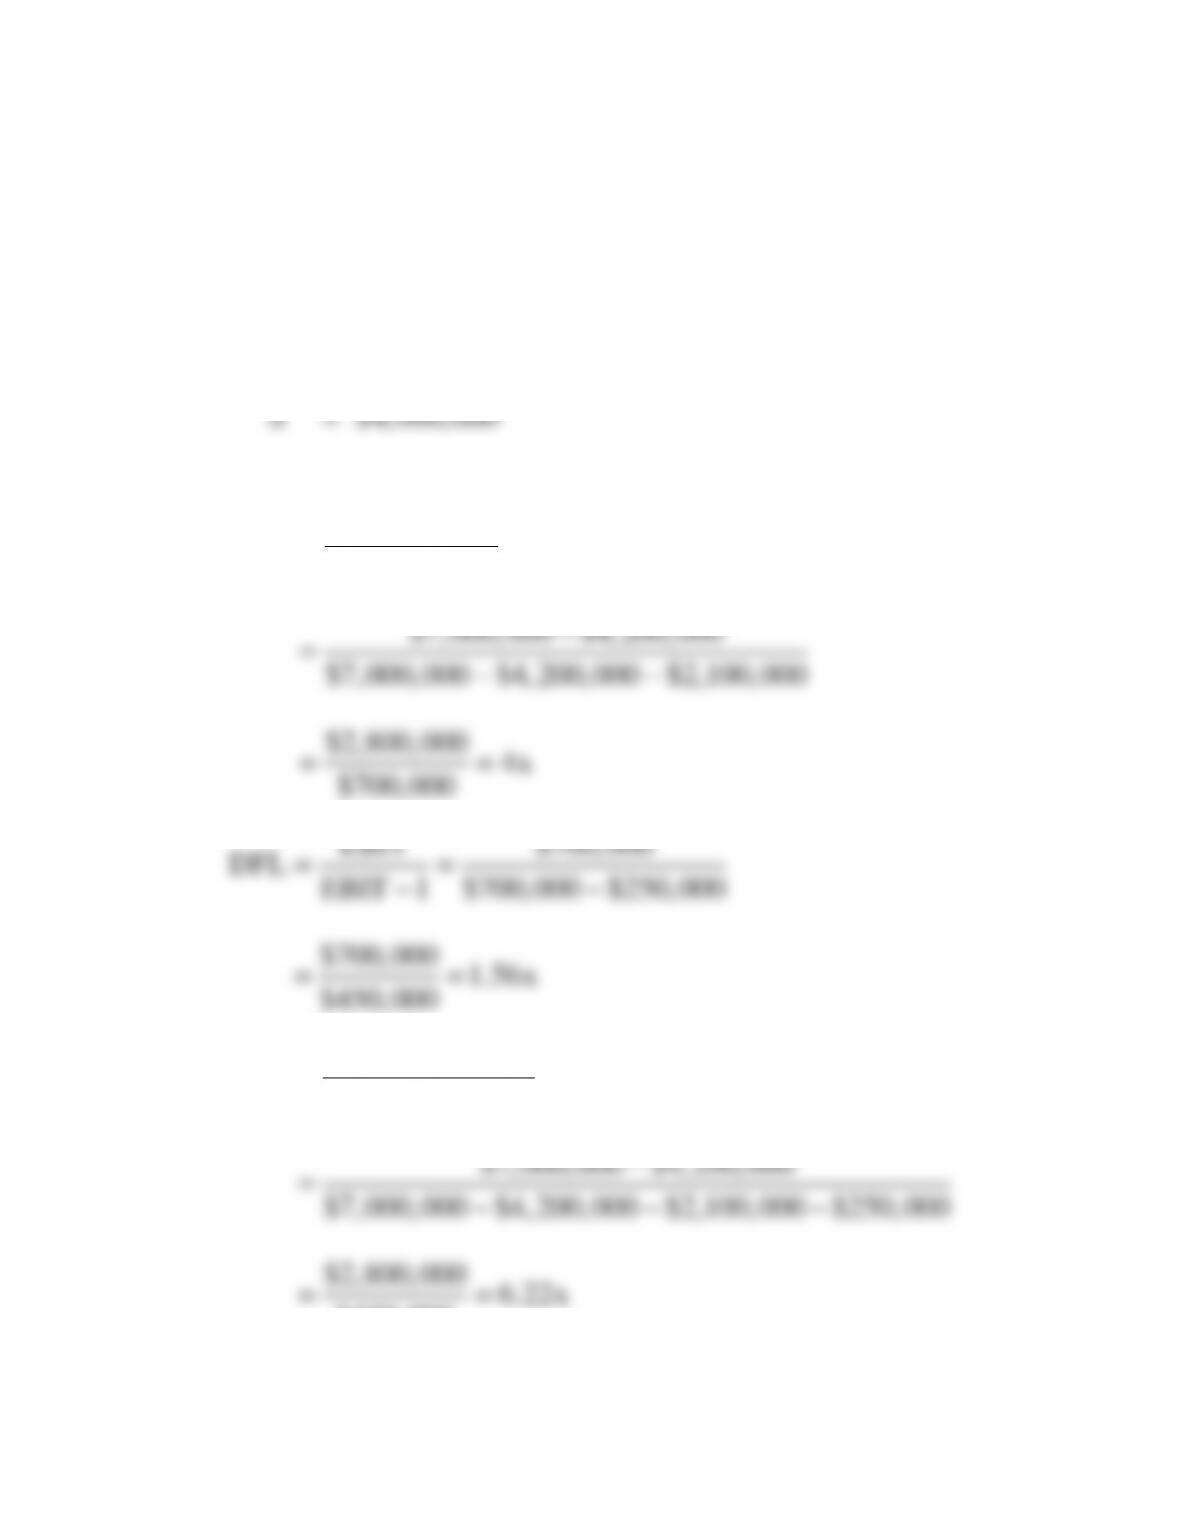
S TVC
DOL S TVC FC
$7,000,000 $4,200,000
$7,000,000 $4,200,000 $2,100,000
$2,800,000 4x
$700,000
−
=−−
−
=−−
==
EBIT $700,000
DFL EBIT I $700,000 $250,000
$700,000 1.56x
$450,000
==
−−
==
S TVC
DCL S TVC FC I
$7,000,000 $4,200,000
$7,000,000 $4,200,000 $2,100,000 $250,000
$2,800,000 6.22x
$450,000
−
=− − −
−
=− − −
==
Chapter 05: Operating and Financial Leverage
5-51
c. Ryan is operating at a sales volume that is $1,750,000 above
the traditional break-even point and $3,000,000 above the
cash break-even point. This can be viewed as somewhat
positive.
However, the firm has a high degree of leverage, which
indicates any reduction in sales volume could have a very
negative impact on profitability. The DOL of 4x is associated
with heavy fixed assets and relatively high fixed costs. The
so hopefully a large expansion would not take place here.
There appears to be a need to reduce accounts receivable
rather than increase the level.
One possible use of the funds might be to pay off part of the
improve its profitability.
Chapter 05: Operating and Financial Leverage
d.
( ) ( ) ( )
2
AL
Required new funds= S S PS 1 D
SS
− − −
( ) ( )
( )
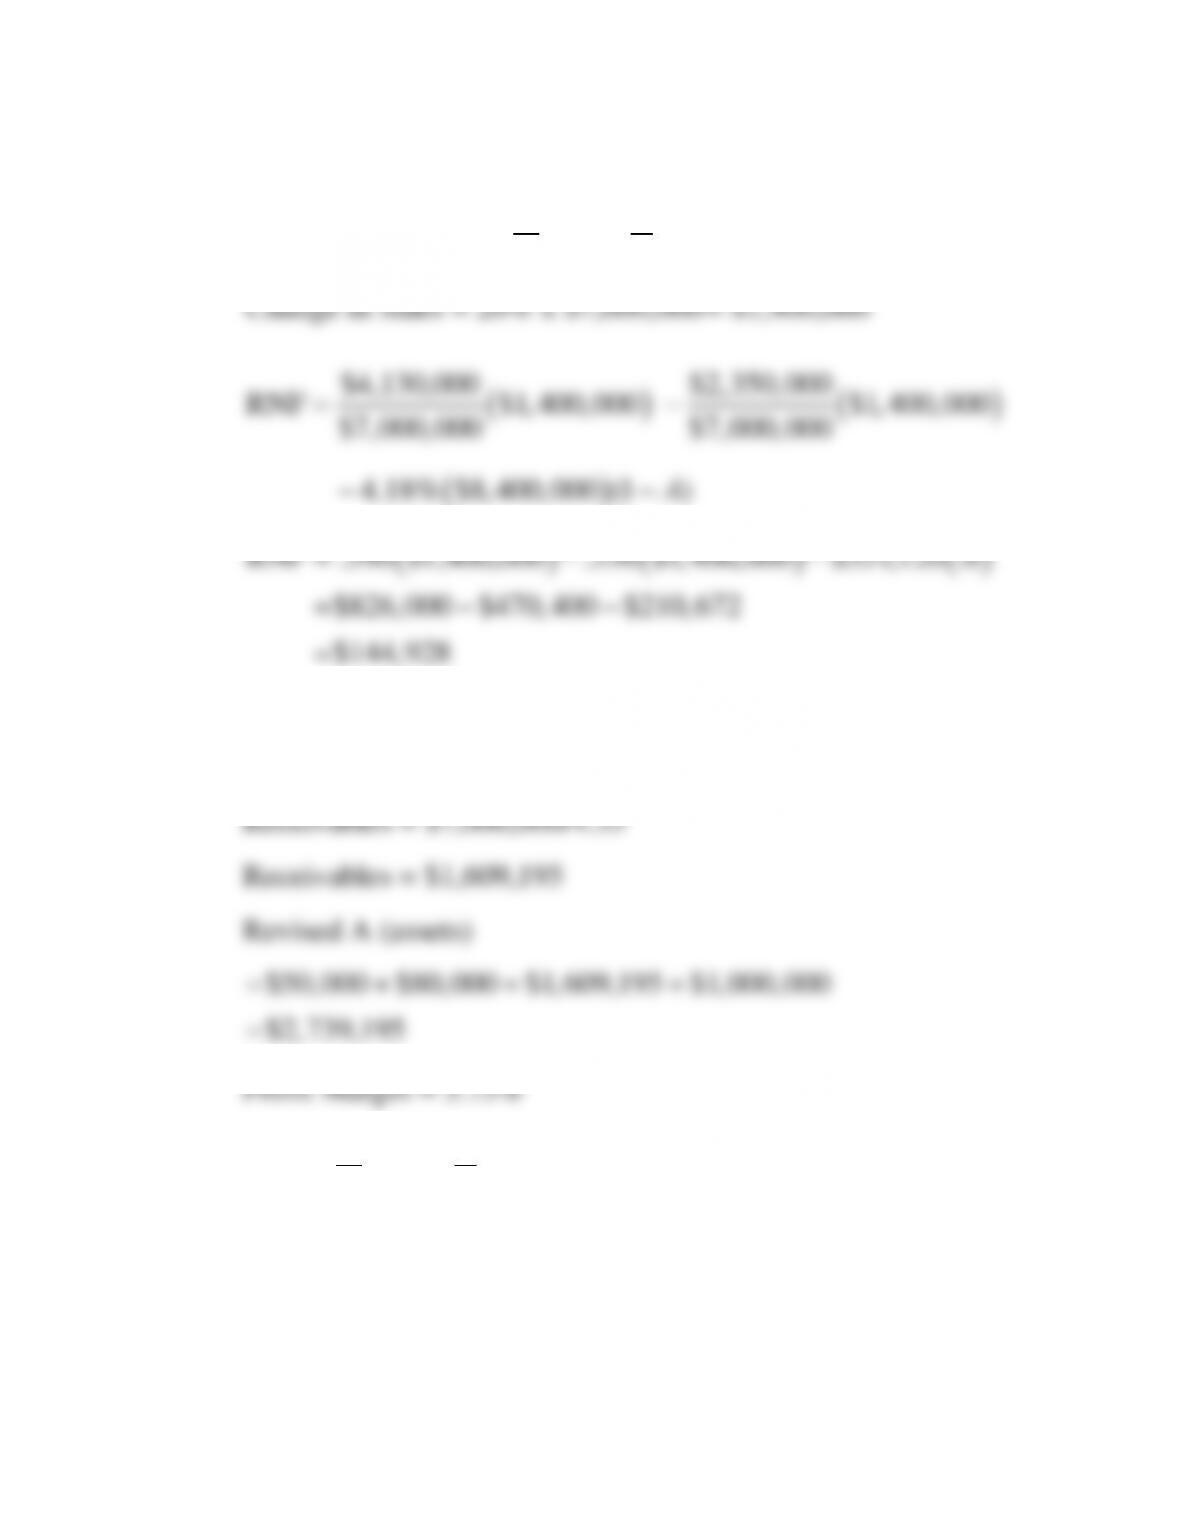
Change in Sales = 20% x $7,000,000= $1,400,000
$4,130,000 $2,350,000
RNF $1,400,000 $1,400,000
$7,000,000 $7,000,000
4.18% $8,400,000 (1 .4)
=−
−−
( ) ( ) ( )
RNF = .590 $1,400,000 .336 $1,400,000 $351,120 .6
$826,000 $470,400 $210,672
$144,928
−−
= − −
=
e. Required funds if selected industry ratios were applied
Receivables = Sales/Receivable turnover
Chapter 05: Operating and Financial Leverage
5-53
( ) ( )
( )( )
$2,739,195 $2,350,000
RNF= $1,400,000 $1,400,000
$7,000,000 $7,000,000
5.75% $8,400,000 1 .4
−
−−
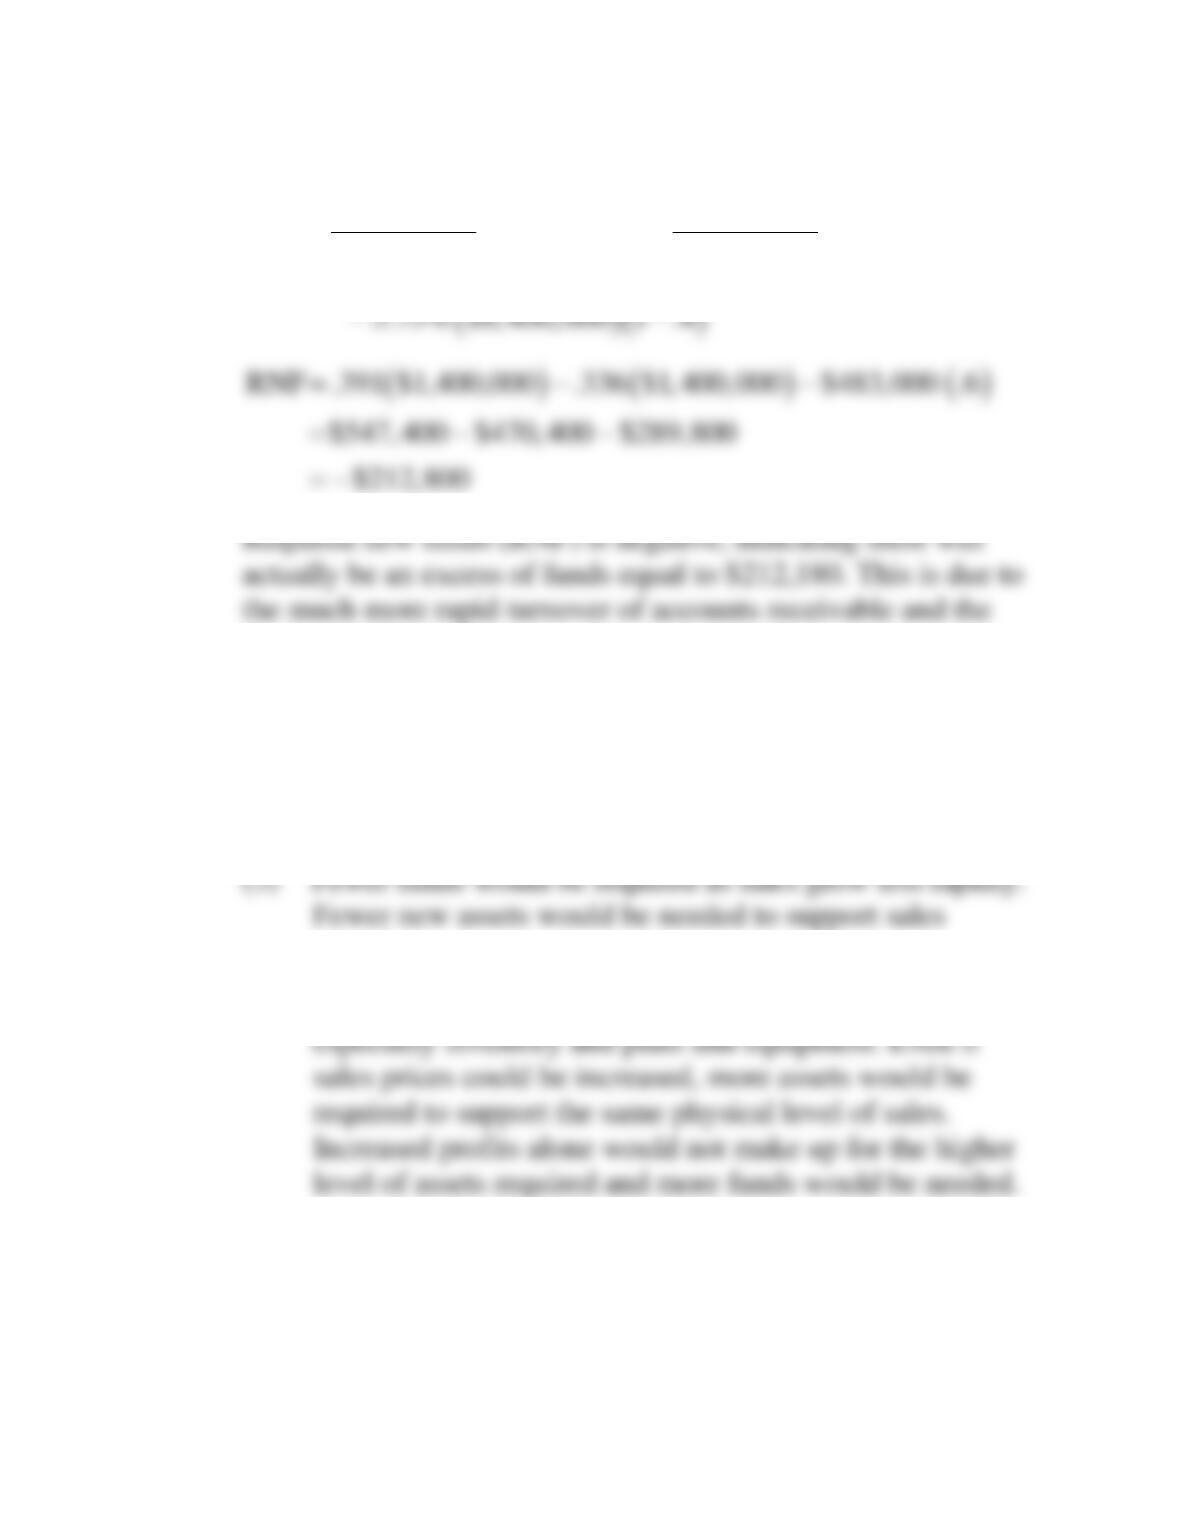
( ) ( ) ( )
RNF .391 $1,400,000 .336 $1,400,000 $483,000 .6
$547,400 $470,400 $289,800
$212,800
= − −
= − −
=−
higher profit margin.
f. (1) If Ryan Boots were at full capacity, more funds would be
needed to expand plant and equipment.
(2) More funds would be needed to offset the larger payout of
earnings to dividends.
growth.
(4) As inflation increased so would the cost of new assets,
Chapter 05: Operating and Financial Leverage
5-54
W E B E X E R C I S E
1. At the start of the chapter, we talked about how risky and volatile airlines' operations were.
Let's examine this further. Go to finance.yahoo.com.
Enter AMR for American Airlines in the "Get Quotes" box. Go to "Company Profile"
along the left-hand margin.
2. Click on profile in the left-hand column and write a one-paragraph description of the
company.
3 Scroll down and click on the "Income Statement." Describe the pattern of change for “Total
Revenue" and "Net Income from Continuing Operations" in one paragraph.
4. Next go to the "Balance Sheet." In one sentence, describe the pattern of change in
Stockholders' Equity and indicate whether this does or does not appear to be a matter of
concern.
5. Click on "Analyst Estimates." Do AMR's earnings estimates appear to be more or less
promising for the future?
6. Finally, click on "Competitors." How does AMR compare to the other airlines and the
industry in terms of Operating Margin?
Note: Occasionally a topic we have listed may have been deleted, updated, or moved into a different location on a
Web site. If you click on the site map or site index, you will be introduced to a table of contents which should aid
you in finding the topic you are looking for.


