
Chapter 04: Financial Forecasting
4-41
COMPREHENSIVE PROBLEM
Comprehensive Problem 1.
Mansfield Corporation (external funds requirement) (LO4) Mansfield Corporation had 2010
sales of $100 million. The balance sheet items that vary directly with sales and the profit margin
are as follows:
Percent
Cash ……………………………………………………..
5%
Accounts receivable ………………………………..………..
15
Inventory ……………………………………………………….
20
Net fixed assets ………………………………………………..
40
Accounts payable……………………………………………..
15
Accruals ……………………………………………….………
10
Profit margin after taxes…………………………..………..
10%
The dividend payout rate is 50 percent of earnings, and the balance in retained earnings
at the end of 2010 was $33 million. Notes payable are currently $7 million. Long-term
bonds and common stock are constant at $5 million and $10 million, respectively.
a. How much additional external capital will be required for next year if sales increase
15 percent? (Assume that the company is already operating at full capacity.)
b. What will happen to external fund requirements if Mansfield Corporation reduces the
payout ratio, grows at a slower rate, or suffers a decline in its profit margin? Discuss
each of these separately.
c. Prepare a pro forma balance sheet for 2011 assuming that any external funds being
acquired will be in the form of notes payable. Disregard the information in part b in
answering this question (that is, use the original information and part a in constructing
your pro forma balance sheet).
Chapter 04: Financial Forecasting
4-42
CP 4-1. Solution:
Mansfield Corporation
Sales .15 $100 million =15 million
Spontaneous assets 5% 15% 20% 40% 80%
Spontaneous liabilities 15% 10% 25%
=
= + + + =
= + =
a.
( ) ( ) ( )
( ) ( ) ( )( )
2
AL
RNF= S S PS 1 D
SS
.8 $15million .25 $15 million .10 $115 1 .5
$12million $3.75million $5.75million
= $2.5 million
− − −
= − − −
= − −
more external funds.
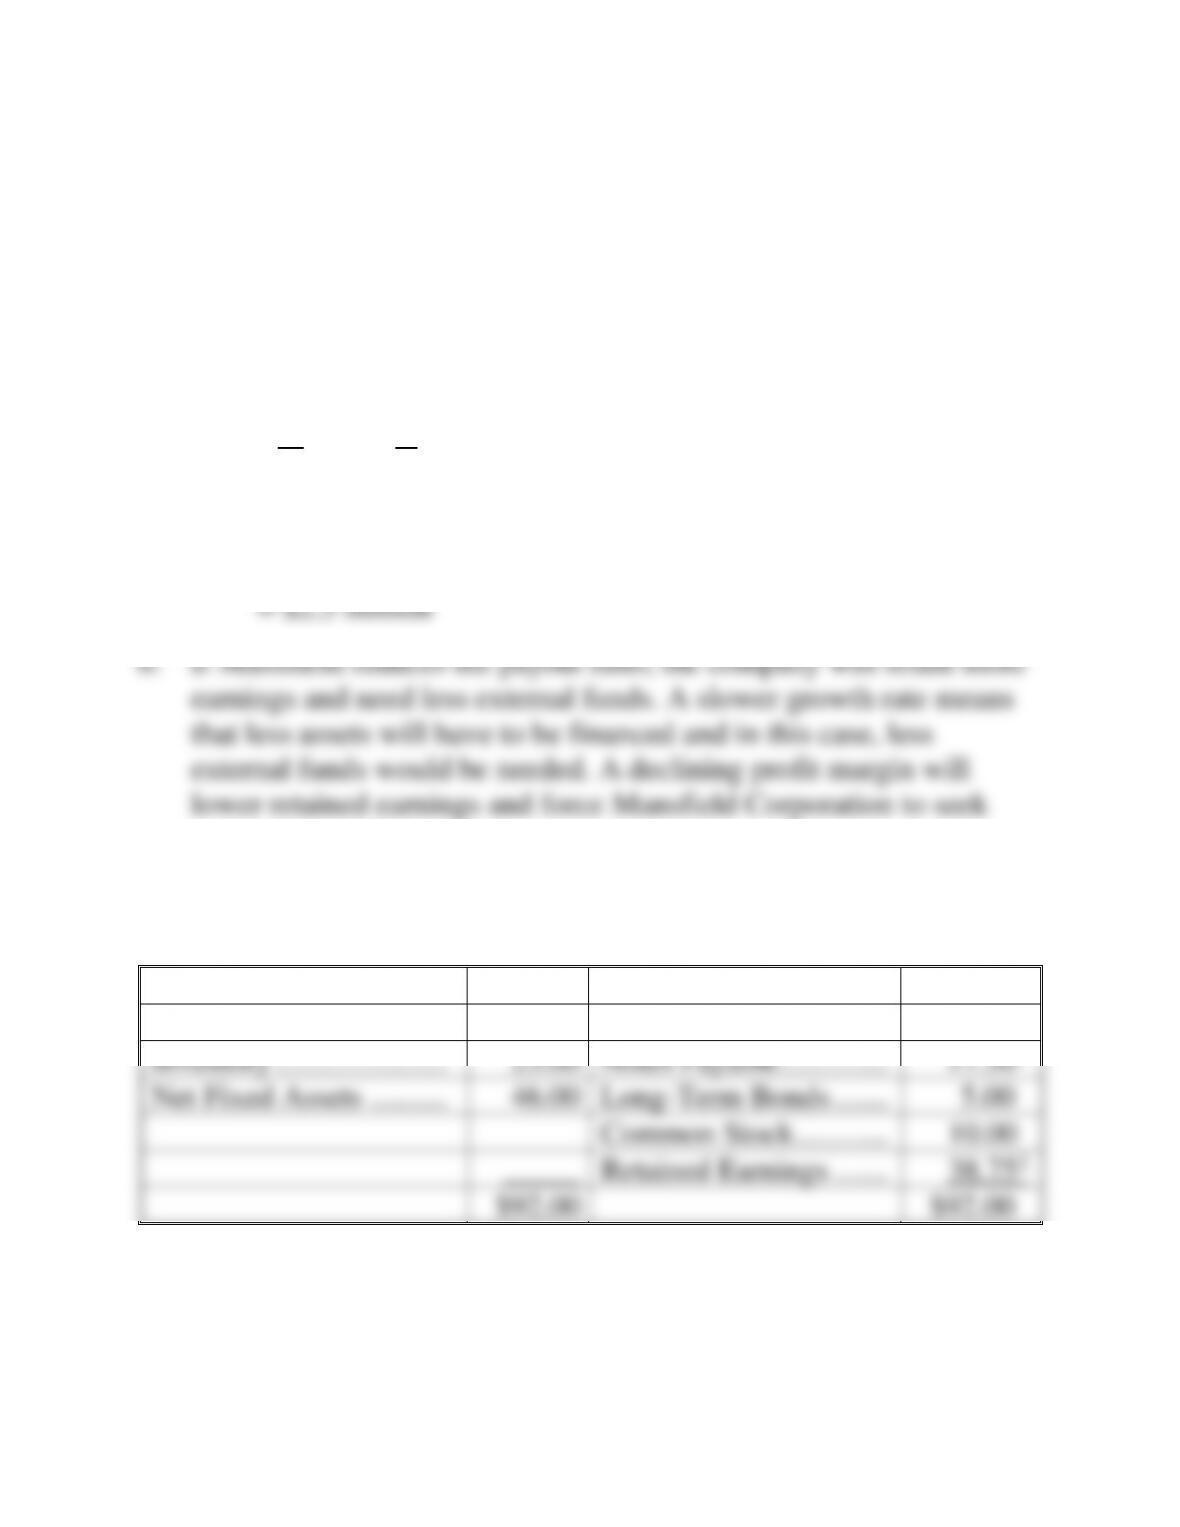
c. Balance Sheet—December 31, 2011
(Dollars in Millions)
Cash ………………………..
$ 5.75
Accounts Payable ……..
$ 17.25
Accounts Receivable ….
17.25
Accruals ………………….
11.50
Inventory ………………….
23.00
Notes Payable …………..
17.501
Net Fixed Assets ……….
46.00
Long-Term Bonds …….
5.00
Common Stock …………
10.00
_____
Retained Earnings …….
38.752
$92.00
$92.00
1 Original notes payable plus required new funds. This is the plug figure.
2 2011 retained earnings (end of 2010) + PS2 (1–D)
Chapter 04: Financial Forecasting
4-43
Comprehensive Problem 2
Marsh Corporation (financial forecasting with seasonal production) (LO5) The difficult part
of solving a problem of this nature is to know what to do with the information contained within a
story problem. Therefore, this problem will be easier to complete if you rely on Chapter 4 for the
format of all required schedules.
The Marsh Corporation makes standard-size 2-inch fasteners, which it sells for $155 per
thousand. Mr. Marsh is the majority owner and manages the inventory and finances of the
company. He estimates sales for the following months to be:
January ……………
$263,500 (1,700,000 fasteners)
February ………….
$186,000 (1,200,000 fasteners)
March……………..
$217,000 (1,400,000 fasteners)
April ………………
$310,000 (2,000,000 fasteners)
May ……………….
$387,500 (2,500,000 fasteners)
Last year Marsh Corporation’s sales were $175,000 in November and $232,500 in
December (1,500,000 fasteners).
Mr. Marsh is preparing for a meeting with his banker to arrange the financing for the
first quarter. Based on his sales forecast and the following information he has provided,
your job as his new financial analyst is to prepare a monthly cash budget, monthly and
quarterly pro forma income statements, a pro forma quarterly balance sheet, and all
necessary supporting schedules for the first quarter.
Past history shows that Marsh Corporation collects 50 percent of its accounts receivable
in the normal 30-day credit period (the month after the sale) and the other 50 percent in 60
days (two months after the sale). It pays for its materials 30 days after receipt. In general,
Mr. Marsh likes to keep a two-month supply of inventory in anticipation of sales. Inventory
at the beginning of December was 2,600,000 units. (This was not equal to his desired two–
month supply.)
The major cost of production is the purchase of raw materials in the form of steel rods,
which are cut, threaded, and finished. Last year raw material costs were $52 per 1,000
fasteners, but Mr. Marsh has just been notified that material costs have risen, effective
January 1, to $60 per 1,000 fasteners. The Marsh Corporation uses FIFO inventory
accounting. Labor costs are relatively constant at $20 per thousand fasteners, since workers
are paid on a piecework basis. Overhead is allocated at $10 per thousand units, and selling
and administrative expense is 20 percent of sales. Labor expense and overhead are direct
cash outflows paid in the month incurred, while interest and taxes are paid quarterly.
The corporation usually maintains a minimum cash balance of $25,000, and it puts its
excess cash into marketable securities. The average tax rate is 40 percent, and Mr. Marsh
usually pays out 50 percent of net income in dividends to stockholders. Marketable
securities are sold before funds are borrowed when a cash shortage is faced. Ignore the
interest on any short-term borrowings. Interest on the long-term debt is paid in March, as
are taxes and dividends.

Chapter 04: Financial Forecasting
4-44
As of year-end, the Marsh Corporation balance sheet was as follows:
MARSH CORPORATION
Balance Sheet
December 31, 201X
Assets
Current assets:
Cash ……………………………………………………
$ 30,000
Accounts receivable ………………………………
320,000
Inventory ……………………………………………..
237,800
Total current assets ……………………………..
$ 587,800
Fixed assets:
Plant and equipment ………………………………
1,000,000
Less: Accumulated depreciation ……………
200,000
800,000
Total assets ……………………………………………
$1,387,800
Liabilities and Stockholders’ Equity
Accounts payable ……………………………………
$ 93,600
Notes payable…………………………………………
0
Long-term debt, 8 percent ………………………..
400,000
Common stock ……………………………………….
504,200
Retained earnings ……………………………………
390,000
Total liabilities and stockholders’ equity …….
$1,387,800
Chapter 04: Financial Forecasting
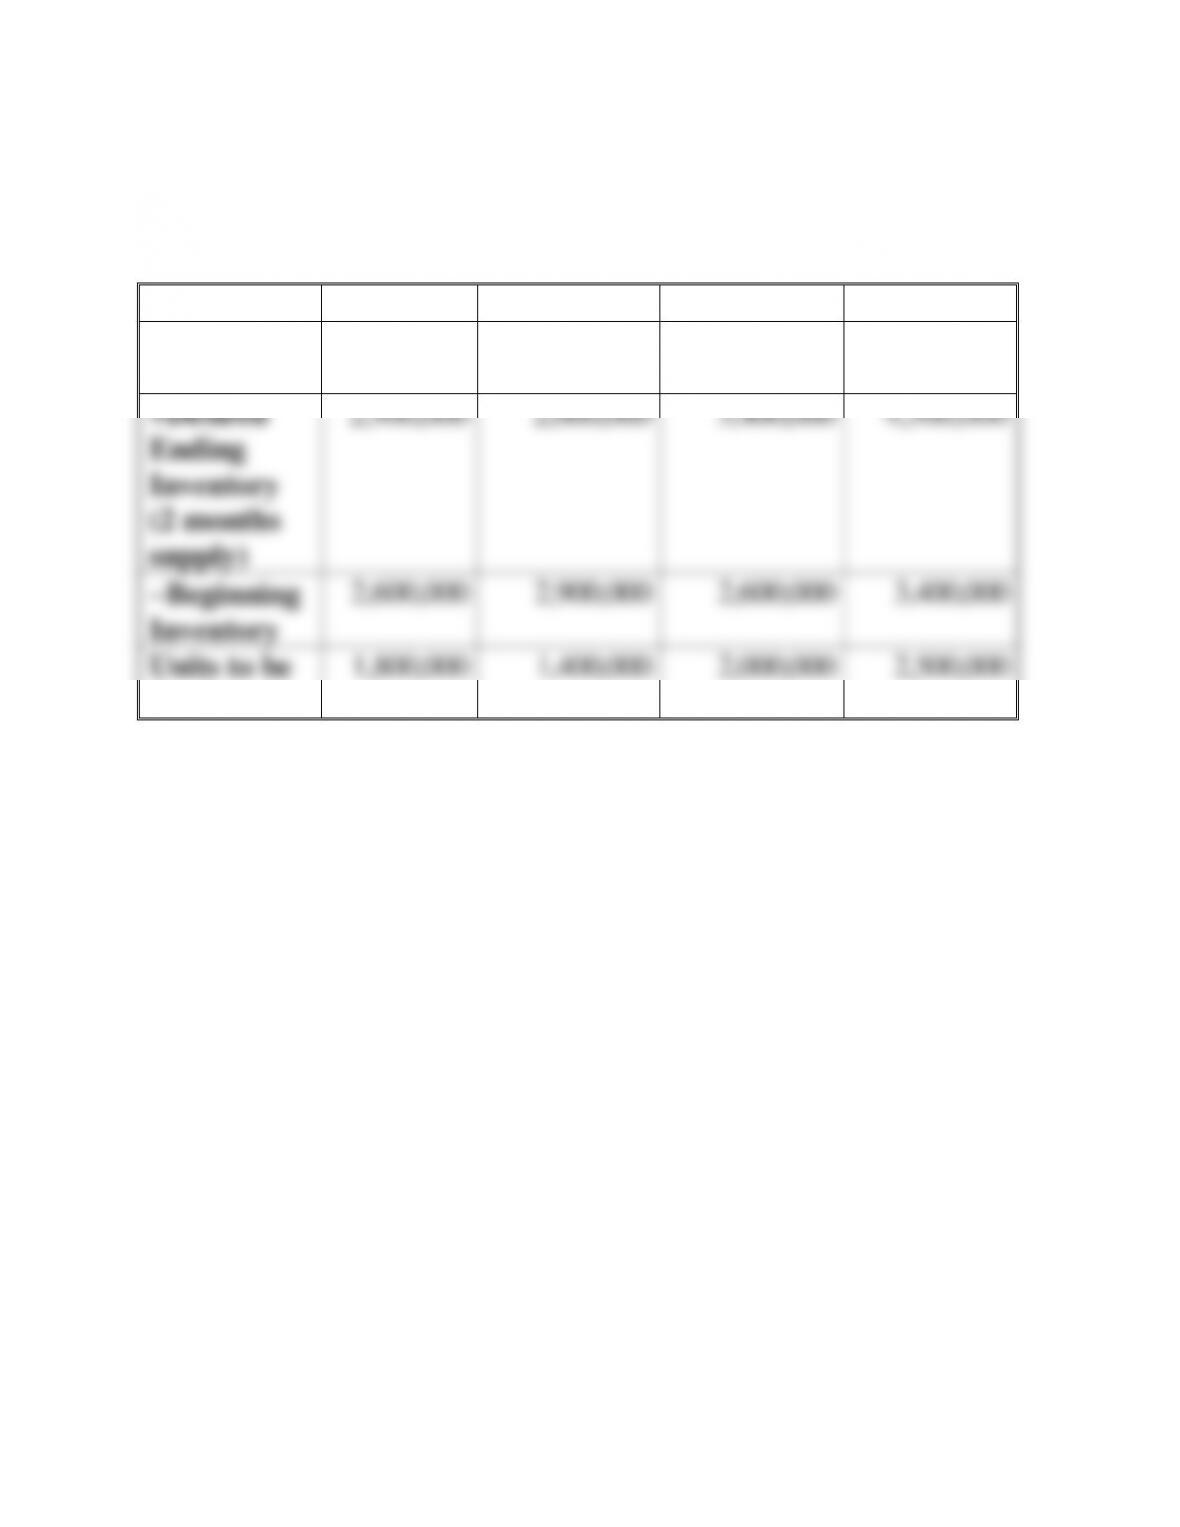
CP 4-2. Solution:
Marsh Corporation
Forecasting with Seasonal Production
Dec.
Jan.
Feb.
Mar.
Projected
Unit Sales
1,500,000
1,700,000
1,200,000
1,400,000
+Desired
Ending
Inventory
(2 months
supply)
2,900,000
2,600,000
3,400,000
4,500,000
−Beginning
Inventory
2,600,000
2,900,000
2,600,000
3,400,000
Units to be
Produced
1,800,000
1,400,000
2,000,000
2,500,000
Chapter 04: Financial Forecasting
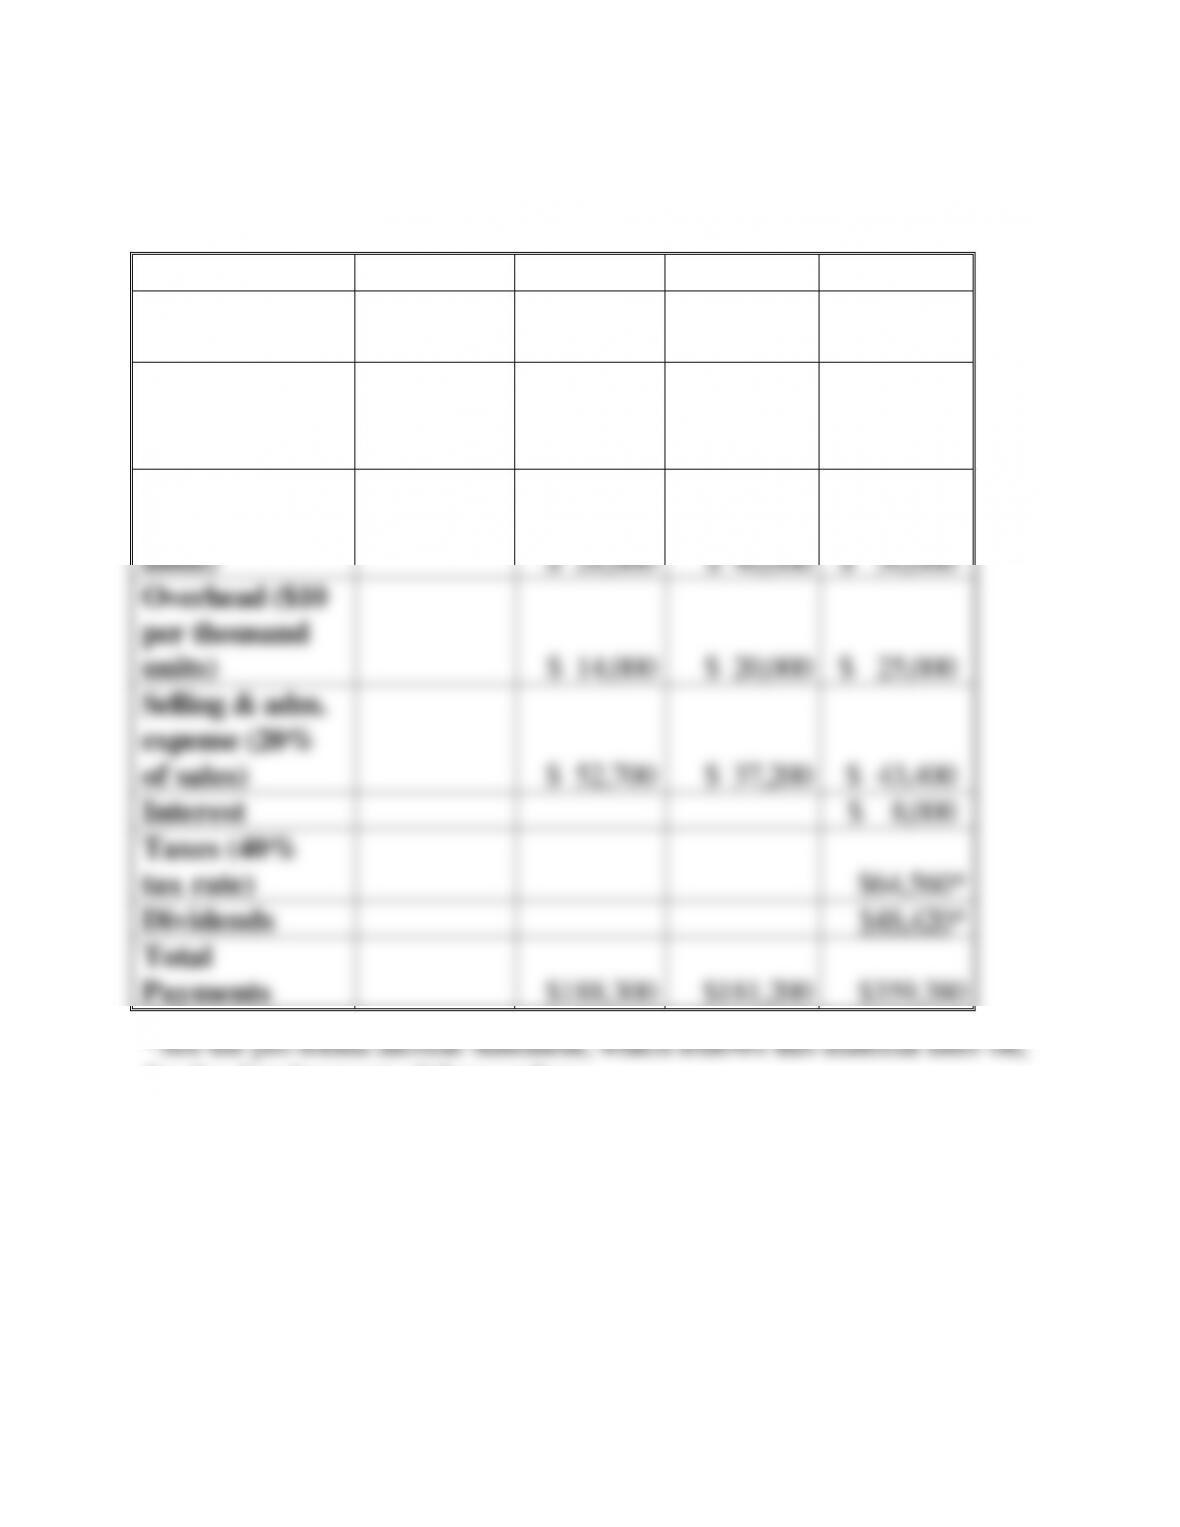
CP 4-2. (Continued)
Monthly Cash Payments
Dec.
Jan.
Feb.
Mar.
Units to be
produced
1,800,000
1,400,000
2,000,000
2,500,000
Materials
(from previous
month)
$ 93,600
$ 84,000
$ 120,000
Labor ($20 per
thousand
units)
$ 28,000
$ 40,000
$ 50,000
Overhead ($10
per thousand
units)
$ 14,000
$ 20,000
$ 25,000
Selling & adm.
expense (20%
of sales)
$ 52,700
$ 37,200
$ 43,400
Interest
$ 8,000
Taxes (40%
tax rate)
$64,560*
Dividends
$48,420*
Total
Payments
$188,300
$181,200
$359,380
for the development of these values.
Chapter 04: Financial Forecasting
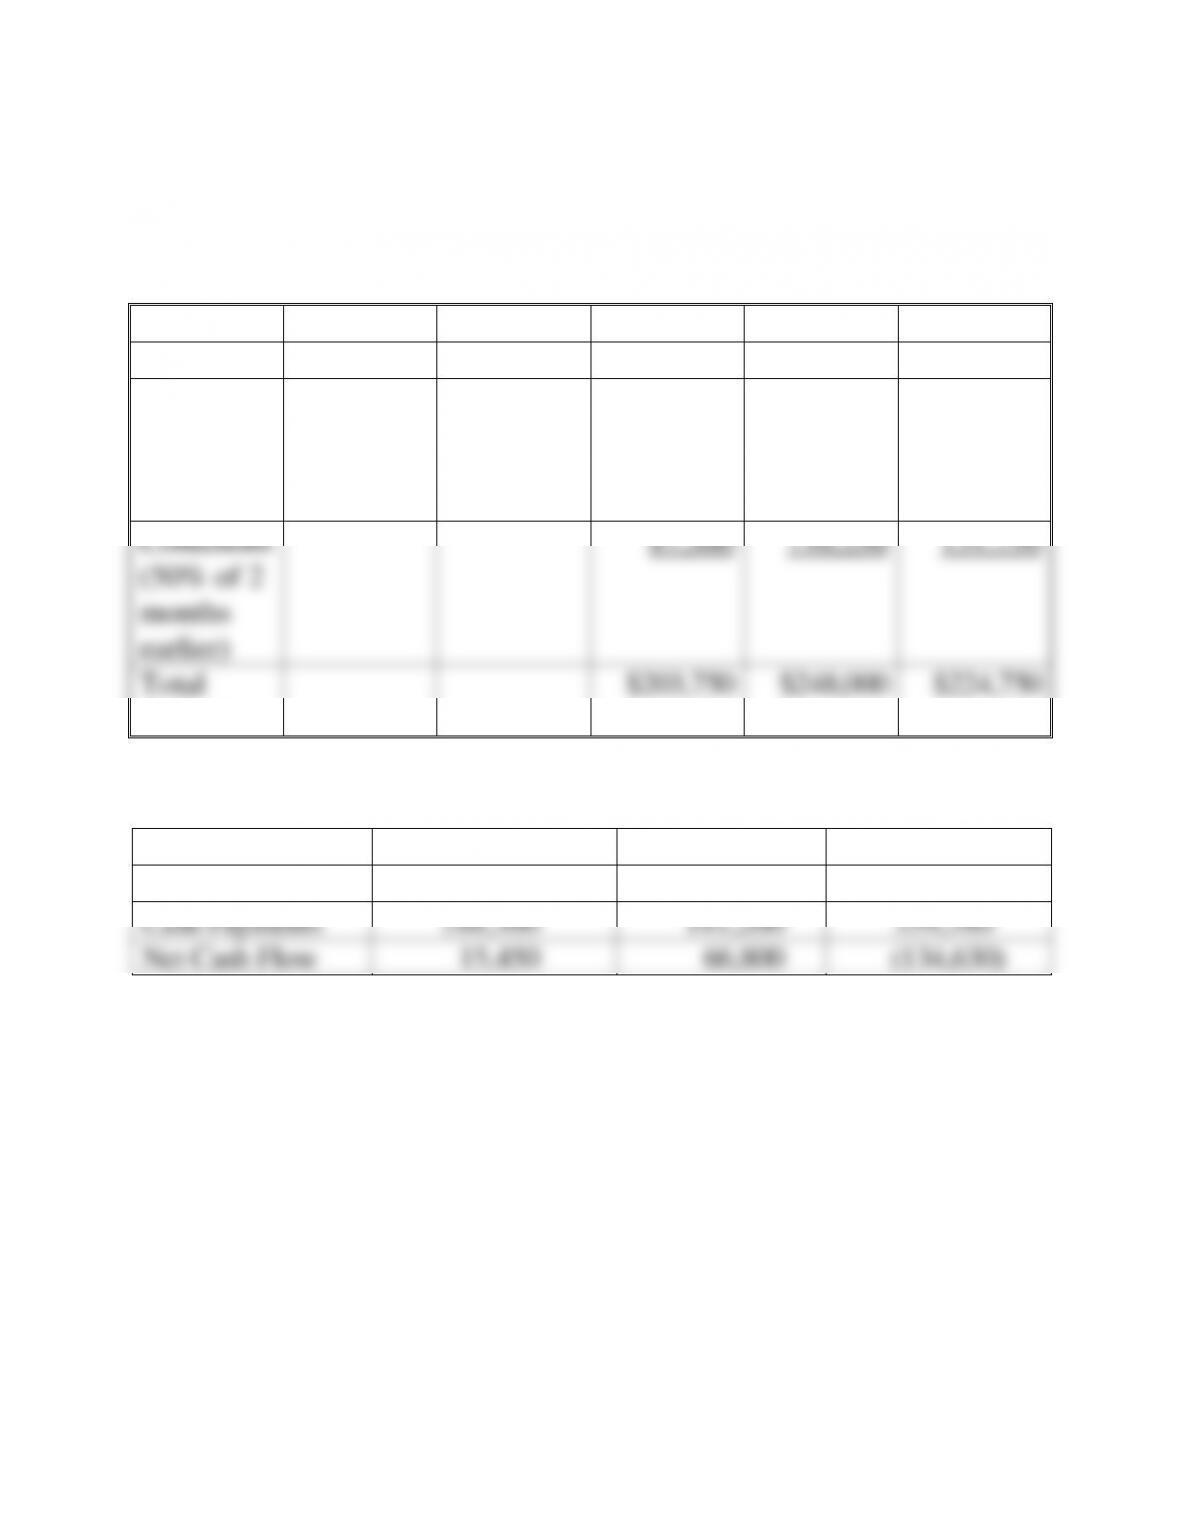
CP 4-2. (Continued)
Marsh Corporation
Monthly Cash Receipts
Nov.
Dec.
Jan.
Feb.
Mar.
Sales
$175,000
$232,500
$263,500
$186,000
$217,000
Collections
(50% of
Previous
month)
87,500
116,250
131,750
93,000
Collections
(50% of 2
months
earlier)
87,500
116,250
131,750
Total
Collections
$203,750
$248,000
$224,750
Monthly Cash Flow
January
February
March
Cash Receipts
$203,750
$248,000
$224,750
Cash Payments
188,300
181,200
359,380
Net Cash Flow
15,450
66,800
(134,630)
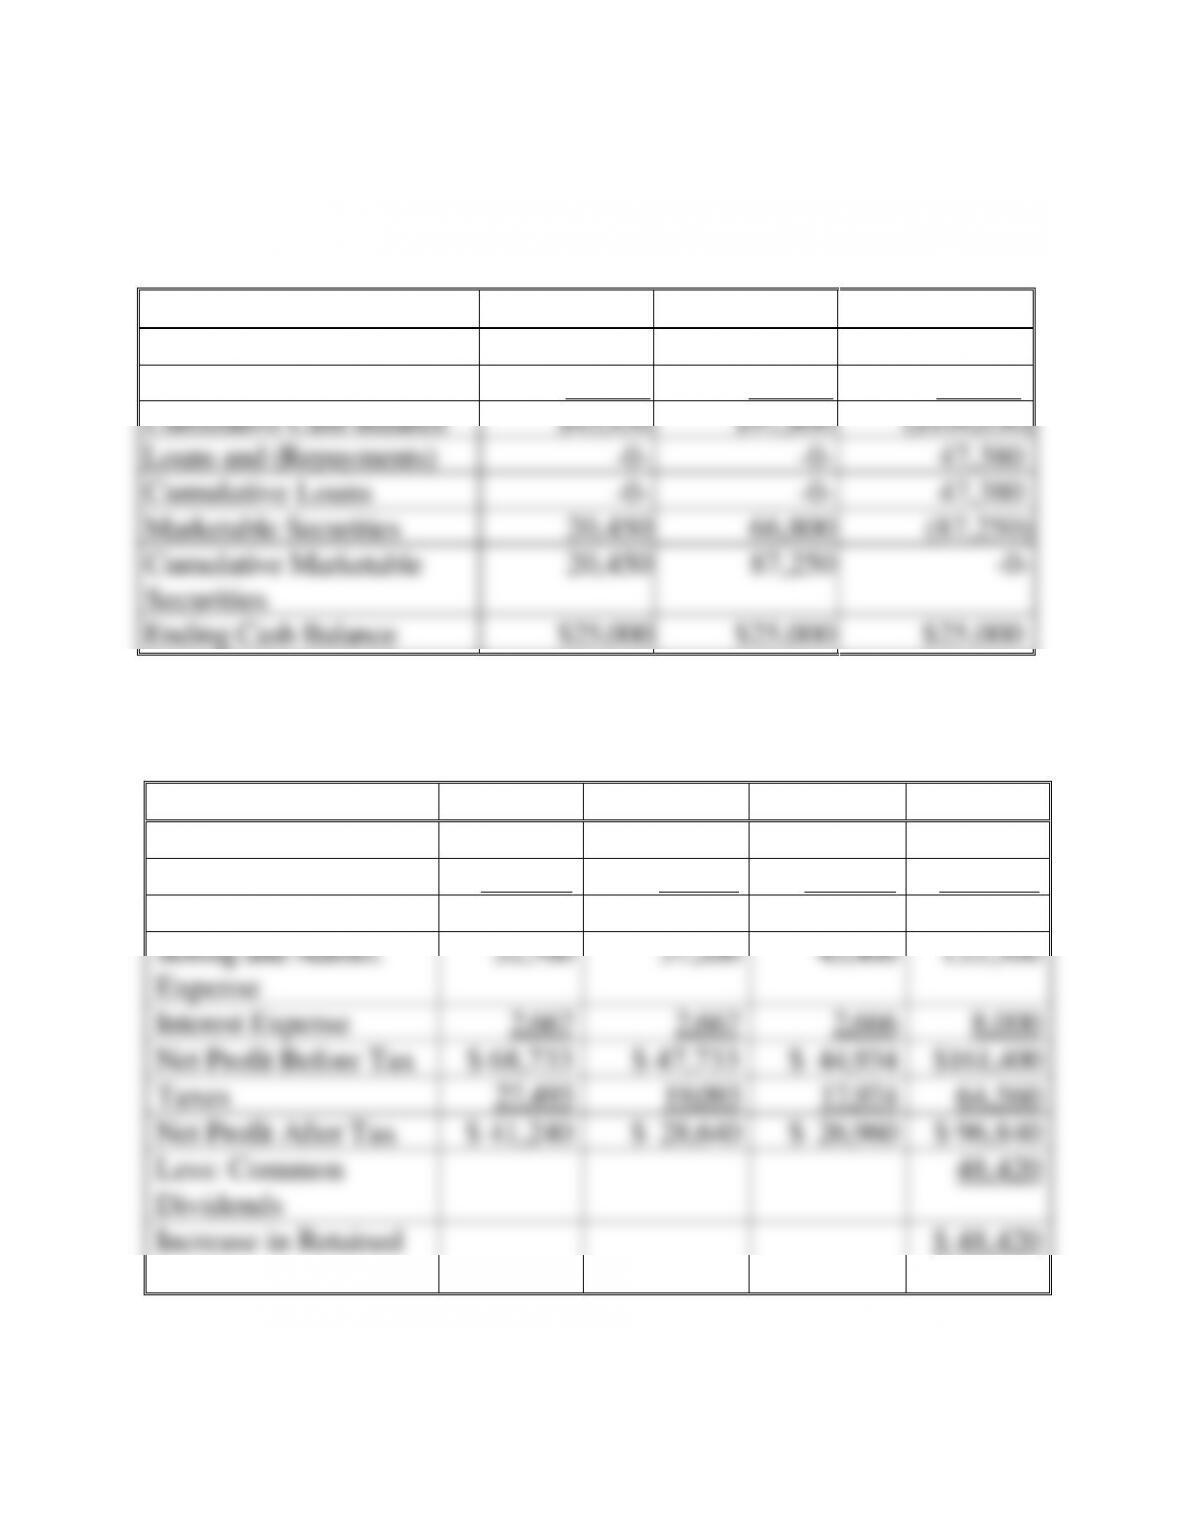
Chapter 04: Financial Forecasting
4-48
CP 4-2. (Continued)
Marsh Corporation
Cash Budget
January
February
March
Net Cash Flow
$15,450
$66,800
$(134,630)
Beginning Cash Balance
30,000
25,000
25,000
Cumulative Cash Balance
$45,450
$91,800
($109,630)
Loans and (Repayments)
-0-
-0-
47,380
Cumulative Loans
-0-
-0-
47,380
Marketable Securities
20,450
66,800
(87,250)
Cumulative Marketable
Securities
20,450
87,250
-0-
Ending Cash Balance
$25,000
$25,000
$25,000
Marsh Corporation
Pro Forma Income Statement
Jan.
Feb.
Mar.
Total
Sales
$263,500
$186,000
$217,000
$666,500
Cost of Goods Sold
139,400
98,400
126,000
363,800
Gross Profit
124,100
87,600
91,000
302,700
Selling and Admin.
Expense
52,700
37,200
43,400
133,300
Interest Expense
2,667
2,667
2,666
8,000
Net Profit Before Tax
$ 68,733
$ 47,733
$ 44,934
$161,400
Taxes
27,493
19,093
17,974
64,560
Net Profit After Tax
$ 41,240
$ 28,640
$ 26,960
$ 96,840
Less: Common
Dividends
48,420
Increase in Retained
Earnings
$ 48,420
Chapter 04: Financial Forecasting
4-49
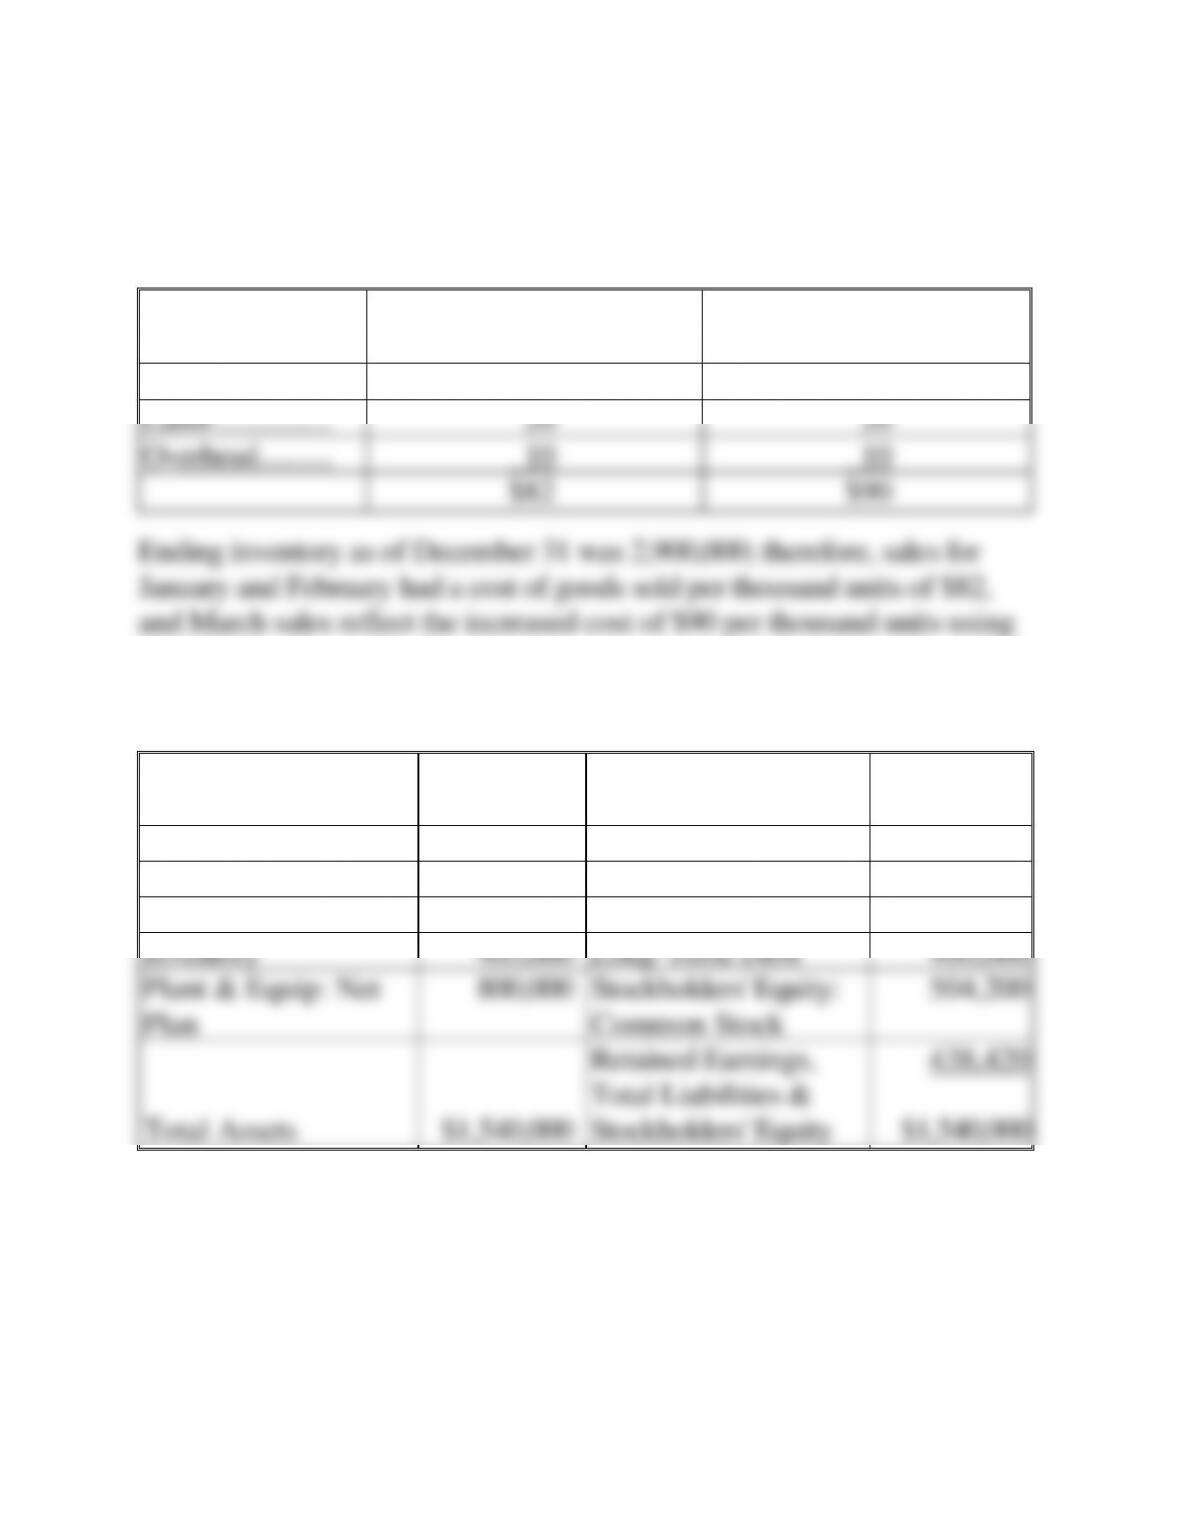
CP 4-2. (Continued)
Marsh Corporation
Cost of Goods Sold
Unit Cost per thousand
before January 1st
Unit cost per thousand
after January 1st
Material …………
$52
$60
Labor ……………..
20
20
Overhead ……….
10
10
$82
$90
Ending inventory as of December 31 was 2,900,000; therefore, sales for
January and February had a cost of goods sold per thousand units of $82,
and March sales reflect the increased cost of $90 per thousand units using
FIFO inventory methods.
Pro Forma Balance Sheet (March)
Assets
Liabilities &
Stockholders‘ Equity
Current Assets:
Current Liabilities:
Cash
$ 25,000
Accounts Payable
$ 150,000
Accounts Receivable
310,000
Notes Payable
47,380
Inventory
405,000
Long-Term Debt
400,000
Plant & Equip: Net
Plan
800,000
Stockholders‘ Equity:
Common Stock
504,200
Total Assets
$1,540,000
Retained Earnings,
Total Liabilities &
Stockholders‘ Equity
438,420
$1,540,000
Chapter 04: Financial Forecasting
4-50
CP 4-2. (Continued)
Explanation of Changes in the Balance Sheet:
Cash = ending cash balance from cash budget in March
Accounts receivable =
all of March sales
plus 50% of Feb.
sales
$217,000
93,000
$310,000
Inventory = ending inventory in March of 4,500,000 units at $90 per
thousand
Plant and equipment did not change since we did not include depreciation.
( )
( )
RE Old RE NI dividends
$390,000 $96,840 $48,240 $438,420
= + −
= + − =