Unlock document.
This document is partially blurred.
Unlock all pages and 1 million more documents.
Get Access
Chapter 13: Risk and Capital Budgeting
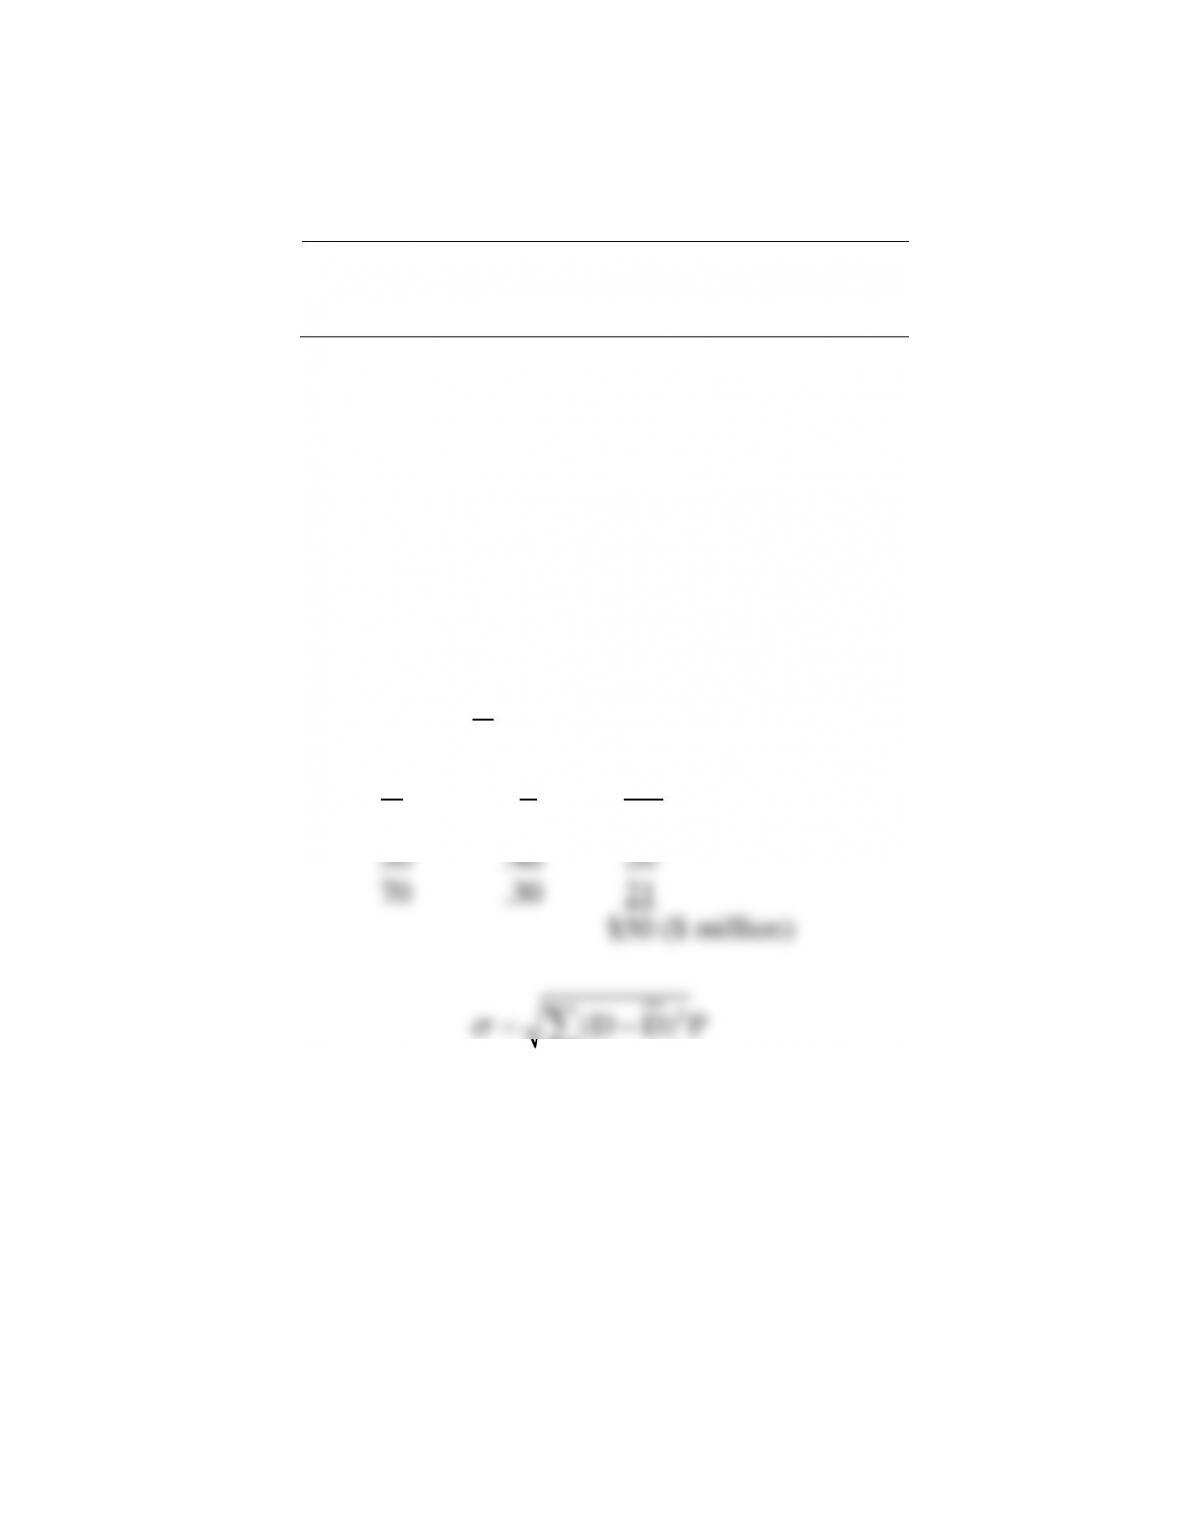
13-23. (Continued)
Standard deviation—year 10
D
D
(D D)−
2
(D D)−
P
2
(D D)−
P
40
80
–40
1,600
.30
480
80
80
0
0
.40
0
120
80
+40
1,600
.30
480
960
Chapter 13: Risk and Capital Budgeting
13-32
13-23. (Continued)
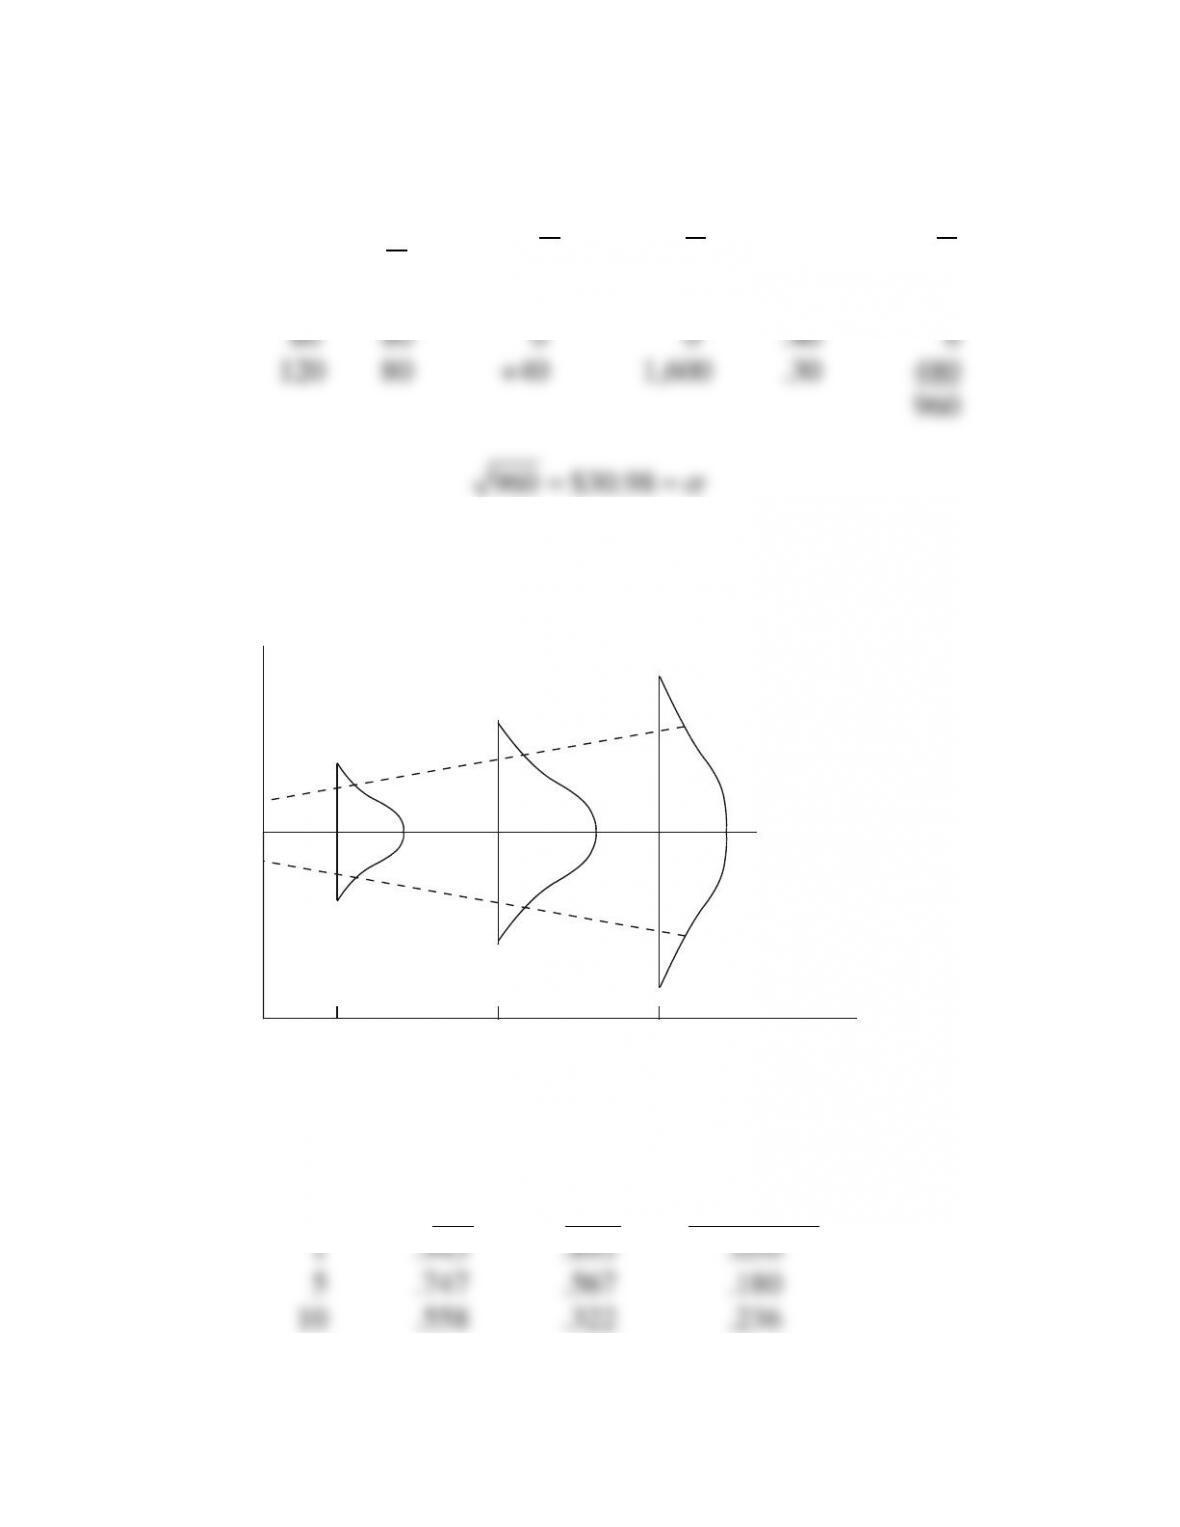
d. Yes. The larger risk over time is consistent with the larger
differences in the present value interest factors (IFPV) over
Year
Inflow
PVIF (12%)
PV
1
$80
.893
$ 71.4
5
80
.567
$ 45.4
10
80
.322
$ 25.8
PV of inflows
$142.6
Investment
$135.0
NPV
$ 7.6
e. Accept the investment.
Chapter 13: Risk and Capital Budgeting
13-33
24. Portfolio effect of a merger (LO5) Treynor Pie Co. is a food company specializing in
high-calorie snack foods. It is seeking to diversify its food business and lower its risks. It is
examining three companies—a gourmet restaurant chain, a baby food company and a
nutritional products firm. Each of these companies can be bought at the same multiple of
earnings. The following represents information about all the companies.
Company
Correlation
with Treynor
Pie Company
Sales
($ millions)
Expected
Earnings
($ millions)
Standard
Deviation
in Earnings
($ millions)
Treynor Pie Company ............
+ 1.0
$100
$8
$2.0
Gourmet restaurant ................
+ .6
60
6
1.2
Baby food company ...............
+ .2
50
4
1.8
Nutritional products
company ................................
− .7
70
5
3.4
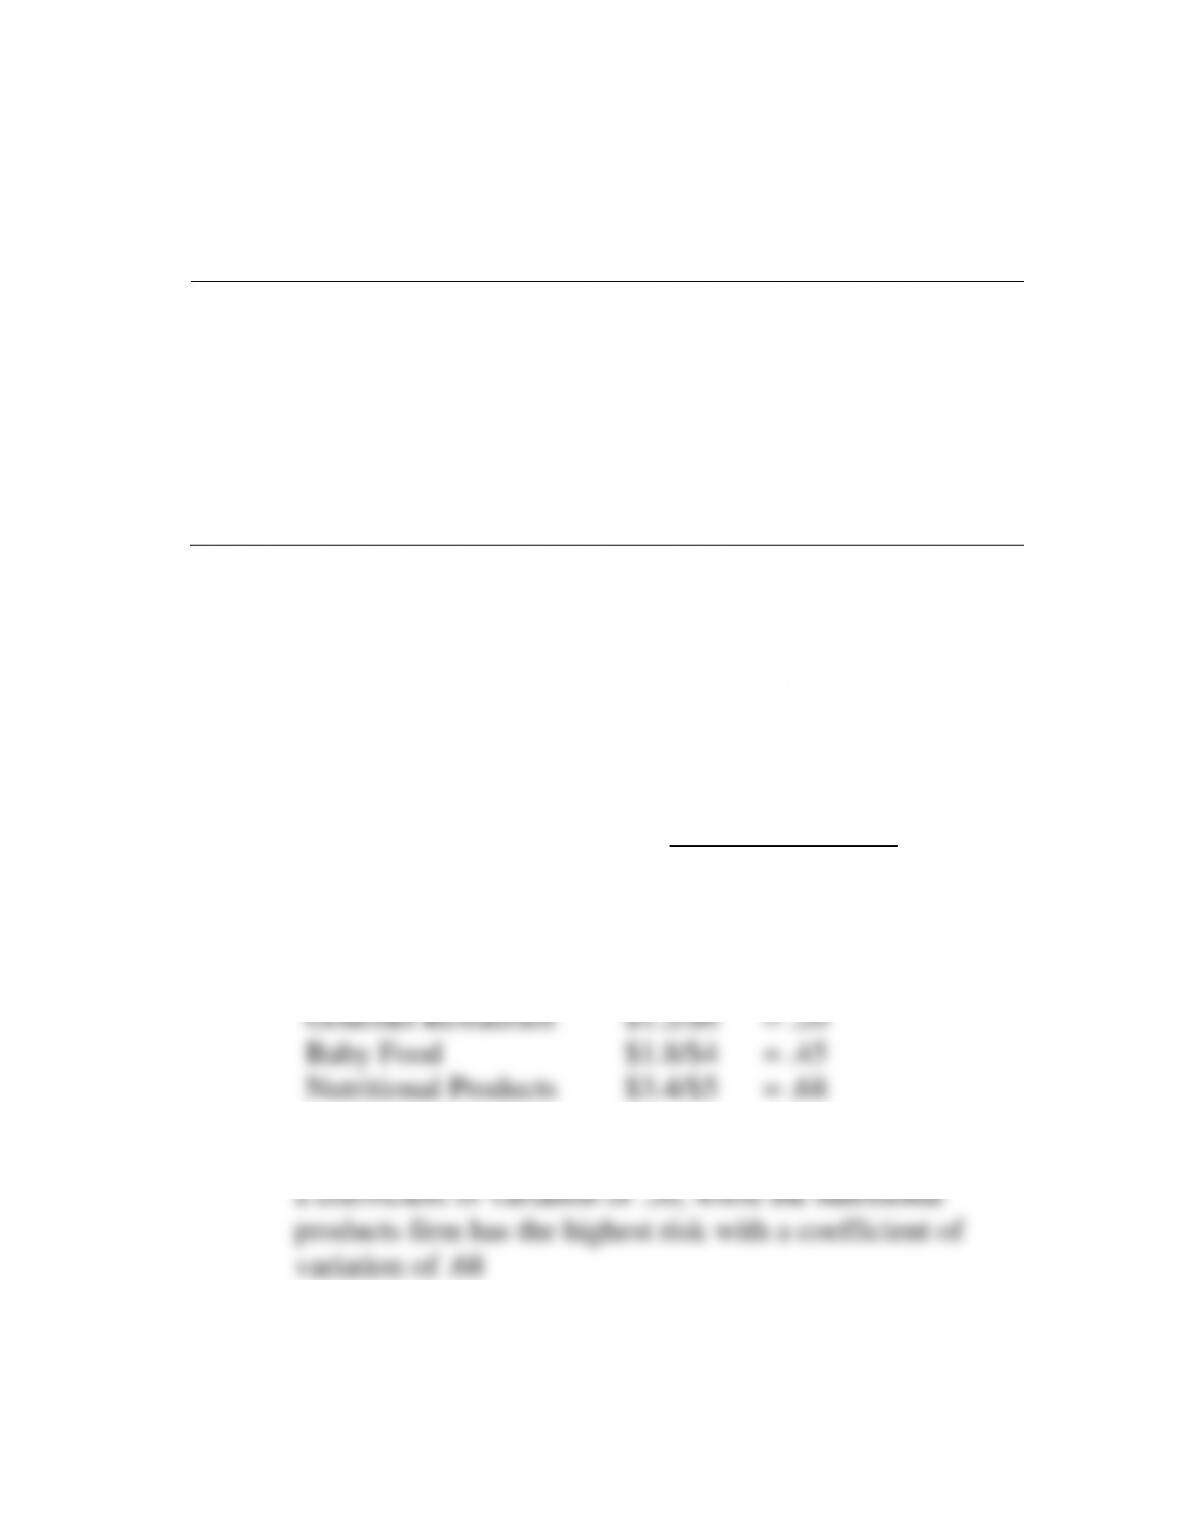
a. Using the last two columns, compute the coefficient of variation for each of the four
companies. Which company is the least risky? Which company is the most risky?
b. Discuss which of the acquisition candidates is most likely to reduce Treynor Pie
Company’s risk? Explain why.
13-24. Solution:
Treynor Pie Co.
a.
standard deviation
Coefficient of variation (V) expected value
=
(millions)
Treynor Pie Co. $2/$8 = .25
The Gourmet Restaurant chain is the least risky with
Chapter 13: Risk and Capital Budgeting
13-34
13-24. (Continued)
b. Because the nutritional products firm is highly negatively
correlated (–.7) with Treynor Pie Co., it is most likely to
Thus, Treynor Pie Co. would reduce its risk to the largest
extent by acquiring the company with the highest
25. Portfolio effect of a merger (LO5) Transoceanic Airlines is examining a resort motel
chain to add to its operation. Prior to the acquisition, the normal expected outcomes for the
firm are as follows:
Outcomes
($ millions)
Probability
Recession ...........................
$30
.30
Normal economy ................
50
.40
Strong economy .................
70
.30
After the acquisition, the expected outcomes for the firm would be:
Outcomes
($ millions)
Probability
Recession ...........................
$ 10
.30
Normal economy ................
50
.40
Strong economy .................
100
.30
Chapter 13: Risk and Capital Budgeting
a. Compute the expected value, standard deviation, and coefficient of variation before
the acquisition.
After the acquisition, these values are as follows:
Expected value ......................................
53.0 ($ millions)
Standard deviation .................................
34.9 ($ millions)
Coefficient of variation..........................
.658
b. Comment on whether this acquisition appears desirable to you.
c. Do you think the firm’s stock price is likely to go up as a result of this acquisition?
d. If the firm were interested in reducing its risk exposure, which of the following three
industries would you advise it to consider for an acquisition? Briefly comment on
your answer.
(1) Major travel agency
(2) Oil company
(3) Gambling casino
13-25. Solution:
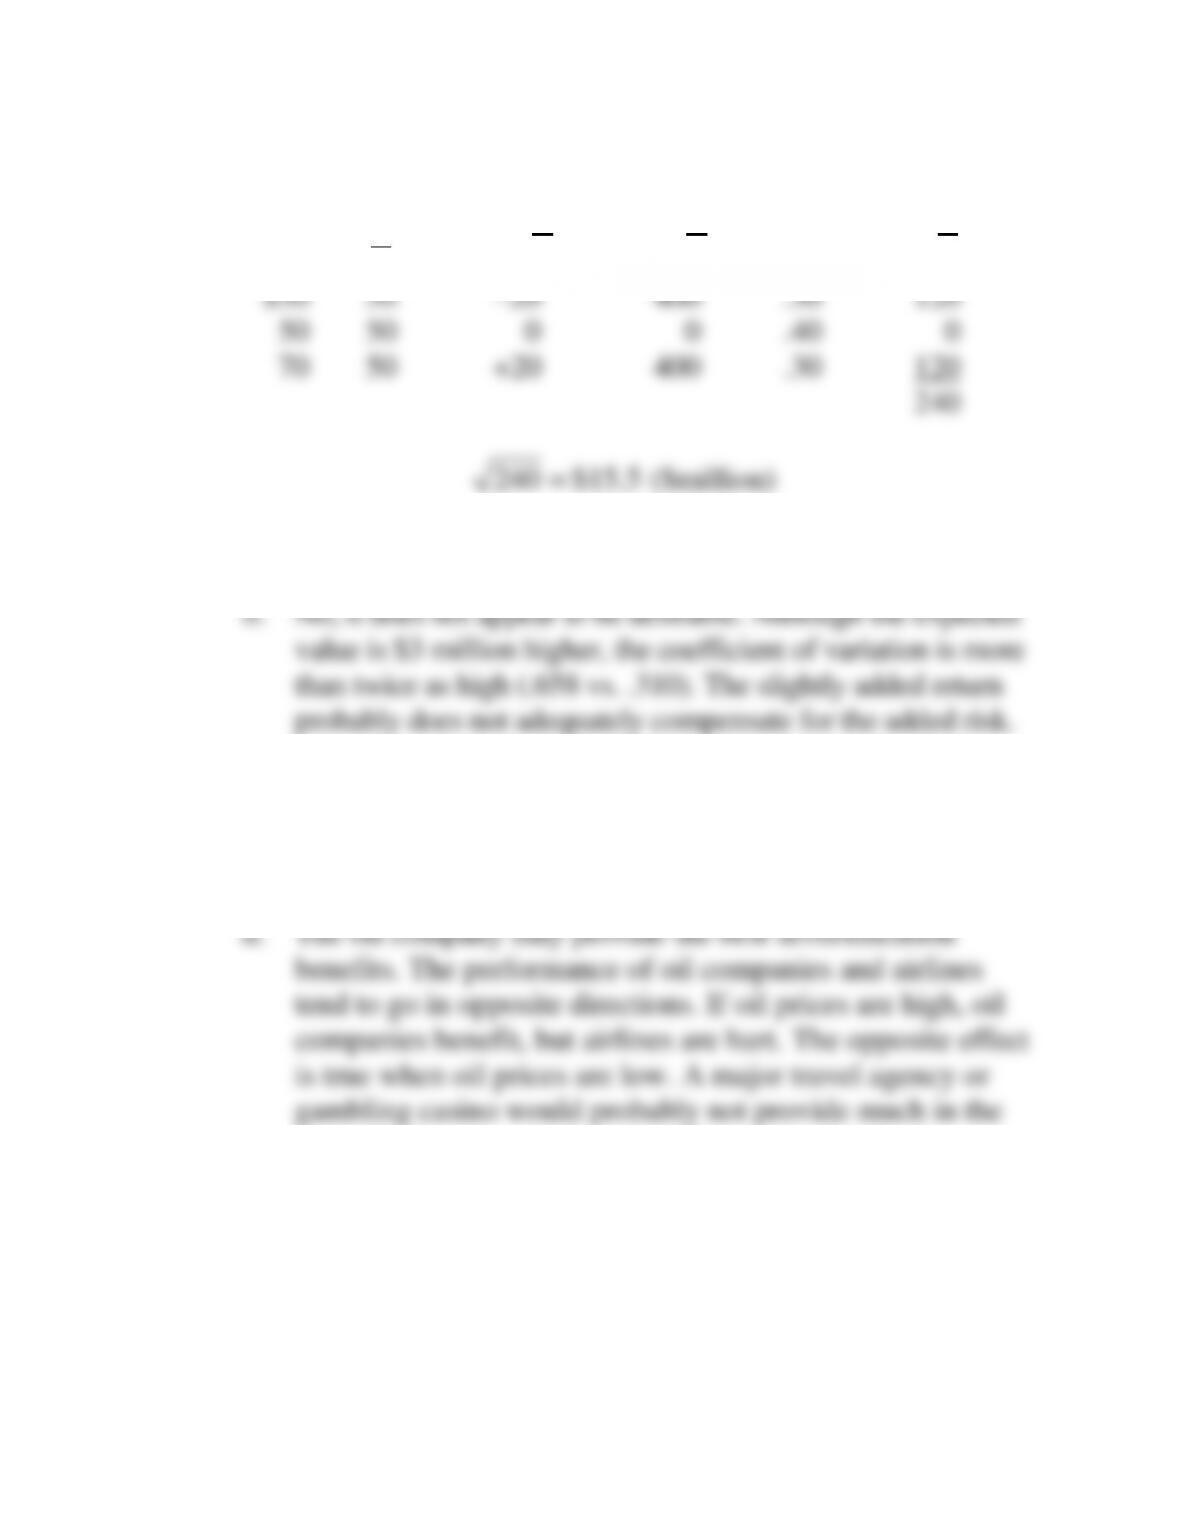
Transoceanic Airlines
D DP=
D P PD
$30 .30 9
Chapter 13: Risk and Capital Budgeting
13-36
13-25. (Continued)
D
D
(D D)−
2
(D D)−
P
2
(D D)−
P
$30
50
–20
400
.30
120
50
50
0
0
.40
0
70
50
+20
400
.30
120
240
240 $15.5 ($million)=
V = $15.5/$50 = .310
c. Probably not. There may be a higher discount rate applied
to the firm’s earnings to compensate for the additional risk.
The stock price may actually go down.
way of risk reduction benefits. They are both closely
associated with entertainment and travel.
Chapter 13: Risk and Capital Budgeting
13-37
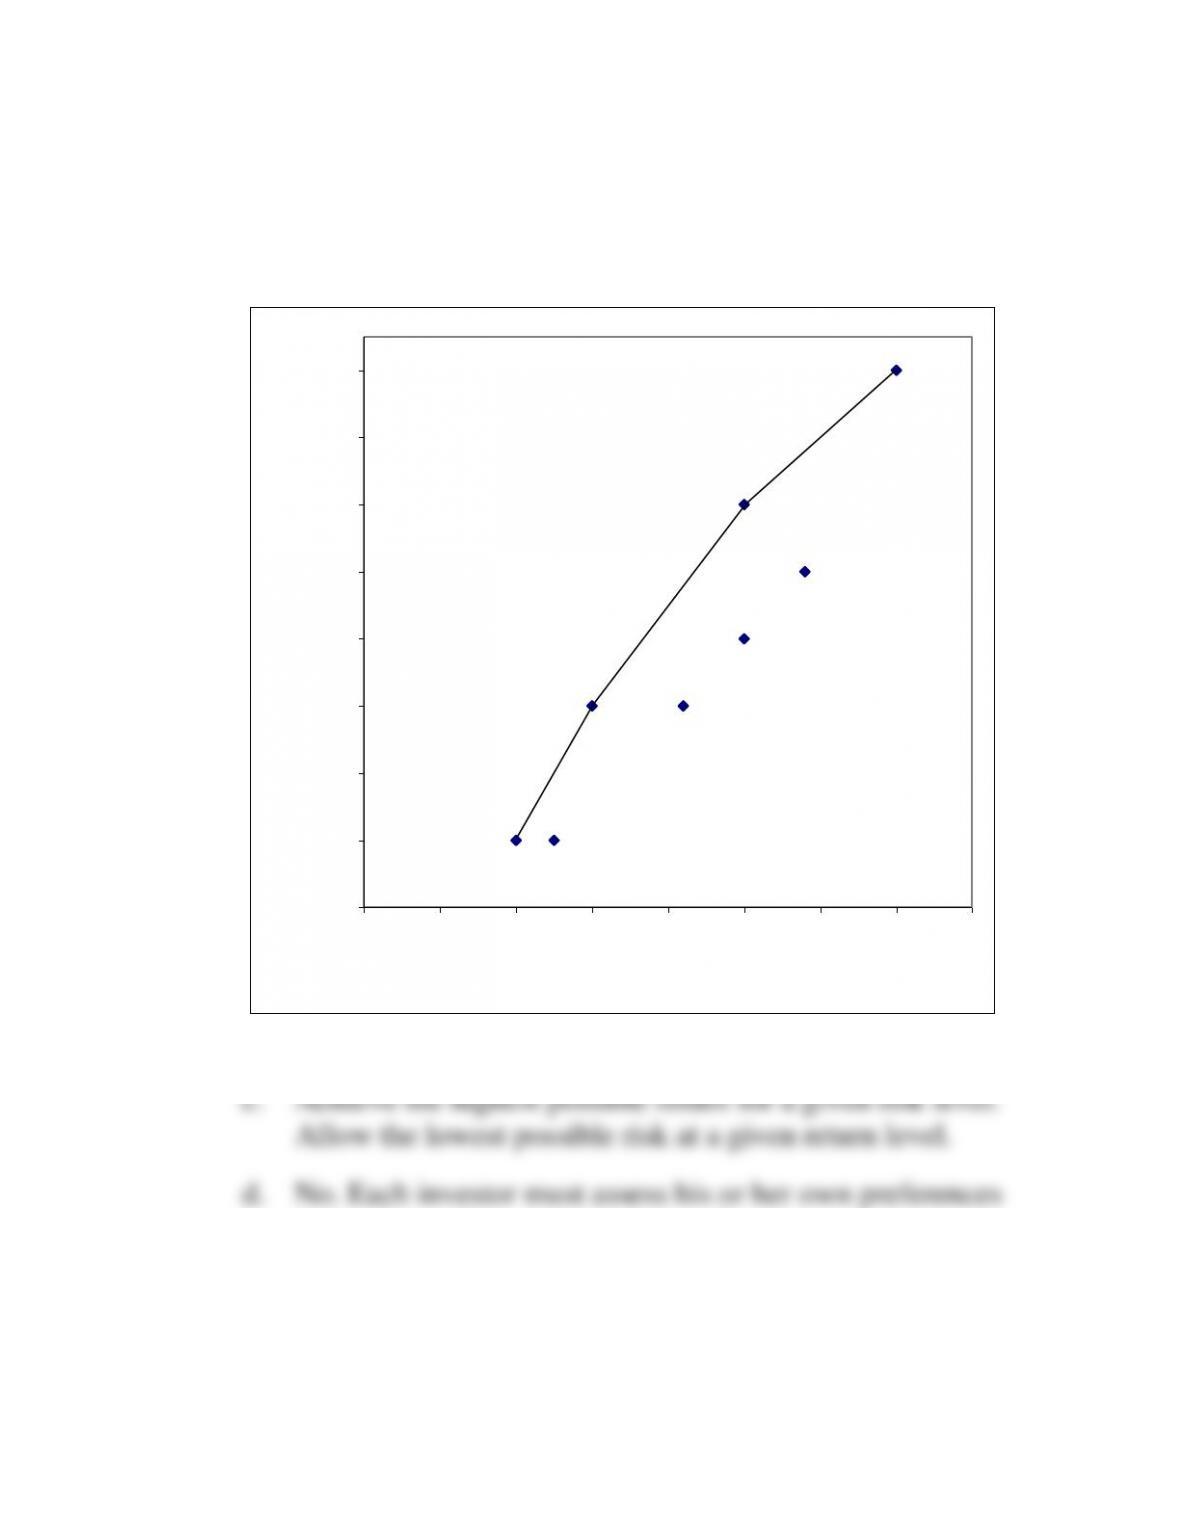
26. Efficient frontier (LO5) Ms. Sharp is looking at a number of different types of
investments for her portfolio. She identifies eight possible investments.
Return
Risk
Return
Risk
(a) .................
11%
2%
(e).................
14%
5.0%
(b) .................
11
2.5
(f) .................
16
5.0
(c) .................
13
3.0
(g) ................
15
5.8
(d) .................
13
4.2
(h) ................
18
7.0
a. Graph the data in a manner similar to Figure 13–11. Use the axes below for your data.
b. Draw a curved line representing the efficient frontier.
c. What two objectives do points on the efficient frontier satisfy?
d. Is there one point on the efficient frontier that is best for all investors?
Chapter 13: Risk and Capital Budgeting
13-38
13-26. Solution: Ms. Sharp
a., b.
10
11
12
13
14
15
16
17
18
0 1 2 3 4 5 6 7 8
Risk (percent)
Return
about their risk and return trade-off.
Chapter 13: Risk and Capital Budgeting
13-39
27. Certainty equivalent approach (LO1) Sheila Goodman recently received her MBA from
the Harvard Business School. She has joined the family business, Goodman Software
Products, Inc., as vice-president of finance.
She believes in adjusting projects for risk. Her father is somewhat skeptical but agrees
to go along with her. Her approach is somewhat different than the risk-adjusted discount
rate approach, but achieves the same objective.
She suggests that the inflows for each year of a project be adjusted downward for lack
of certainty and then be discounted back at a risk-free rate. The theory is that the
adjustment penalty makes the inflows the equivalent of risk-less inflows, and therefore a
risk-free rate is justified.
A table showing the possible coefficient of variation for an inflow and the associated
adjustment factor is shown below:
Coefficient
of Variation
Adjustment
Factor
0 –.25 .................
.90
.26 –.50 .................
.80
.51 –.75 .................
.70
.76 –1.00 ...............
.60
1.01–1.25 ...............
.50
Assume a $150,000 project provides the following inflows with the associated coefficients
of variation for each year.
Year
Inflow
Coefficient of Variation
1 ........................
$30,000
.12
2 ........................
50,000
.22
3 ........................
70,000
.46
4 ........................
55,000
.78
5 ........................
60,000
1.06
a. Fill in the table below:
Year
Inflow
Coefficient of
Variation
Adjustment
Factor
Adjusted
Inflow
1 ...................
$30,000
.12
____________
____________
2 ...................
50,000
.22
____________
____________
3 ...................
70,000
.46
____________
____________
4 ...................
55,000
.78
____________
____________
5 ...................
60,000
1.06
____________
____________
b. If the risk-free rate is 5 percent, should this $150,000 project be accepted? Compute
the net present value of the adjusted inflows.
Chapter 13: Risk and Capital Budgeting
13-40
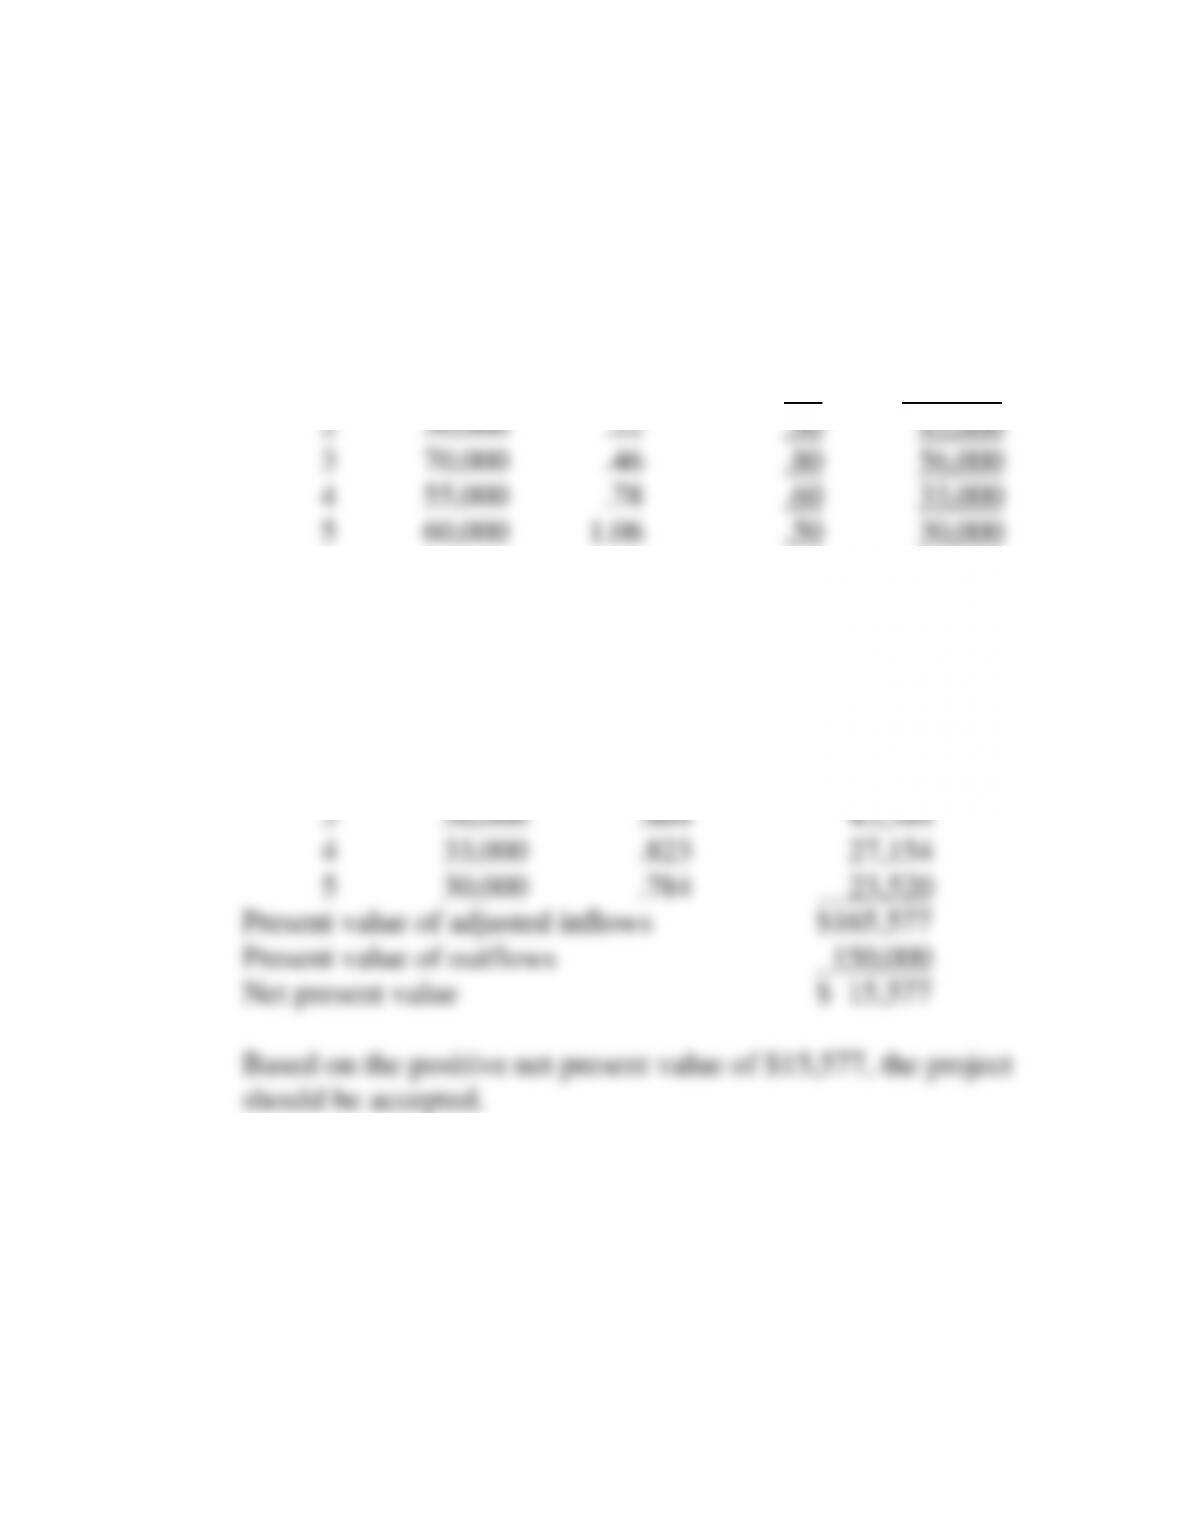
13-27. Solution: Goodman Software Products
a. Adjusted Inflows
Year
Inflow
Coefficient
of Variation
Adjustment
Factor
Adjusted
Inflow
1
$30,000
.12
.90
$27,000
2
50,000
.22
.90
45,000
3
70,000
.46
.80
56,000
4
55,000
.78
.60
33,000
5
60,000
1.06
.50
30,000
b. Net Present Value
Year
Adjusted
Inflow
PVIF
at 5%
Present
Value
1
$27,000
.952
$ 25,704
2
45,000
.907
40,815
3
56,000
.864
43,384
4
33,000
.823
27,154
5
30,000
.784
23,520
Present value of adjusted inflows $165,577
Present value of outflows 150,000
Net present value $ 15,577
Based on the positive net present value of $15,577, the project
should be accepted.


