19
What Happened?
•Country Cinema (aka Carmike Cinemas) defaulted
and filed for bankruptcy protection in August 2000
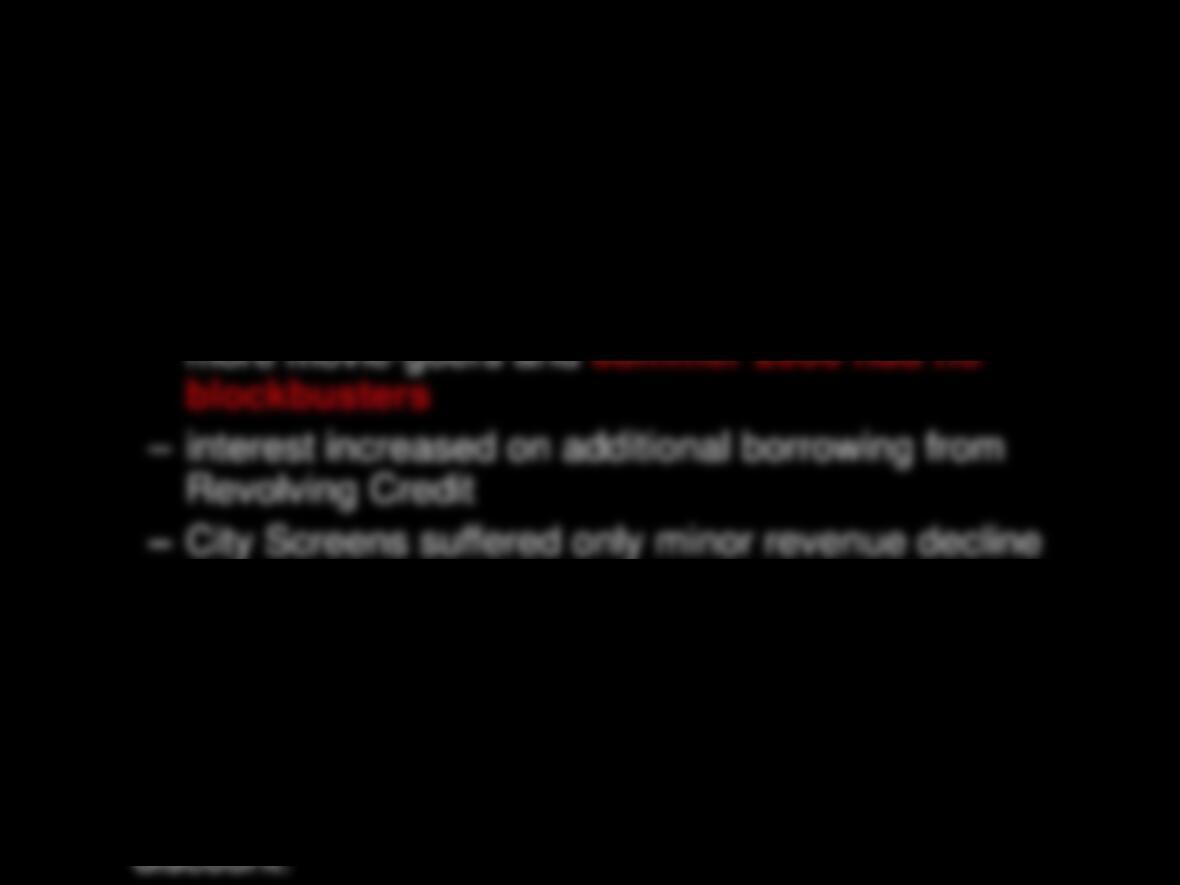
–City Screens is AMC Entertainment
–Revenue declined rapidly as Megaplexes attracted
due to increased ticket prices and international
growth
•Country Cinema closed 25% of its theaters, incurred
$4M in professional fees plus .8M/month. Equity fell
to 29 cents/share and delisted. Debt sold at 50%
20
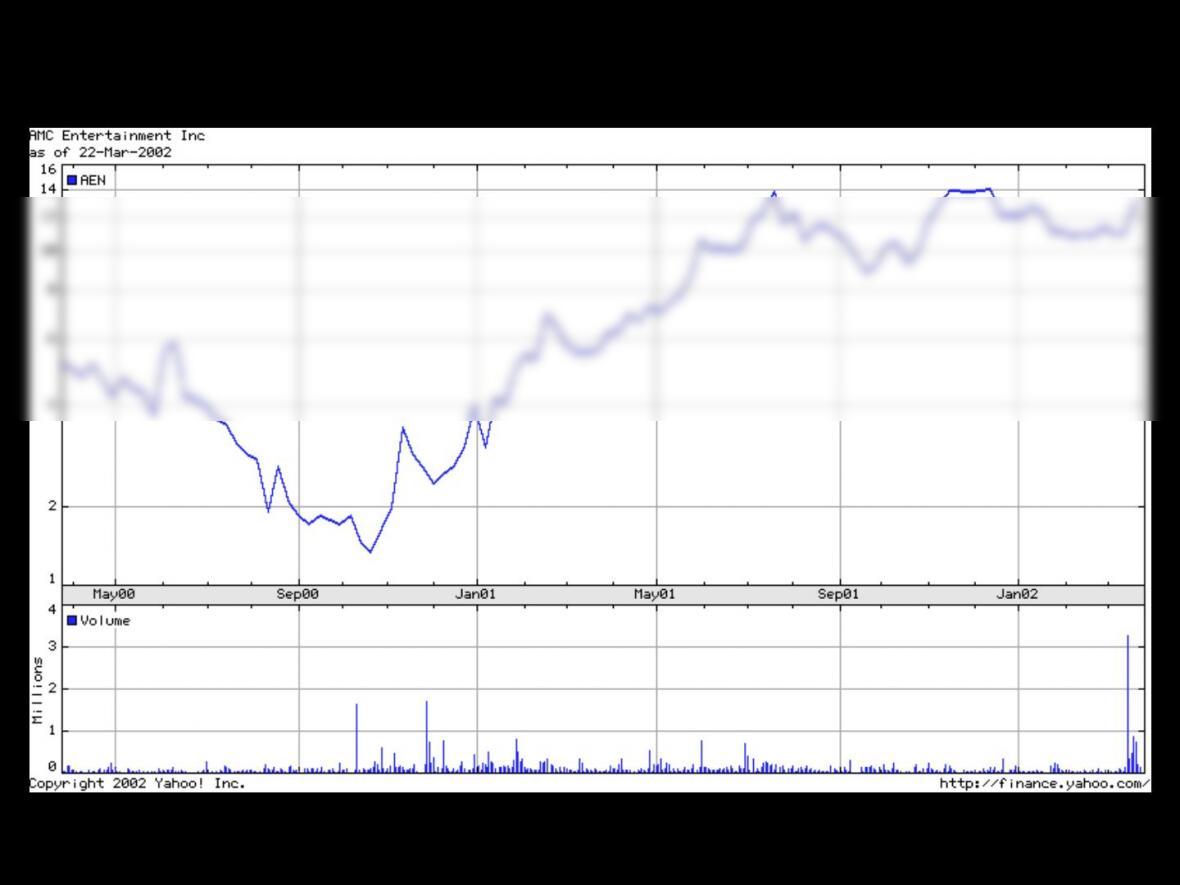
…and what happened to City Screens?
(AMC Entertainment: AEN)
21
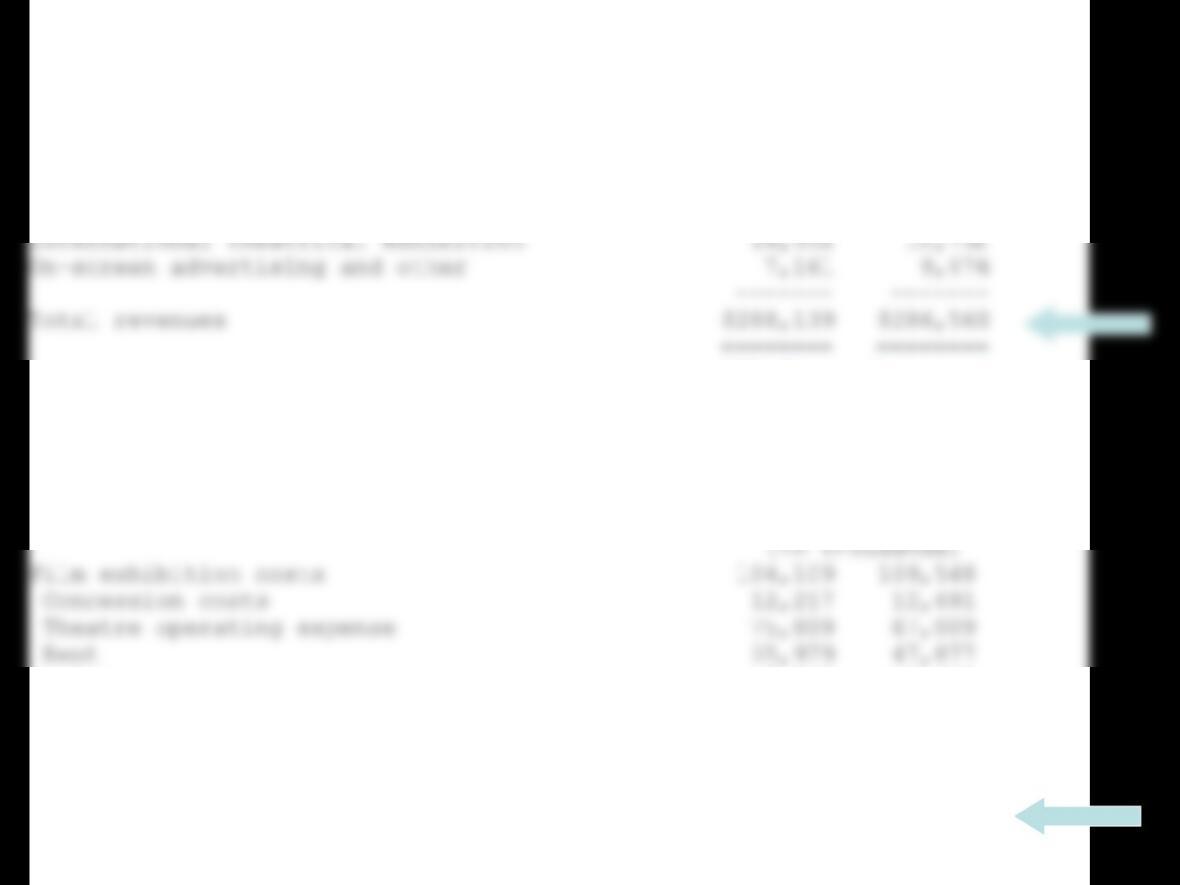
AMC Entertainment (aka City Screens)
Thirteen Weeks Ended
June 29, July 1,
2000 1999
Revenues —- —-
(in thousands)
North America theatrical exhibition $264,646 $265,952
Thirteen Weeks Ended
June 29, July 1,
2000 1999
—- —-
Other 8,825 10,695
General and administrative 6,635 13,211
——- ——-
Adjusted costs and expenses 263,574 261,031
——- ——–
Adjusted EBITDA 24,565 25,529
======== ========
-3.8% change in EBITDA
.6% change in revuene
22
Carmike, Inc. (aka Country Cinema)
THREE MONTHS ENDED
JUNE 30,
2000 1999
———- ———-
Revenues:
Admissions $ 77,217 $ 87,046
Concessions and other 35,510 38,227
———- ———-
Total Revenue 112,727 125,273
Costs and expenses:
Film exhibition costs 44,206 48,897
Concession costs 5,087 4,984
Other theatre operating costs 50,156 46,736
-10% revenue

23
dredging the value portfolio
•the financial health score (0-9). get 1 point for
–profitability: NI>0, CFO>0 and DROA>0.
high score is sum between 8-9 (10% of sample)
source: Piotroski 2000
24
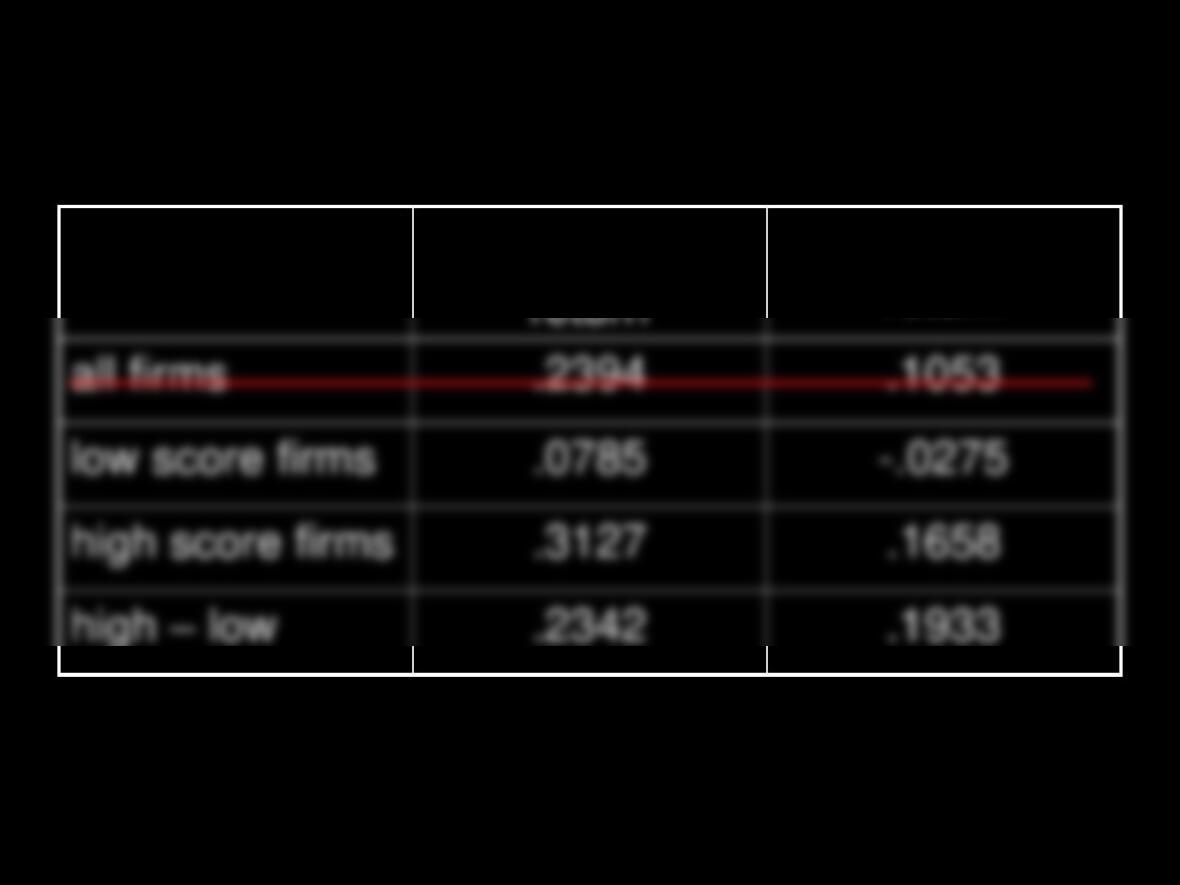
…and the payoff?
mean portfolio
median portfolio
return
sample is 14043 firm-years of highest 20% Bk/Mkt firms each year (i.e. value stocks)
between 1976 and 1996. Returns are for 1 year, starting 5 months after fiscal year.
25
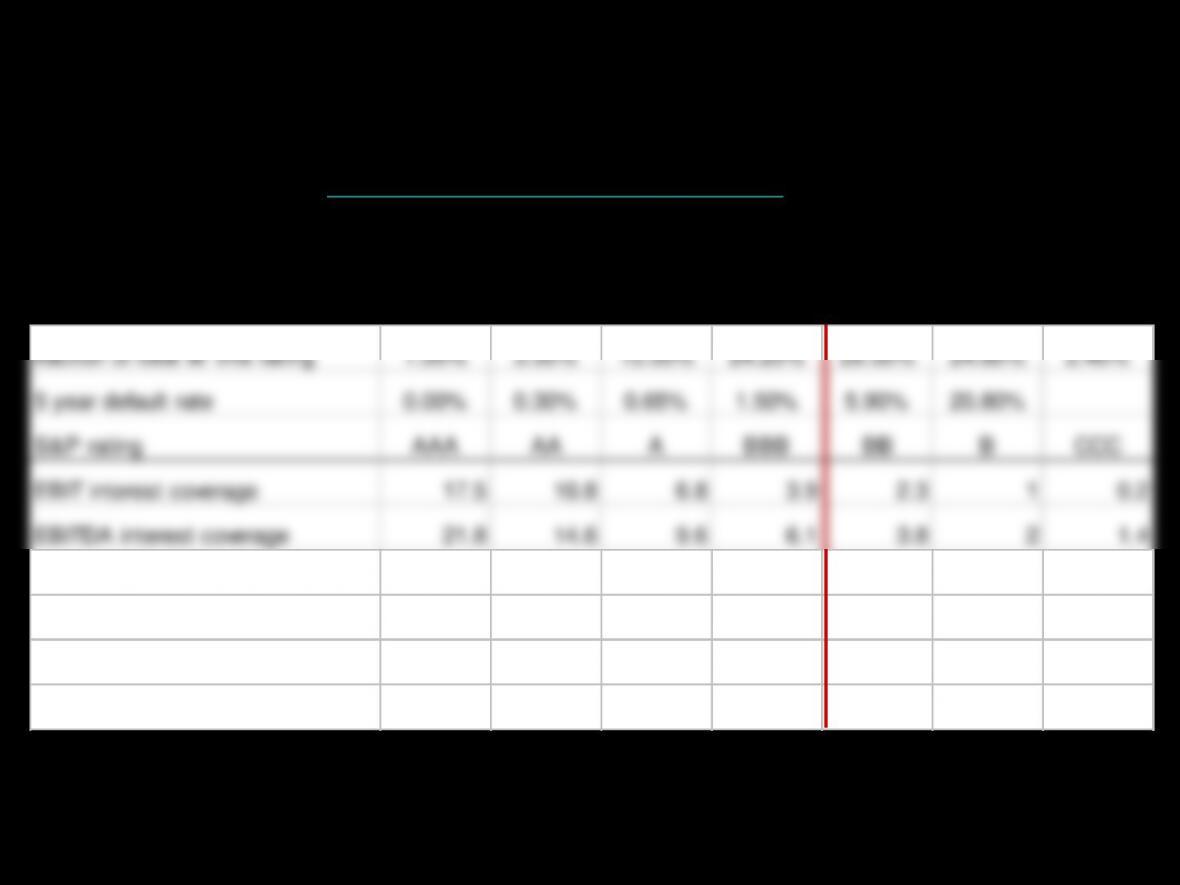
fraction of total w/ this rating 1.00% 3.50% 15.50% 24.20% 28.50% 24.80% 2.40%
5 year default rate 0.00% 0.30% 0.65% 1.50% 5.90% 20.80%
S&P rating AAA AA ABBB BB BCCC
EBIT interest coverage 17.5 10.8 6.8 3.9 2.3 1 0.2
Equity (million $) 11378.3 4684.6 1993.9 894 256.7 84.1 17.8
Key Industrial Ratios
investment grade junk
Credit Ratings and Default Predictions
http://www.bondsonline.com
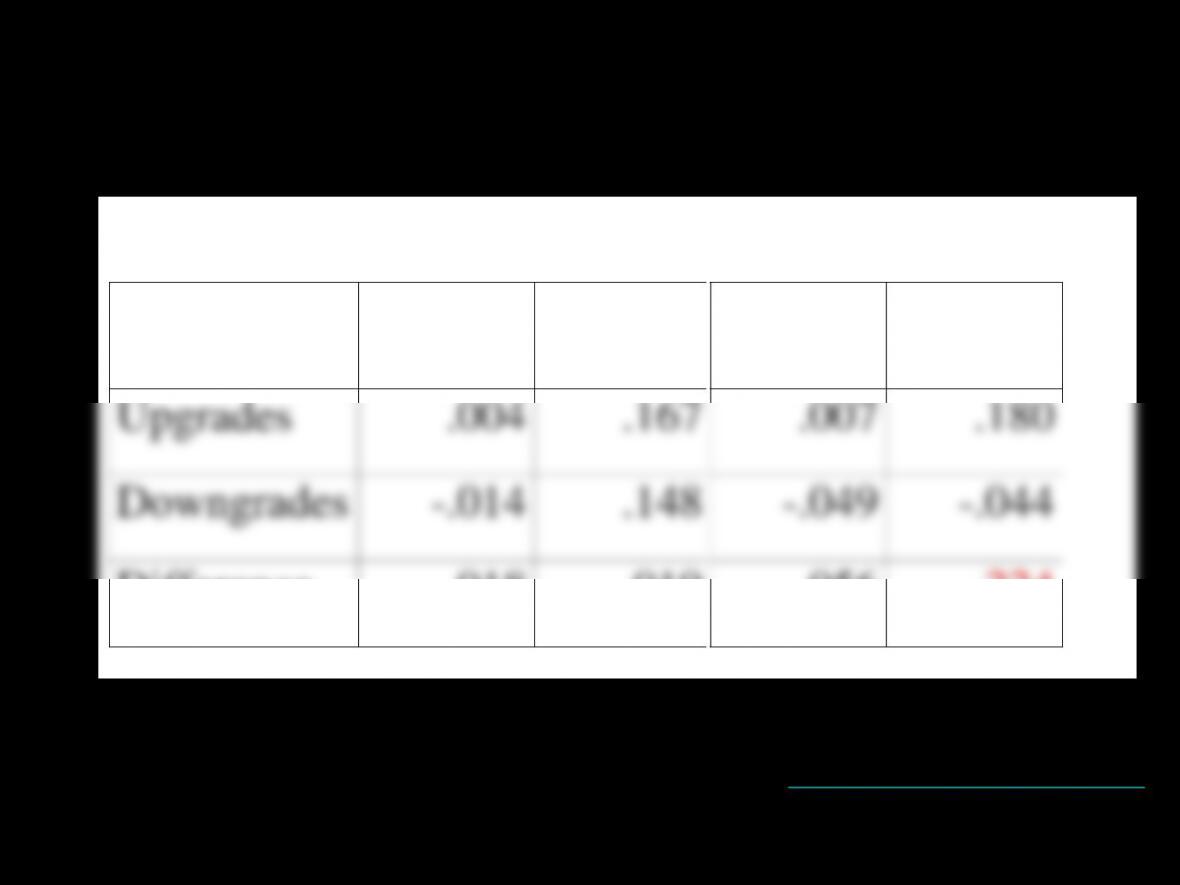
Is there information in rating
changes?
3 Day
Return
1 Year
Return
3 Day
Return
1 Year
Return
Upgrades
.004
.167
.007
.180
Downgrades
-.014
.148
-.049
-.044
Difference
.018
.019
.056
.224
Investment Grade Junk