Debt and Default
•Who cares about debt and default risk?
•Vfirm = Vequity + Vdebt
–If Vfirm > > Vdebt then use PV of respective future
pmts to value debt and equity
2
Predicting Default
•What does it
mean to
“default?”
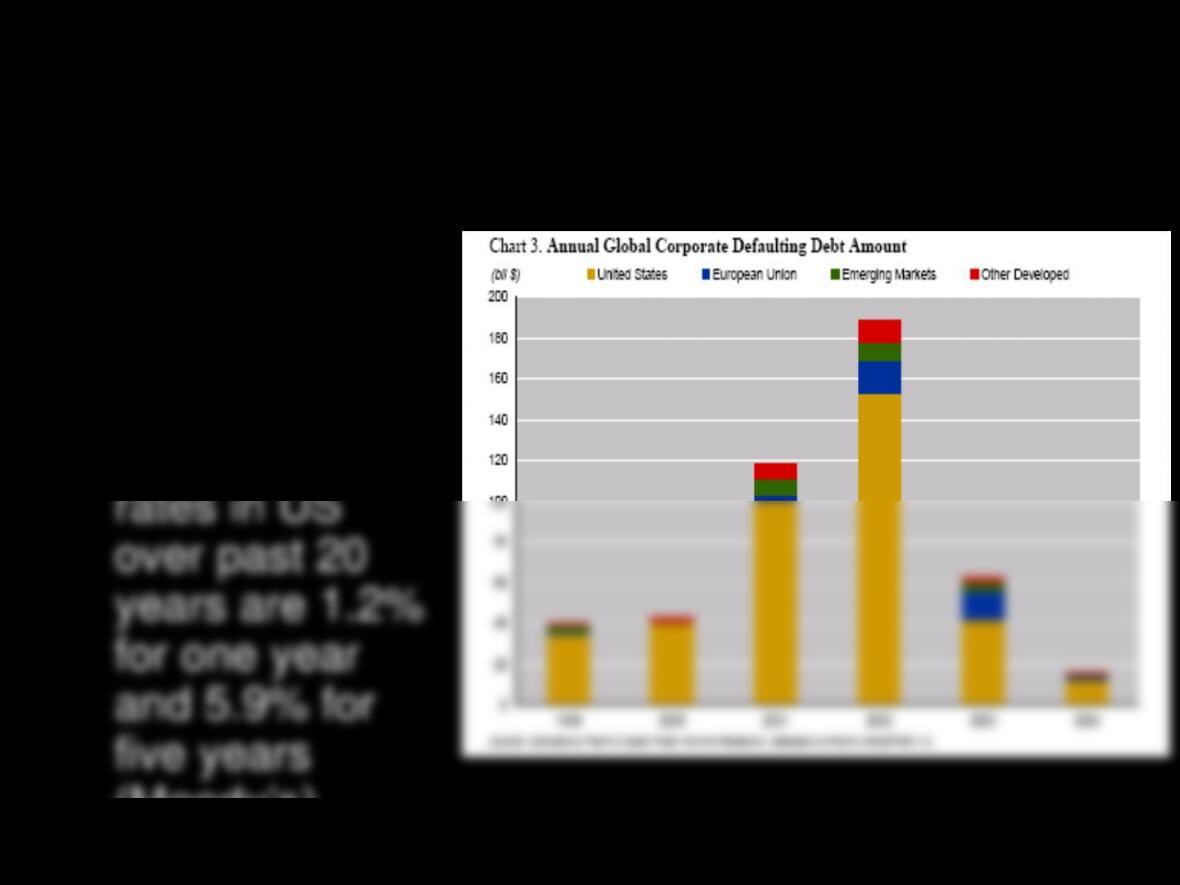
•Average default
(Moody’s).
$178B
3
Moody’s RiskCalc
http://riskcalc.moodysrms.com/
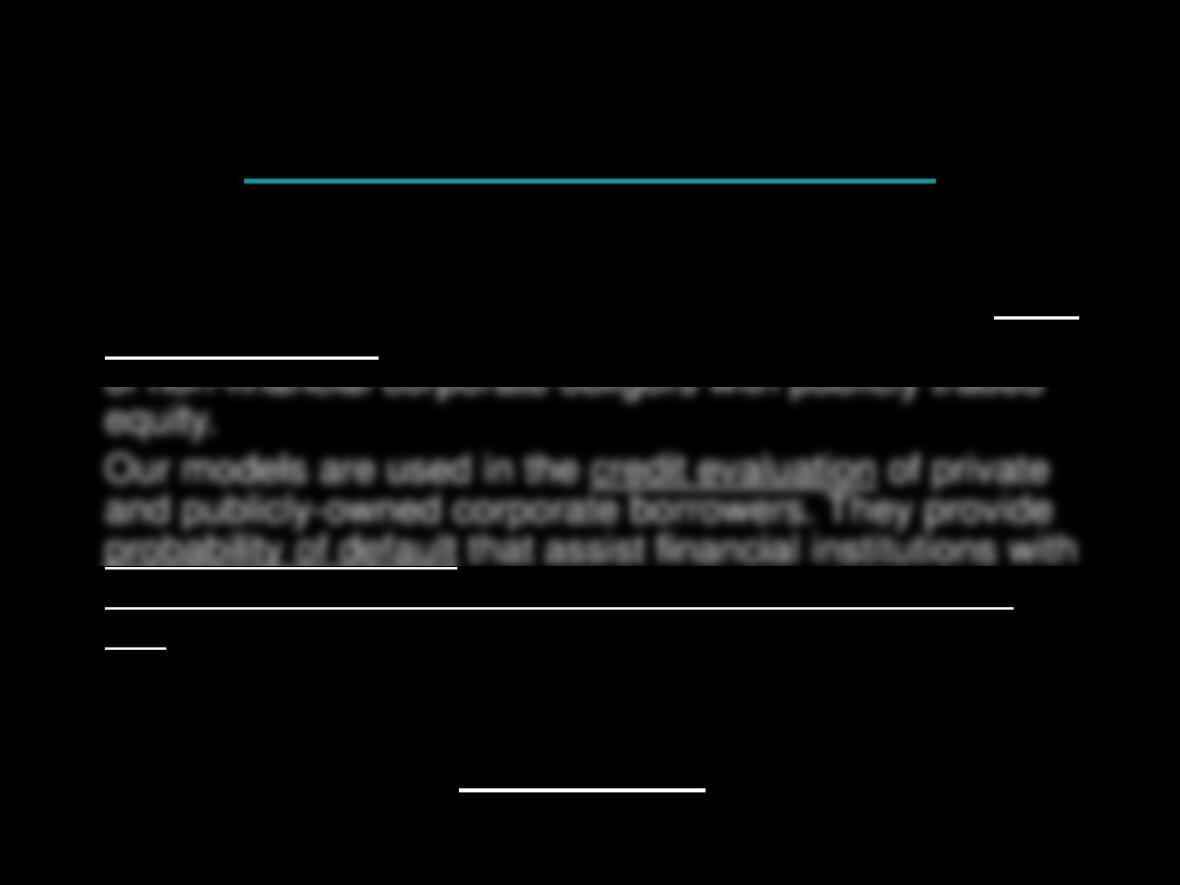
“Moody’s RiskCalc™ has been designed to act as an early
warning system to monitor changes in the credit quality
measuring, monitoring and managing portfolio credit
risk.”
What are the various determinants of Moody’s
RiskCalc?
4
NI/Assets = .022
5
2.21
6
7
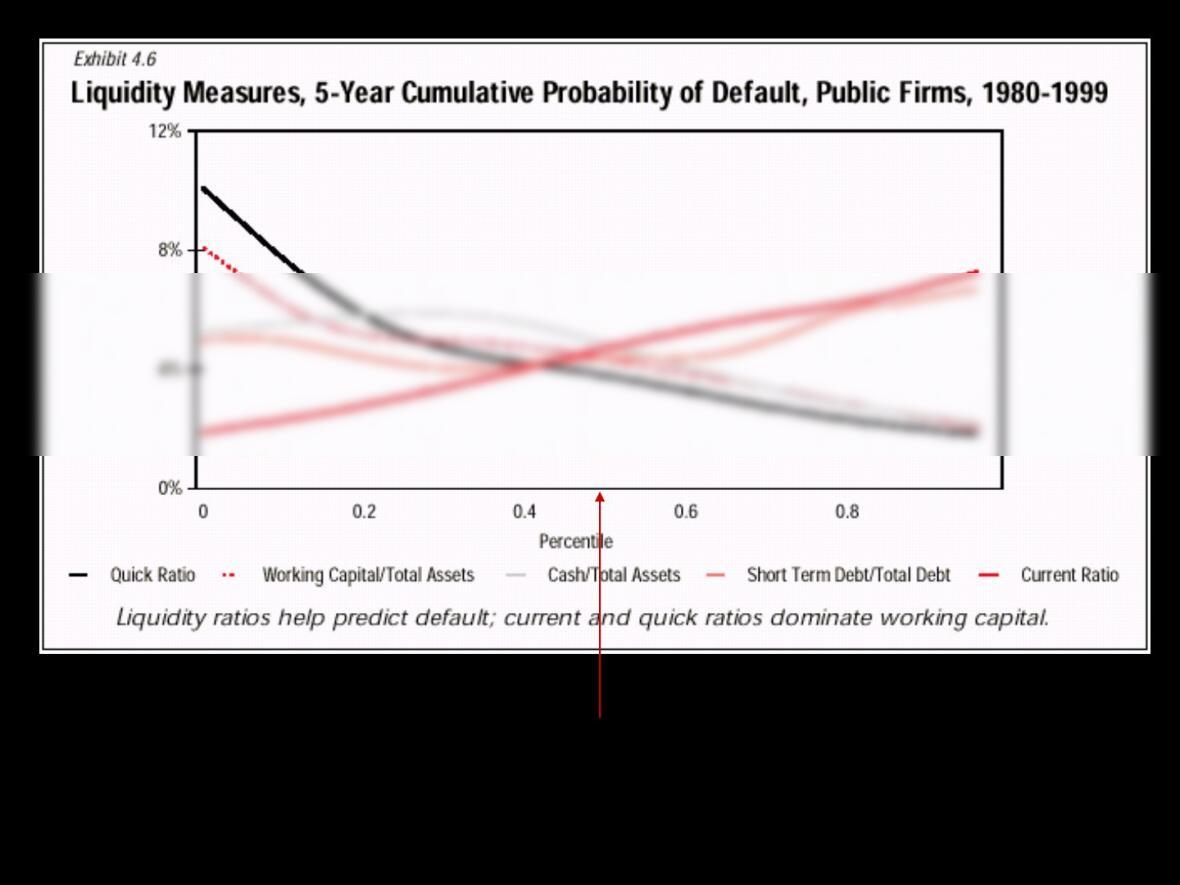
(CA –Inv)/CL = 1.2
8
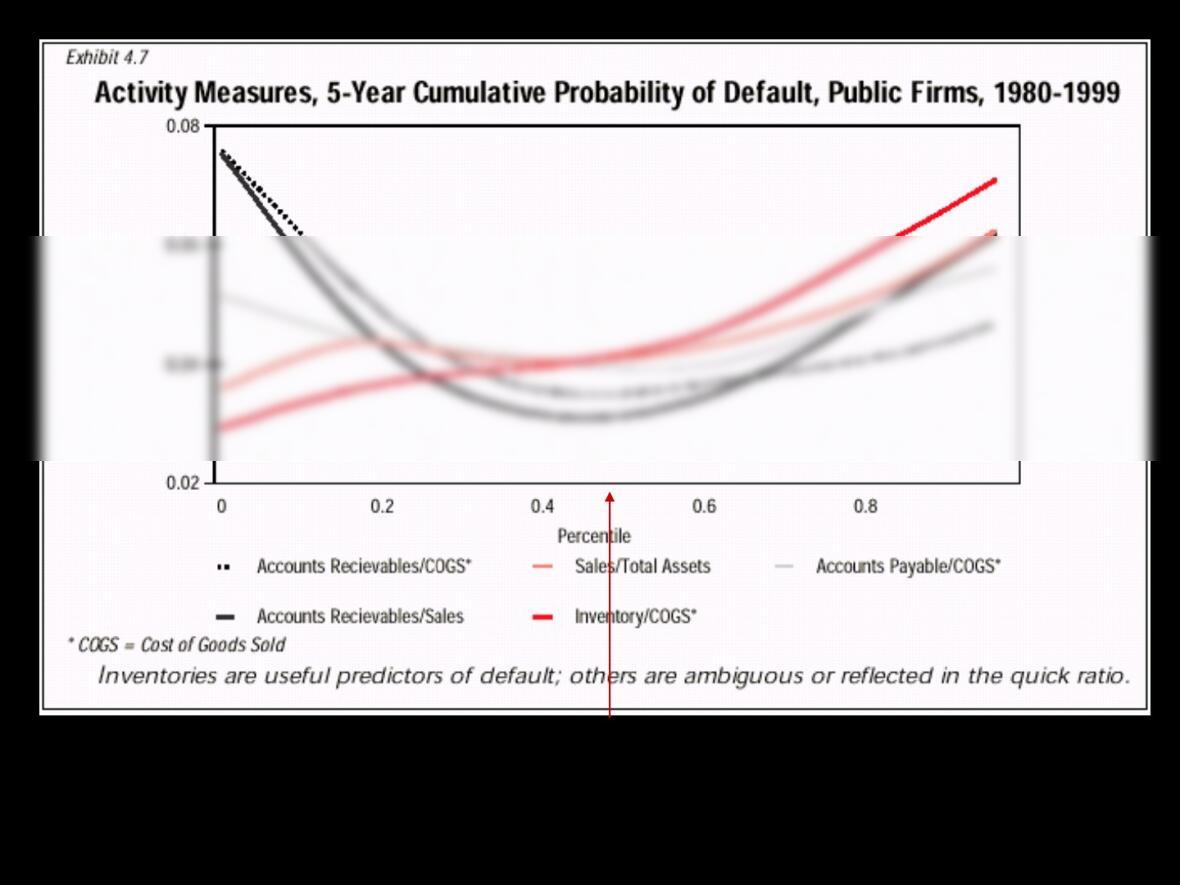
Inv/CGS = .137
or 50 days
9
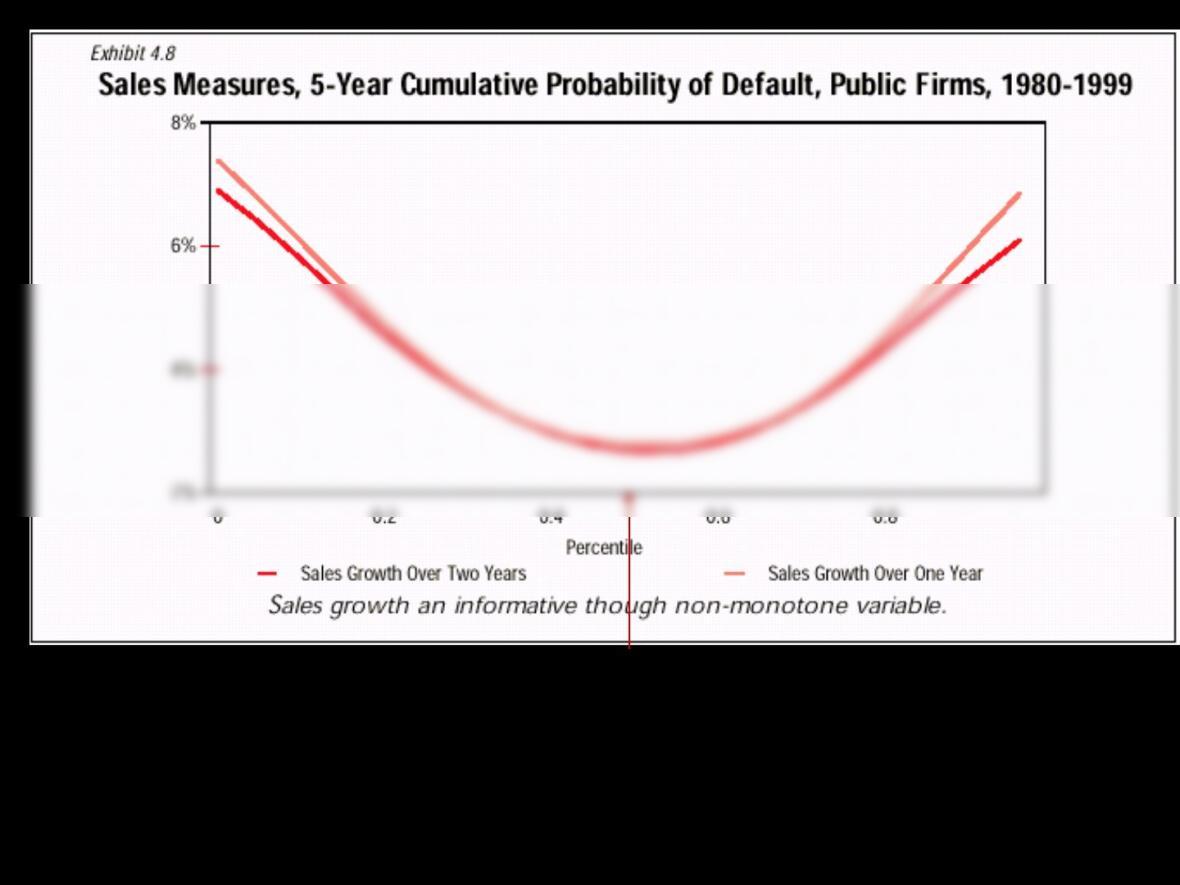
Sales growth =
.098
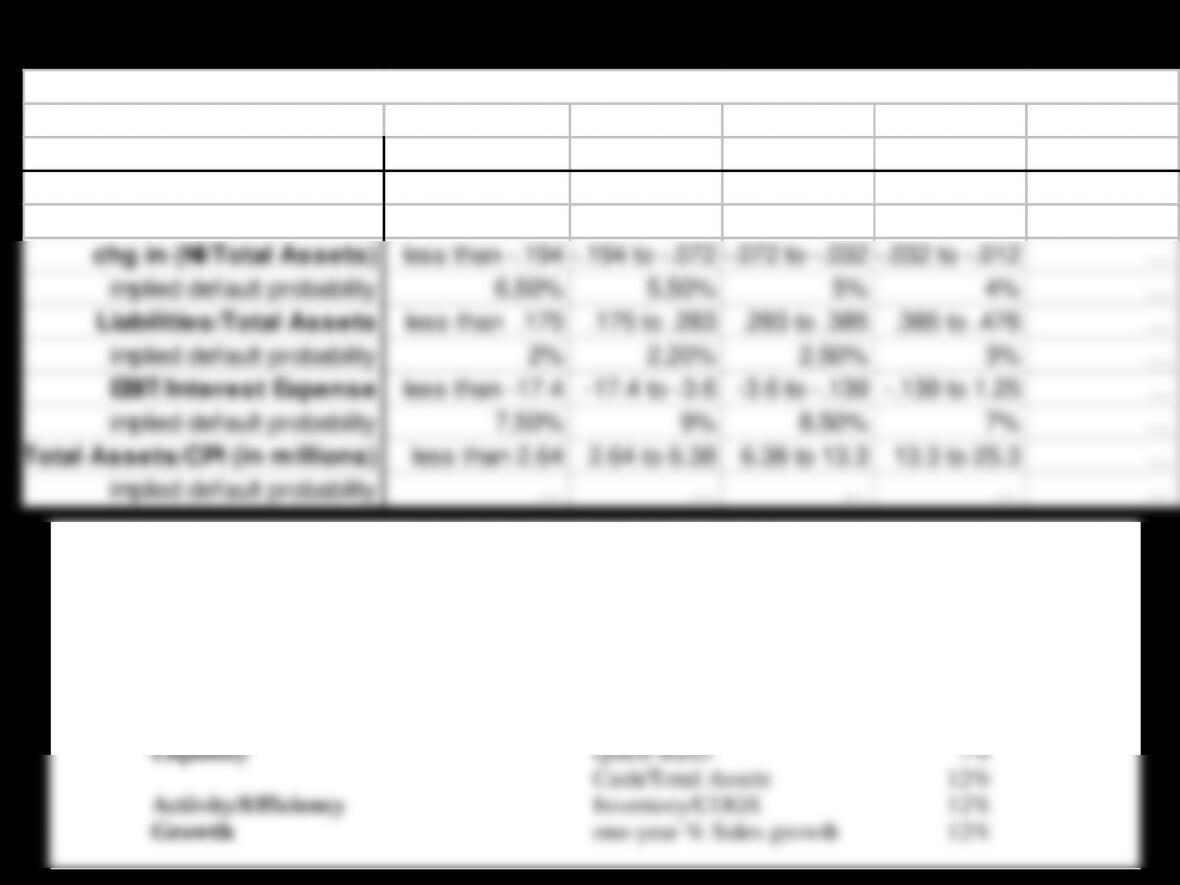
Table 1: Distribution of Financial Statement Ratios and Implied Default Probabilities
decile 0 to .10 .10 to .20 .20 to .30 .30 to .40 …
NI/Total Assets less than –.448 -.448 to –.161 -.161 to -.049 –.049 to .001 …
implied default probability 8.30% 8% 7.20% 5.50% …
chg in (NI/Total Assets) less than –.194 -.194 to –.072 -.072 to -.032 –.032 to –.012 …
implied default probability 6.50% 5.50% 5% 4% …
Liabilities/Total Assets less than .175 .175 to .283 .283 to .385 .385 to .476 …
implied default probability 2% 2.20% 2.50% 3% …
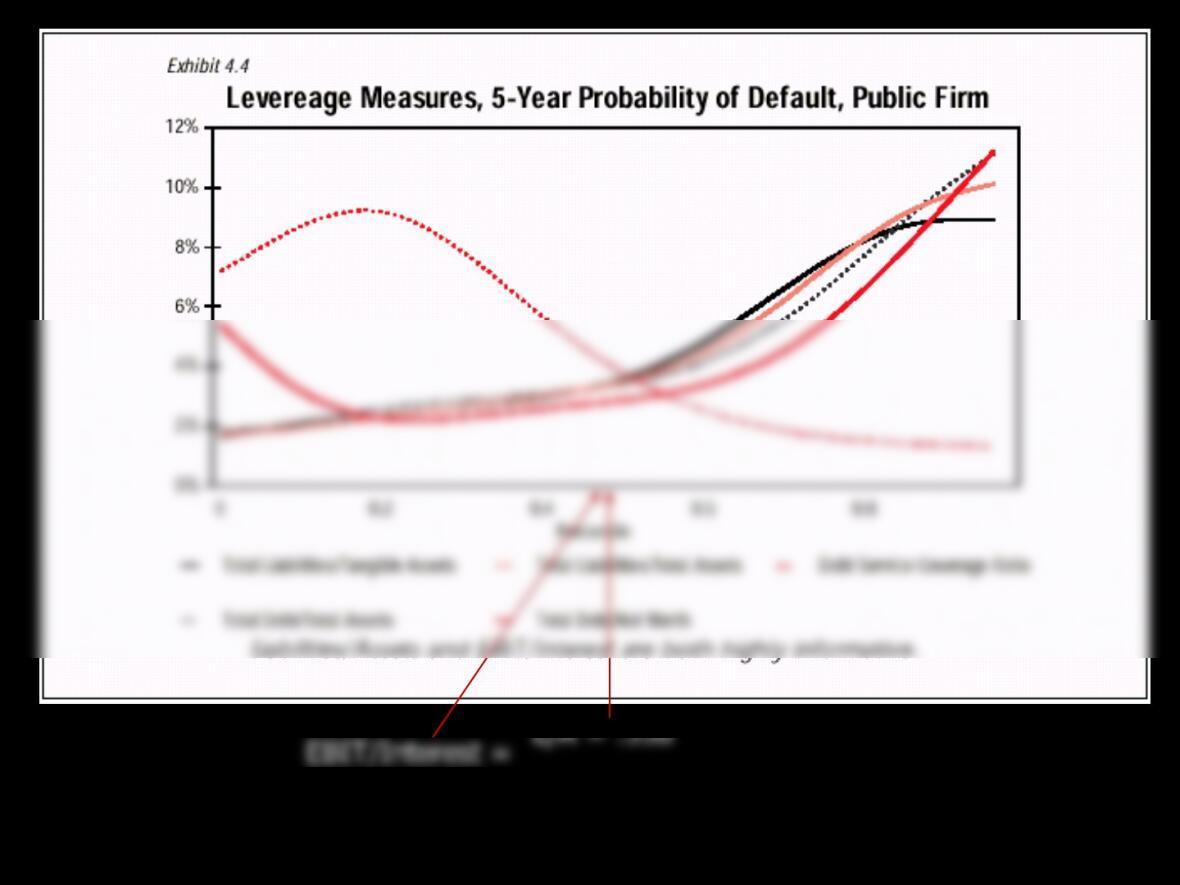
EBIT/Interest Expense less than –17.4 –17.4 to –3.6 –3.6 to –.139 -.139 to 1.25 …
implied default probability 7.50% 9% 8.50% 7% …
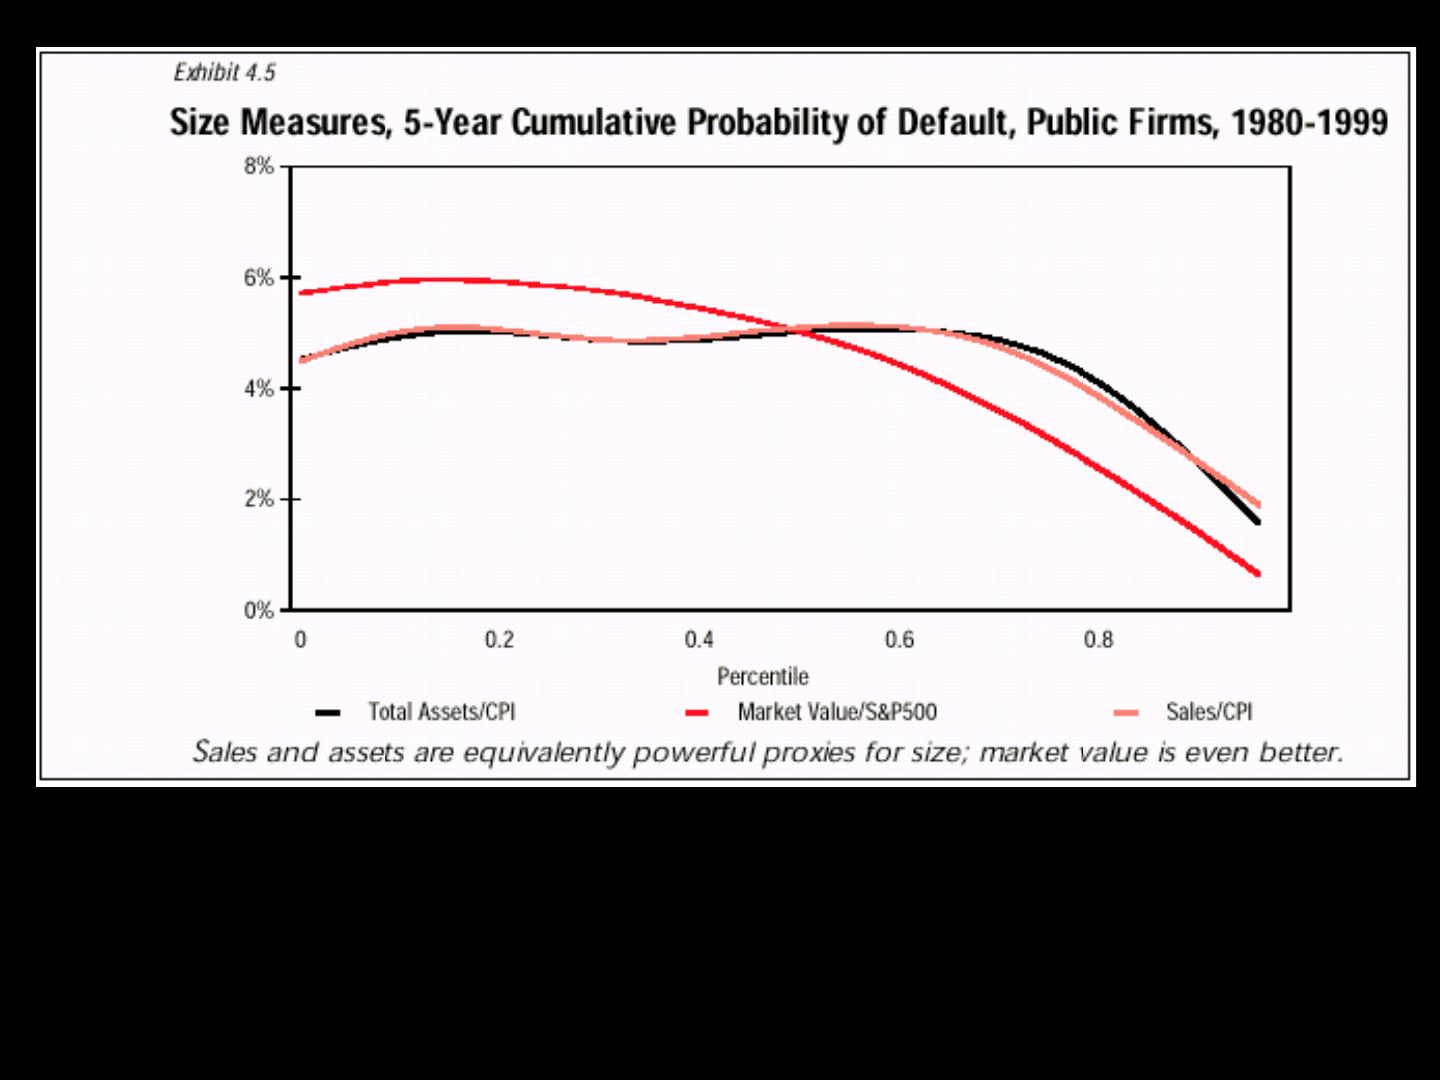
Total Assets/CPI (in millions)
less than 2.64 2.64 to 6.38 6.38 to 13.3 13.3 to 25.3 …
implied default probability … … … … …
Table 2: Modified RiskCalc Model
(apply these weights to the individual default probabilities from the graphs)
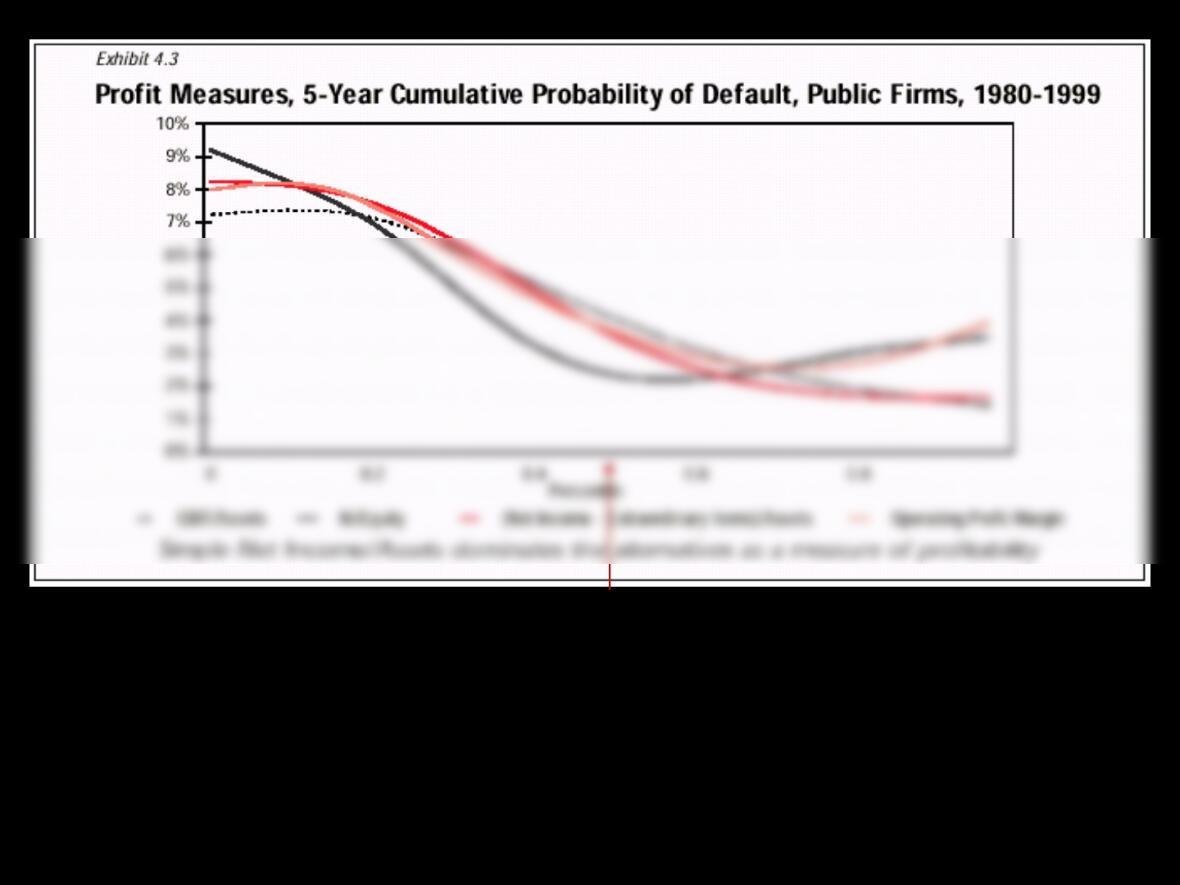
Profitability NI/Total Assets 9%
Moody’s RiskCalc Model